EMPLOYMENT IN CONSTRUCTION PREVENTED AN INCREASE IN
NON-AGRICULTURAL UNEMPLOYMENT
Seyfettin Gürsel
*Gökçe Uysal
∗∗and Ayşenur Acar
∗∗∗Executive Summary
Seasonally adjusted labor market data shows that non-agricultural unemployment rate decreased from 11.3
percent to 11.2 percent in the period of April 2012. Increase in both service and manufacturing remained
limited in line with the low growth rate; however we observe that an increase in construction employment
prevented an increase in non-agricultural unemployment.
There is a slowdown in the non-agricultural labor market
According to the labor market statisics released by TurkStat on July 16
th, in the period of April 2012 (March –
April – May) non-agricultural labor force only increased by 458 thousand ( 2.2 percent), non-agricultural
employment increased by 694 thousand (3.9 percent) and the number of unemployed persons in
non-agricultural decreased by 236 thousand to 2 million 325 thousand on a year-on-year basis (Figure 1).
Non-agricultural unemployment rate has been decreasing parallel to stagnation in increase in employment and
labor force for past three periods.
Figure 1 Year-on-year changes in non-agricultural labor force, employment and unemployment
Source: TurkStat, Betam
* Prof. Seyfettin Gürsel, Betam, Director, [email protected]
∗∗ Assoc. Prof. Gökçe Uysal, Betam, Vice Director, gokce.uysal @bahcesehir.edu.tr ∗∗∗ Ayşenur Acar, Betam, Research Assistant, [email protected]
May 15, 2012
Labor Market Outlook:
July 2012
Seasonally adjusted non-agricultural unemployment stagnates
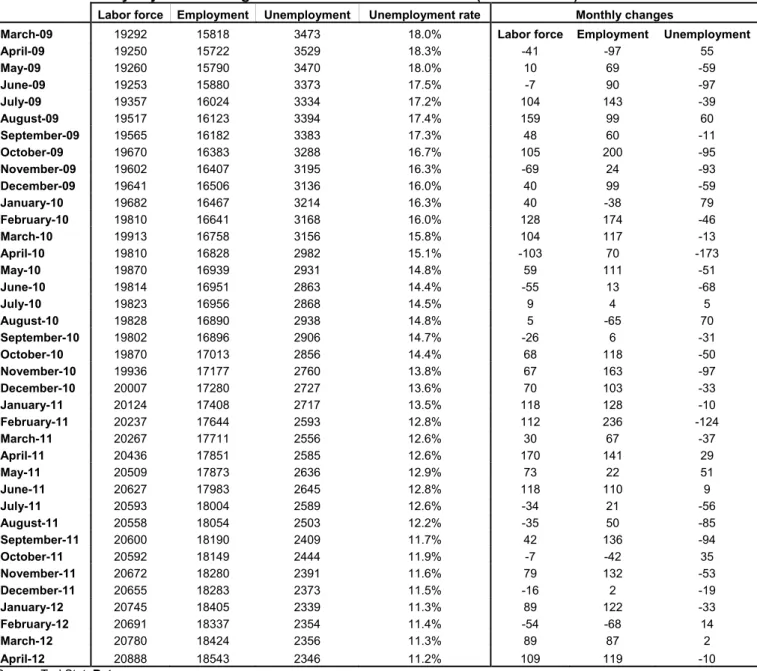
According to seasonally adjusted series, non-agricultural labor force increased by 109 thousand to 20 million
888 thousand in the period of April compared to the period of March 2012 (Figure 2, Table 1).
Non-agricultural employment increased by 119 thousand and reached 18 million 543 thousand. Consequently,
the number of unemployed persons in non-agricultural sectors decreased by 10 thousand and seasonally
adjusted non-agricultural unemployment rate decreased by 0.1 percentage point from 11.3 percent to 11.2
percent (Figure 2). Increases in employment and in labor force both slowed down leading to slight declines in
the non-agricultural unemployment rate.
Figure 2 Seasonally adjusted non-agricultural labor force, employment and unemployment
Source: TurkStat, Betam
According to Kariyer.net series non-agricultural employment will continue to stagnate in the
period of May 2012
In the previous research briefs, we used seasonal and calendar adjusted application per vacancy series
released by Kariyer.net. However, we started using total vacancy series as the total application series
contains a structural break due to technical difficulties since April 2012
1.
According to data released by Kariyer.net the vacancy series provided by the firms in the previous period
pointed to a decline in non-agricultural unemployment rate for the period of April 2012. Data from April 2012
verified this expectation. Current Kariyer.net series show a slight increase in non-agricultural unemployment
rate. We believe that non-agricultural unemployment rate will remain stagnant in the next period considering
the labor force market indicators in the past periods.
1
Seasonal and calendar adjustment procedure is applied to total vacancy series released by Kariyer.net. Total vacancy series is continuously increasing given that the customers base of Kariyer.net is widening overtime. Therefore we calculate the cycle of the series by subtracting the absolute number from the trend calculated by a Hodrick-Prescott fitler. Since the changes in the number of vacancies are negatively correlated with the changes in unemployment we use the inverse of total vacancy series by multiplying it with -1. Although this vacancy series are not as strong forecasters as the application per vacancy series, it gives an idea for the direction of non-agricultural unemployment.
Figure 3 Seasonally adjusted non-agricultural unemployment rate and total vacancy cycle
Data source: Kariyer.net, TurkStat, Betam
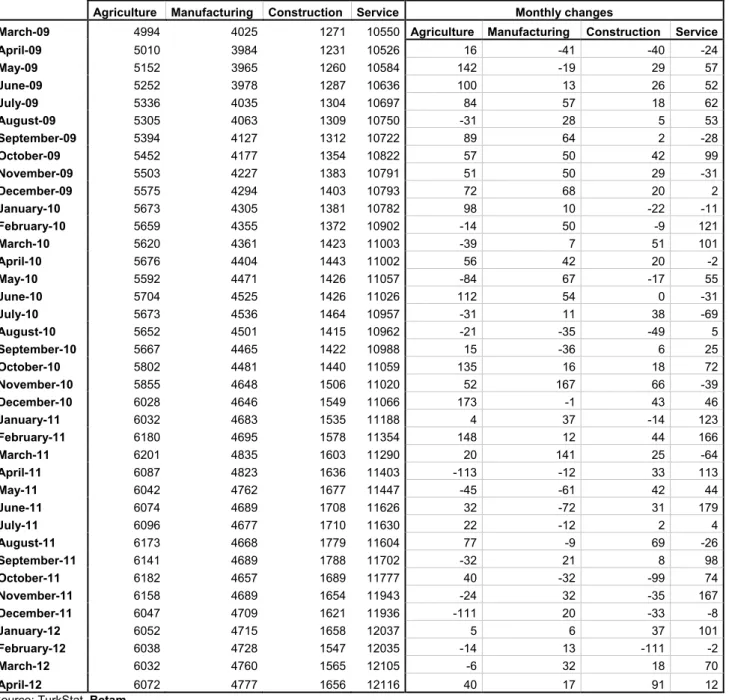
Construction employment increased by 5.8 percent in a single period
2According to seasonally adjusted figures, construction employment increased by 91 thousand in the period
of April 2012(Table 2, Figure 4). This indicates a 5.8 percent increase from the period of March to the period
of April. Strong increase in construction employment, which has been decreasing since the period of
October 2011, is surprising. New developments in the construction sector should be monitored closely.
Service and manufacturing employment increased by 12 thousand and 17 thousand, respectively. We
oberve that low growth rate has an effect on service and manufacturing employment. However, abnormal
increase in construction employment prevented an increase in non-agricultural unemployment.
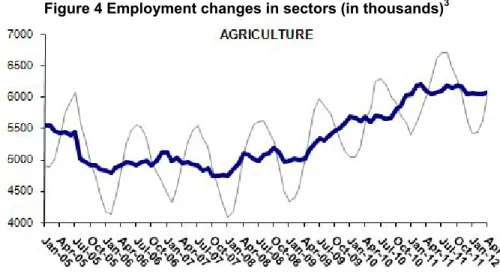
Agricultural employment had been decreasing since October 2011. In April 2012, it increased by 40
thousand.
2 Seasonal adjustment procedure is applied to each sector of employment series separately. Hence the sum of these series may
differ from the seasonally adjusted series of total employment. The difference stems from the non-linearity of the seasonal adjustment process.
Table 1 Seasonally adjusted non-agricultural labor force indicators (in thousands)
Labor force Employment Unemployment Unemployment rate Monthly changes
March-09 19292 15818 3473 18.0% Labor force Employment Unemployment
April-09 19250 15722 3529 18.3% -41 -97 55 May-09 19260 15790 3470 18.0% 10 69 -59 June-09 19253 15880 3373 17.5% -7 90 -97 July-09 19357 16024 3334 17.2% 104 143 -39 August-09 19517 16123 3394 17.4% 159 99 60 September-09 19565 16182 3383 17.3% 48 60 -11 October-09 19670 16383 3288 16.7% 105 200 -95 November-09 19602 16407 3195 16.3% -69 24 -93 December-09 19641 16506 3136 16.0% 40 99 -59 January-10 19682 16467 3214 16.3% 40 -38 79 February-10 19810 16641 3168 16.0% 128 174 -46 March-10 19913 16758 3156 15.8% 104 117 -13 April-10 19810 16828 2982 15.1% -103 70 -173 May-10 19870 16939 2931 14.8% 59 111 -51 June-10 19814 16951 2863 14.4% -55 13 -68 July-10 19823 16956 2868 14.5% 9 4 5 August-10 19828 16890 2938 14.8% 5 -65 70 September-10 19802 16896 2906 14.7% -26 6 -31 October-10 19870 17013 2856 14.4% 68 118 -50 November-10 19936 17177 2760 13.8% 67 163 -97 December-10 20007 17280 2727 13.6% 70 103 -33 January-11 20124 17408 2717 13.5% 118 128 -10 February-11 20237 17644 2593 12.8% 112 236 -124 March-11 20267 17711 2556 12.6% 30 67 -37 April-11 20436 17851 2585 12.6% 170 141 29 May-11 20509 17873 2636 12.9% 73 22 51 June-11 20627 17983 2645 12.8% 118 110 9 July-11 20593 18004 2589 12.6% -34 21 -56 August-11 20558 18054 2503 12.2% -35 50 -85 September-11 20600 18190 2409 11.7% 42 136 -94 October-11 20592 18149 2444 11.9% -7 -42 35 November-11 20672 18280 2391 11.6% 79 132 -53 December-11 20655 18283 2373 11.5% -16 2 -19 January-12 20745 18405 2339 11.3% 89 122 -33 February-12 20691 18337 2354 11.4% -54 -68 14 March-12 20780 18424 2356 11.3% 89 87 2 April-12 20888 18543 2346 11.2% 109 119 -10
Table 2 Seasonally adjusted sector of employment (in thousands)
Agriculture Manufacturing Construction Service Monthly changes
March-09 4994 4025 1271 10550 Agriculture Manufacturing Construction Service
April-09 5010 3984 1231 10526 16 -41 -40 -24 May-09 5152 3965 1260 10584 142 -19 29 57 June-09 5252 3978 1287 10636 100 13 26 52 July-09 5336 4035 1304 10697 84 57 18 62 August-09 5305 4063 1309 10750 -31 28 5 53 September-09 5394 4127 1312 10722 89 64 2 -28 October-09 5452 4177 1354 10822 57 50 42 99 November-09 5503 4227 1383 10791 51 50 29 -31 December-09 5575 4294 1403 10793 72 68 20 2 January-10 5673 4305 1381 10782 98 10 -22 -11 February-10 5659 4355 1372 10902 -14 50 -9 121 March-10 5620 4361 1423 11003 -39 7 51 101 April-10 5676 4404 1443 11002 56 42 20 -2 May-10 5592 4471 1426 11057 -84 67 -17 55 June-10 5704 4525 1426 11026 112 54 0 -31 July-10 5673 4536 1464 10957 -31 11 38 -69 August-10 5652 4501 1415 10962 -21 -35 -49 5 September-10 5667 4465 1422 10988 15 -36 6 25 October-10 5802 4481 1440 11059 135 16 18 72 November-10 5855 4648 1506 11020 52 167 66 -39 December-10 6028 4646 1549 11066 173 -1 43 46 January-11 6032 4683 1535 11188 4 37 -14 123 February-11 6180 4695 1578 11354 148 12 44 166 March-11 6201 4835 1603 11290 20 141 25 -64 April-11 6087 4823 1636 11403 -113 -12 33 113 May-11 6042 4762 1677 11447 -45 -61 42 44 June-11 6074 4689 1708 11626 32 -72 31 179 July-11 6096 4677 1710 11630 22 -12 2 4 August-11 6173 4668 1779 11604 77 -9 69 -26 September-11 6141 4689 1788 11702 -32 21 8 98 October-11 6182 4657 1689 11777 40 -32 -99 74 November-11 6158 4689 1654 11943 -24 32 -35 167 December-11 6047 4709 1621 11936 -111 20 -33 -8 January-12 6052 4715 1658 12037 5 6 37 101 February-12 6038 4728 1547 12035 -14 13 -111 -2 March-12 6032 4760 1565 12105 -6 32 18 70 April-12 6072 4777 1656 12116 40 17 91 12
Figure 4 Employment changes in sectors (in thousands)
3Source: TurkStat, Betam