NONAGRICULTURAL UNEMPLOYMENT STAGNATED
Seyfettin Gürsel
*Gökçe Uysal
and Mine Durmaz
Abstract
Seasonally adjusted labor market data shows that nonagricultural unemployment rate remained constant at the
level of 12.7 percent. According to the Betam forecasting model based on Kariyer.net data, nonagricultural
employment rate will increase in the period of November 2014.
Nonagricultural labor force is soaring
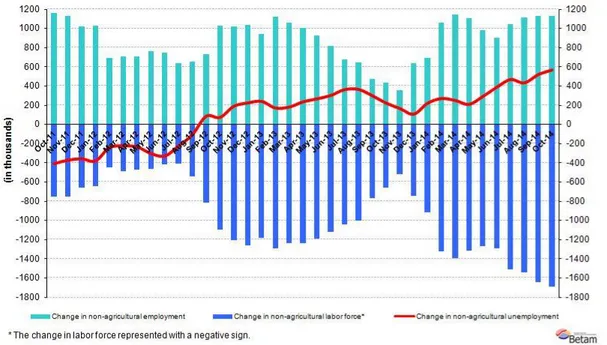
According to data released by TurkStat in the period of October 2014, non-agricultural labor force increased by 1
million 692 thousand (7.7 percent), non-agricultural employment increased by 1 million 128 thousand (5.8 percent)
and non-agricultural unemployment increased by 564 thousand compared to the same period in the previous year
(Figure1). Although yearly increases in nonagricultural employment amount more than 1 million during last four
periods, they are not enough to absorb accelerating expansion in nonagricultural labor force. Indeed, increases in
nonagricultural labor force have grown gradually and the increase in nonagricultural labor force in the period of
October 2015 was recorded to be more than 1.5 million. On the other hand, we think that these changes should be
interpreted cautiously due to the revision in labor market statistics held in February 2014.
Figure 1 Year-on-year changes in non-agricultural labor force, employment, and unemployment
Source: TurkSTAT, Betam
Non-agricultural unemployment rate remained constant
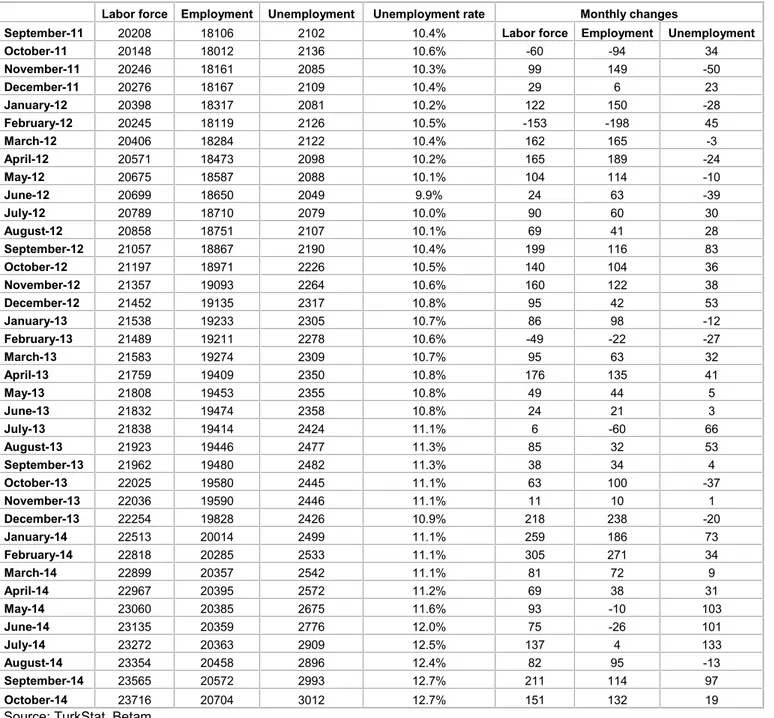
According to seasonally adjusted data, non-agricultural labor force increased by 151 in the period of October 2014
compared to the period of September 2014, and reached 23 million 716 thousand (Figure 2, Table 1).
Nonagricultural employment recorded 20 million 704 thousand, increasing by 132 thousand. Hence, the number of
*Prof. Dr. Seyfettin Gürsel, Betam, Director,[email protected] Yrd. Doç. Dr. Gokce Uysal, Betam, Vice Director,[email protected] Mine Durmaz, Betam, Research Assistant,[email protected]
Labor Market Outlook:
January 2015
www.betam.bahcesehir.edu.tr
2
persons unemployed in nonagricultural sectors increased by 19 thousand and in October 2014 nonagricultural
unemployment rate remained constant at the level of 12.7 percent compared to September 2014.
Figure 1 Seasonally adjusted non-agricultural labor force, employment, and unemployment
Source: TurkSTAT, Betam
Unemployment will increase in the period of November 2014
Kariyer.net's
1application per vacancy series used in the Betam forecasting model is depicted in Figure 3.
Strikingly, the increase in applications per vacancy series has accelerated since the period of August 2014.
Kariyer.net data indicates that this increase will continue in the period of November 2014. Moreover, Betam's
forecasting model predicts that non-agricultural unemployment will increase in the next period (November 2014).
2Figure 2 Seasonally adjusted non-agricultural unemployment rate and application per vacancy
Source: Kariyer.net, TurkSTAT, Betam
1 Betam has ben calculating aplication per vacancy using series released by Kariyer.net for a while. Seasonal and calendar adjustment
procedure is aplied to aplication per vacancy series. A decrease in aplications per vacancy may be caused by an increase in vacancies or by a decrease in the number of aplications. An increase in vacancies signals economic growth while decreasing number of aplications indicates a decrease in number of people loking for a job. Monthly labor market series released by TurkStat is the average of thre months. Therefore, aplication per vacancy statistics calculated using Kariyer.net series is the average of thre months as wel.
2 For detailed information on Soybilgen's forecasting model, please see Betam Research Brief 168 titled as "Kariyer.net Verisiyle Kısa Vadeli Tarım Dışı İşsizlik Tahmini"
Increasing employment in non-agricultural sectors
According to seasonally adjusted labor market series, employment increased in all sectors except the agriculture in
the period of October 2014 (Figure 4, Table2).
3In this period, employment in manufacturing sector increased by 47
thousand and employment in service sector increased by 69 thousand.
3Employment in each sector is seasonally adjusted separately. Hence the sum of these series may differ from the seasonally adjusted series of
total employment. The difference stems from the non-linearity of the seasonal adjustment process. .
www.betam.bahcesehir.edu.tr
4
Figure 3 Employment by sectors (in thousands)
Table 1 Seasonally adjusted non-agricultural labor force indicators (in thousands)*
Labor force Employment Unemployment Unemployment rate Monthly changes
September-11 20208 18106 2102 10.4% Labor force Employment Unemployment
October-11 20148 18012 2136 10.6% -60 -94 34 November-11 20246 18161 2085 10.3% 99 149 -50 December-11 20276 18167 2109 10.4% 29 6 23 January-12 20398 18317 2081 10.2% 122 150 -28 February-12 20245 18119 2126 10.5% -153 -198 45 March-12 20406 18284 2122 10.4% 162 165 -3 April-12 20571 18473 2098 10.2% 165 189 -24 May-12 20675 18587 2088 10.1% 104 114 -10 June-12 20699 18650 2049 9.9% 24 63 -39 July-12 20789 18710 2079 10.0% 90 60 30 August-12 20858 18751 2107 10.1% 69 41 28 September-12 21057 18867 2190 10.4% 199 116 83 October-12 21197 18971 2226 10.5% 140 104 36 November-12 21357 19093 2264 10.6% 160 122 38 December-12 21452 19135 2317 10.8% 95 42 53 January-13 21538 19233 2305 10.7% 86 98 -12 February-13 21489 19211 2278 10.6% -49 -22 -27 March-13 21583 19274 2309 10.7% 95 63 32 April-13 21759 19409 2350 10.8% 176 135 41 May-13 21808 19453 2355 10.8% 49 44 5 June-13 21832 19474 2358 10.8% 24 21 3 July-13 21838 19414 2424 11.1% 6 -60 66 August-13 21923 19446 2477 11.3% 85 32 53 September-13 21962 19480 2482 11.3% 38 34 4 October-13 22025 19580 2445 11.1% 63 100 -37 November-13 22036 19590 2446 11.1% 11 10 1 December-13 22254 19828 2426 10.9% 218 238 -20 January-14 22513 20014 2499 11.1% 259 186 73 February-14 22818 20285 2533 11.1% 305 271 34 March-14 22899 20357 2542 11.1% 81 72 9 April-14 22967 20395 2572 11.2% 69 38 31 May-14 23060 20385 2675 11.6% 93 -10 103 June-14 23135 20359 2776 12.0% 75 -26 101 July-14 23272 20363 2909 12.5% 137 4 133 August-14 23354 20458 2896 12.4% 82 95 -13 September-14 23565 20572 2993 12.7% 211 114 97 October-14 23716 20704 3012 12.7% 151 132 19
6
Table 2 Seasonally adjusted employment by sectors (in thousands)*
Agriculture Manufacturing Construction Service Monthly changes
September-11 5384 4866 1759 11480 Agriculture Manufacturing Construction Service
October-11 5414 4823 1679 11510 30 -43 -80 30 November-11 5406 4870 1669 11622 -8 47 -10 112 December-11 5329 4873 1635 11659 -77 3 -34 37 January-12 5333 4864 1709 11745 4 -9 74 86 February-12 5276 4808 1565 11746 -57 -56 -144 1 March-12 5222 4850 1580 11853 -54 42 15 107 April-12 5249 4930 1653 11890 27 80 73 37 May-12 5292 4908 1728 11951 43 -22 75 61 June-12 5249 4900 1749 12001 -43 -8 21 50 July-12 5259 4926 1742 12041 10 26 -7 40 August-12 5257 4892 1762 12097 -2 -34 20 56 September-12 5320 4911 1777 12179 63 19 15 82 October-12 5358 4917 1779 12274 38 6 2 95 November-12 5365 5003 1800 12289 7 86 21 15 December-12 5346 5051 1775 12309 -19 48 -25 20 January-13 5331 5073 1811 12349 -15 22 36 40 February-13 5298 5023 1799 12389 -33 -50 -12 40 March-13 5281 5083 1785 12406 -17 60 -14 17 April-13 5269 5176 1807 12425 -12 93 22 19 May-13 5207 5200 1755 12498 -62 24 -52 73 June-13 5178 5163 1790 12521 -29 -37 35 23 July-13 5193 5146 1739 12529 15 -17 -51 8 August-13 5217 5117 1754 12575 24 -29 15 46 September-13 5211 5096 1777 12607 -6 -21 23 32 October-13 5120 5090 1845 12645 -91 -6 68 38 November-13 5077 5064 1802 12724 -43 -26 -43 79 December-13 5060 5131 1892 12804 -17 67 90 80 January-14 5402 5232 1945 12838 342 101 53 34 February-14 5530 5359 2011 12915 128 127 66 77 March-14 5600 5365 1979 13013 70 6 -32 98 April-14 5563 5373 1906 13116 -37 8 -73 103 May-14 5563 5364 1864 13157 0 -9 -42 41 June-14 5487 5332 1814 13213 -76 -32 -50 56 July-14 5411 5243 1821 13299 -76 -89 7 86 August-14 5369 5257 1855 13346 -42 14 34 47 September-14 5354 5306 1870 13395 -15 49 15 49 October-14 5354 5353 1887 13464 0 47 17 69