Photoacoustic effect as a liquid absorbance detector
Abdullah AtalarA theoretical treatment of the photoacoustic effect for a liquid enclosed in a cylindrical cell is given. Simple analytical expressions for the photoacoustic signal are derived for cw and pulse modulation schemes. Mod-ulation frequency or pulse width dependence of the photoacoustic signal is discussed. For the cw modula-tion scheme it is found that more photoacoustic power is generated in a resonant cell than a nonresonant cell at the expense of bandwidth reduction. Conditions leading to 1/f dependence of the signal on modulation frequency are given. Experimental results are presented that support the simplified treatments. Eventual sensitivities of various excitation schemes under optimum conditions are calculated.
1. Introduction
The photoacoustic effect that was discovered 100 years ago has recently been used to study the optical
absorption of gases,1 liquids,2 and solids3for modulation
frequencies in the 10-Hz to 1-GHz range. It is an im-portant alternative to standard techniques of measuring small absorption coefficients. Being a zero base line technique makes it particularly attractive.
The photoacoustic effect has been employed in ab-sorbance measurements basically by two techniques. The first technique requires the sample to be placed in an enclosed cell. The incident light is chopped at frequencies ranging from 10 Hz to 1 kHz (cw modula-tion), and a sensitive microphone is used to pick up the pressure variations.' From a simple theory one may expect the photoacoustic signal to increase with the modulation frequency.4 However, the photoacoustic pressure signal for this geometry is observed to vary inversely with the chopping frequency. We will sim-plify the existing5'6 theories as much as possible to provide a physical explanation for this behavior. The apparent discrepancy between these two expectations will be clarified, and it will be shown that at high frequencies the photoacoustic signal indeed increases with frequency. We will also discuss the effect of the light beam radius on the output signal.
The second technique uses pulsed light sources and piezoelectric transducers. Measurement of liquid
ab-When this work was done the author was with Hewlett-Packard Laboratories, Palo Alto, California 94304; he is now with Middle East Technical University, Department of Electrical Engineering, Inonu Bulvari, Ankara, Turkey.
Received 26 April 1980. 0003-6935/80/183204-07$00.50/0.
© 1980 Optical Society of America.
sorption coefficients as low as 10-6 cm-' has been
re-ported.7 A theoretical treatment of the pulsed system for spherical geometry was given.8 9 In this paper we
will develop a model for a cylindrical geometry pulsed system and find an analytical expression for the ther-moelastic pulse.
The results of the photoacoustic experiments using both modulation techniques (cw and pulsed) will be presented. The measurements will be compared to theoretical calculations. Reasonable agreement sup-ports the validity of simplified treatments. Finally cw
and pulsed modulation schemes will be compared, and the maximum achievable sensitivities for these systems
will be given.
11. Continuous Wave Modulation
In this section we will consider the cw modulation technique for photoacoustic excitation. We will obtain expressions for the acoustic power for both free space and enclosed volume.
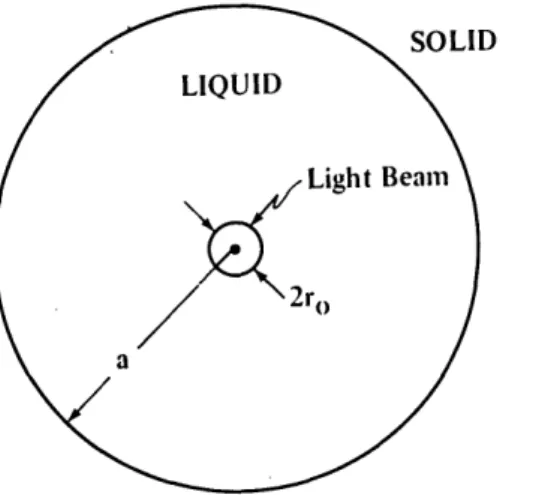
Referring to the cylindrical geometry shown in Fig. 1, the liquid is illuminated by a collimated laser source of power Po and radius r. The laser light is sinusoidally modulated at frequency A. Intensity of the laser is represented by Io exp(-r2/ro) exp(-jwt). The liquid
is contained in an infinitely long solid material of cy-lindrical shape.
The coupled thermoelastic equations for temperature r and displacement potential -1 in a liquid are given by the following equations0:
KV2T - pc,(bT/?t) + I3T0BV2(b4/at) = -St,
V2 - (/C)(b2b/)t2) = ,
(1) (2)
where K i the thermal conductivity, cp is the heat ca-pacity, p is the density, To is the ambient temperature, B is the isothermal bulk modulus, is the volume
Fig. 1. Geometry of the cylindrical photoacoustic system under consideration.
coefficient of thermal expansion, C is the velocity of sound, all for the liquid under consideration. St rep-resents the thermal energy source due to optical
ab-sorption. We will neglect the effect of acoustic wave on
temperature [last term on the left-hand side of Eq. (1)] so that Eq. (1) is a simple thermal diffusion equation.
The solution of this equation will be used in the acoustic wave equation [Eq. (2)] as the source of acoustic
en-ergy.
For a sinusoidally modulated laser we can write
thermal energy source St as
St = Io exp(-r2/ri) exp(-jot)(b/az)[1 - exp(-az)], where a is the absorption coefficient of light in the liq-uid. If a is small we can write
St = aIo exp(-r2/r2) exp(-jwt). Hence, Eq. (1) reduces to
KV2T + jWpCpT = -aIo exp(-r2/r2),
with exp(-jwt) time dependence suppressed.
The thermal diffusion length (where the temperature
is down by e-l) is
+2ad/c,where
ad = K/PCpis the
thermal diffusivity. For water, ad = 1.46 X 10⁻⁷m2/ sec.5 For a modulation frequency of 100 Hz the thermal
diffusion length is only 21 Aim. The thermal diffusion length reduces as the modulation frequency is in-creased.
Since the diffusion length is small we will neglect the
thermal diffusion all together and assume that the temperature is related to the thermal source as
fol-lows:
f = -aIo exp(-r2/r2)/(Wcp). (3) We note that, as the modulation frequency is decreased,
the modulation amplitude of the temperature increases.
The expression loses its validity at very low frequencies since thermal diffusion is no longer negligible.
Sub-stituting Eq. (3) into Eq. (2) we fina
V2d + (W2/C2)j = jfOaIo exp(-r2/r2)/(tpcp). (4)
This is an acoustic wave equation with a source term on
the right-hand side. We will use the Green's function method to solve it.
A. Free-Space Solution
If the liquid is enclosed in an acoustically matched cell, there will be no internal reflections, and hence the solution in the cell is the free-space solution. In cylin-drical coordinates the Green's function for V24 + k24Ž
- - r')/r in free space is given by8"'1
G(rr') =-(j/4)Jo(kr')Ho(dr) for r > r'.
Therefore, the solution of Eq. (4) is written as
4(r) = E aIOHO(kr)
5
r'Jo(kr') exp(-r'2/r2)dr',2wpcp o
where k = coC. Since
(5)
S
t exp(-a 2t2)Jo(bt)dt = exp(-b2/4a2)/2a2,120
we find
'b(r) = oaPo exp(-k2r0/4)Ho(kr), 4copcp
where Po = Ioirr2 is the laser power, and Ho is the
zer-oth-order Bessel function of the third kind (Hankel function). Radial velocity and stress are given by
Vr = -jwa,14/ar = (j/3aPok)/(4pcp) exp(-k2r2/4)Hl(kr),
Trr= _p ! = -c3aPo/(4cp) exp(-k2r2/4)Ho(kr).
Therefore, the acoustic power available in area S at radial distance r is'3
ca0f2a2pi, S PA = Re(-VrTrr)S = 2
exp(-k2ro/2)--87rpcp r (6)
The exponential factor in Eq. (6) expresses the depen-dence of the acoustic power on the light beam radius.
The available power reduces if the beam radius exceeds
the acoustic wavelength. For small beam size, Eq. (6) simplifies to
p f2a2P2 S
PA = 8irpc2, rr (7)
Equation (7) predicts that the acoustic power is pro-portional to the modulation frequency and to the square of the absorbed light power. This result is consistent with the results of Westervelt and Larson.4
B. Enclosed Cell Solution
If one uses a pressure. transducer instead of a matched
transducer, the free-space solution is not appropriate. In this case one has to include the effect of boundaries.
We will now solve Eq. (4) when the liquid is contained
in a cylindrical shaped solid container of radius a and infinite in length. We will assume that the elastic constant and the density for the solid are large, so that we can use rigid boundary conditions. Furthermore, we will approximate spatial distribution of the laser beam with a delta function. We assume a solution of
the following form:
(N = fl PO [Ho(kr) + AJo(kr)] for r <a. 4 wpCp
The solution is selected in such a way that it reduces to the free-space solution as a -
.
Now we apply the boundary condition at r
=
a; the displacement at r =?a is zero:Ur = 60/brIr-a = 0 or A = -H(ka)IJi(ka),
Hence displacement potential cI is given by
b(r) = °H.(kr) I3 - H(kA)Jo(kr)l for r <a.
4wpcp Ji(ka) I
The pressure at r
=
a as experienced by a pressuretransducer is
p(a) = 3 [Ho(ka) - H(kJka)1 or
p(a) = flaPOC 1 27rcpa Jl(ka)
For small ka, J,(ka) behaves like ka/2. Therefore, the pressure at r = a is inversely proportional to modulation frequency. This 1/f dependence agrees favorably with the experimental results reported in the literature.5
Equation (8) is plotted in Fig. 2 as a function of ka. The
/f
dependence at low frequencies can be thought of as due to a resonance at zero frequency. At zero frequency the acoustic impedance of a liquid mediumsurrounded by a solid (even when it is nonrigid) is
infi-nite. As the modulation frequency is increased the impedance of the liquid will decrease (the system goes off resonance), and hence the signal will decrease (it is a 1/f dependence). This holds true for frequencies
<f
= c/(lOa). Above this frequency the pressure increases
until the first resonance condition is satisfied. At the resonance frequency the impedance of the liquid is again infinite since it has rigid boundaries (which is an unreal condition). The same thing will occur at higher resonance frequencies that are at the zeros of the J1 function.
Nonrigid boundary conditions can be taken into ac-count if one includes the elastic constants and density of the surrounding medium. For an isotropic medium an analytical expression for the pressure can be found. If C, C4and p' are the elastic constants14and density
of the solid material, the pressure at r = a is found to
be
(8)
medium. We observe that the pressure at the reso-nance frequencies is now finite. Moreover at low frequencies the pressure at the boundary is decreased as the acoustic mismatch between the liquid and solid is made smaller.
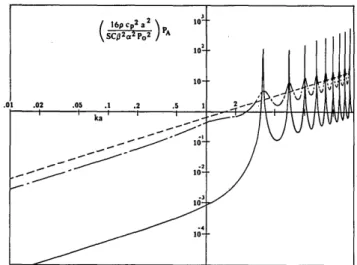
The power available in the solid medium can be found from the Poynting vector. We write the available power as PA = Re(-v*Trr)S, where Vr is the particle velocity,
and Trr is the stress at the boundary. This quantity is plotted in Fig. 3 for water as the liquid and PZT and Lucite as the surrounding medium. In the same graph
Fig. 2. Pressure at r = a as a function of ka for rigid boundary (dashed line), for water-Pyrex glass interface (solid line), and for
water-Lucite interface (dot-dash line).
(
16p
Cp2)
P SCp2.~ p02~
10 10-.0 10 Ii T 2 -44SV4 l U\VJV\JJJJFig. 3. Acoustic power available in the solid medium as a function of ha for a matched cell (dashed line), for water-PZT cell (solid line),
and for a water-Lucite cell (dot-dash line).
p'KaHj(ka)
[Cc
[-C',
4 1k'aI
()
-
Ho(k'a)
+
p'kaJ1(ka) [2 C, (k'a - Ho(k'a)J + pk'aJo(ka)Hj(k'a)
As a check we note that Eq. (9) reduces to Eq. (8) as
- - (rigid boundary) and reduces to free-space solution for p' = p, C = C, and C4 = 0.
Equation (9) is also plotted in Fig. 2 for water as the
liquid and Lucite and Pyrex glass as the surrounding
3206 APPLIED OPTICS / Vol. 19, No. 18 / 15 September 1980
p(a) = P { Ho(ka)
-pk'aHo(ka)Hj(k'a)
IJo(ka)}. (9)
the power available for a matched transducer is also shown [Eq. (7)]. Comparison of the free-space solution with the enclosed cell solution shows that a fully
matched transducer that does not reflect any energy is not necessarily the optimum case, providing a resonant enclosed cell actually generates more acoustic power. This peculiar behavior can be explained by the nature
of the source. The source can be seen as a displacement
source (analogous to a current source in electrical cir-cuits). Therefore, more power will be obtained if the
impedance of the liquid as seen from the source can be
increased. That is precisely what happens at the res-onance: the source must work against the impedance of the solid rather than that of the liquid. One may expect that at the resonance the acoustic power will be
increased by the ratio of impedances of solid and liquid. Therefore, we write the available acoustic power in the
solid medium at the resonance as
Wtfo2a2p2S Z,
A 87rpc2 r Zl (10)
where Wr is the resonant frequency, Z, and ZI are the impedances of solid walls and liquid, respectively. Note
that at the resonance there is a compromise between the
output power and the usable bandwidth (i.e., data rate).
Increasing the Zs/Zi ratio results in a higher power but reduces the bandwidth. On the other hand, at antisonant points the impedance seen by the source is re-duced below the impedance of the liquid. Conse-quently, the available acoustic power is less than the
free-space value. Ill. Pulsed Modulation
We now solve the problem defined in Sec. II for a pulsed light source. We define the intensity of the light source as a function of space and time as Io exp(-r 2/r2)f(t). Hence the energy of one pulse is given
by
E = 2ir if rI exp(-r2/r2)f(t)drdt = Io7rr2 S f(t)dt.
Using the same reasoning of Sec. II, we neglect the thermal diffusion and find that
aT calo exp(-r2/r)f(t), at pcp
1 =24 /321I )g(t), C2at2 p°exp(-r
where g(t) = f f(t)dt.
To get rid of the time dependence we take the Laplace transform of both sides to find
2 = °Io L[f(t)]
V2- -C2 exp(-r2/ro)
pcp S
Using the same Green's function used in Sec. II with the identity of Eq. (5) we write
.faIo7rro C [f(t)] e s2r2
-,(r,s) lor !-sHo(kr) exp C2' 4pcp s "4C2) where k = js/C.
We use the identity Ko(z) = j(ir/2)Ho(jz) (K0is the modified Bessel function) and take the inverse Laplace transform of both sides to find
C>rt) - 2a~or8__ L- 0K0 r) expS
-2pc. s C
If the radius of the laser beam is very small, the last item
in the braces can be neglected. Furthermore we will
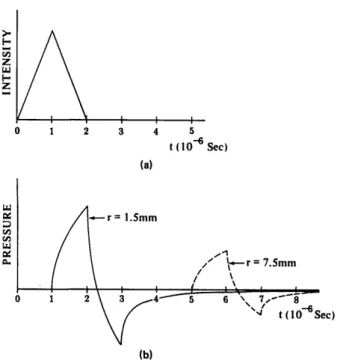
assume that the light intensity changes as a triangular function of time. Let f (t) be defined as
f(t) = 2-tu(t) -4 T u t--l+2 T u(t-T),
where u(t) is the unit step function. f(t) is plotted in
Fig. 4(a).
Since the pressure is related to the displacement potential by
p(r,s)
= -pS2b(r,s), we arrive atp(r,t) _
f3alori2 _[2 Ko (h)'T~
2cP ° ° L-l
-
2 exp (-ys) + exp(-Ts)IJ.Using the transformation'5
O 1 , [o(bs) = Lohlt t < b t > b we finally get p(rt) = alori {coshl(t )u (t - ) -2 cosh-1 [(t_- ]u (t 2 C)
+ cosh
1[(t-T)
u (t-T-)
This function is plotted in Fig. 4(b). Maximum pres-sure is reached at t = T/2 + r/C, and it is given by
pm.(r) = Oaro' cosh1 + C1'
Since the energy of one pulse is given by E
Io7rr2T/2, we find Pmax(r) = 2 T2 cosh1 + c, 2r or approximately Pmax(r) 23aEC1/ 2 1 T3/2CP Vr
The peak power available for a transducer of a distance r is PA (r) =$22a2E S. PA~) -T~cp r (11) area S at (12) We note that this result is very similar to Eq. (7) aside
from a constant factor when we make the change of variable T - 27r/co and EIT - Po. This is consistent
with the previous results. For example, the linear
de-pendence of Pmax on thermal expansion coefficient 3 has
been experimentally verified.'6
z 1= z Z Uj Uj a. I 1 2 3 4 5 t ( 0-6 Sec) (a) *r= 1.5mm = 7.5mm (b)
Fig. 4. (a) Intensity of the light beam as a function of time. (b) Photoacoustic pressure as a function of time at two different
distances.
IV. Experimental Results
In this section we will discuss the results of the
pho-toacoustic experiments using cw and pulsed modulation
and compare the findings to the theoretical equations presented in the previous sections. At low modulation frequencies nonresonant pressure transducers are available, and their sensitivities are expressed in terms of output voltage per unit pressure on the transducers. Therefore, we should use the pressure expression in Eq. (8) for a theoretical prediction. On the other hand, at high frequencies one can define the conversion loss of a transducer, and in this case the available acoustic power expression is useful.
A. Continuous Wave Modulation Technique
An Ar-ion laser capable of generating 1 W is used as
the excitation source. The experiments have been carried out at low modulation frequencies (10 Hz) as well as at high modulation frequencies (500 kHz).
At low frequencies the laser is modulated mechani-cally with a chopper wheel. The light is focused into a photoacoustic cell that consists of a cylindrical PZT material (Edo-Western Corp., Salt Lake City, Utah) with quartz windows on both sides.'7 The output of the
transducer (capacitance of 13 nF) is shunted with a 0.47-,uF capacitor to extend its low frequency range. The sensitivity of the transducer is estimated to be 4.3
AuV/N/m 2.18 The output signal is measured with a
lock-in amplifier for an aqueous solution with absorp-tion coefficient a = 0.027/cm (measured with a spec-trophotometer). The results are shown in Fig. 5 as a function of modulation frequency. The theoretical
results are found using Eq. (8) with = 1.84 X 10⁻⁴/°C,
Po = 0.33 W cp = 4178 J/kg C, and a = 1.6 cm. We get
p(a) (N/M2) = 17.5/f (Hz). Applying the sensitivity of the transducer we arrive at V(MV) = 75/f (Hz). This
is also plotted in Fig. 5 as a solid line.
At high modulation frequencies (500 kHz) an ac-oustooptic modulator is used. The modulated light is focused into a photoacoustic cell that has aluminum walls and quartz windows. A cylindrically focused immersion transducer (KB-Aerotech) converts the acoustic energy into the electrical energy with 9.5-dB loss. The transducer's output is preamplified and then detected with a lock-in amplifier. The experiment is carried out with an aqueous solution of absorption
coefficient a = 0.12/cm. The output signal is observed
to change dramatically with slight changes in the modulation frequency. This behavior agrees with our expectations. The modulation frequency is fine tuned for maximum signal. Under this condition the output signal is plotted in Fig. 5 as a function of input laser
power. A theoretical value can be found using Eq. (10),
which gives the available power at the resonance
frequencies. With , = 2 500 X 103, S = 5 cm2, r = 2.5 cm, and Z,/Z1 = 11.5, we find PA = 8.14 X 10⁻¹²
P2.
Taking the conversion loss of the transducer into account, the voltage output of-the transducer should be
V = 6.76 X 10⁻⁶PO V. This is plotted in Fig. 6 as a solid
line. The expected signal is less than the measured signal, because our theory assumes that the solid walls extend to infinity. The finite thickness of the walls causes additional reflections and increases the output signal. Note that, if 1/f dependence had been true for all frequencies, we should have obtained a signal in the
nanovolt range at this frequency. Our signal is 3 orders
of magnitude greater, supporting the theory that 1/f dependence holds true only for low frequencies.
f (Hz)
Fig. 5. Measured (squares) and calculated (solid line) photoacoustic voltage as a function of modulation frequency. Disagreement be-tween the measured and theoretical values may be attributed to an overestimation of sensitivity of transducer and to neglecting the
en-ergy lost due to fluorescence. 3208 APPLIED OPTICS / Vol. 19, No. 18 / 15 September 1980
V (AV) 0.2- 0.1 0.04 -10 20 40 100' P0(mW)
Fig. 6. Measured (squares) and calculated (solid line) photoacoustic voltage at 500 kHz as a function of light power. Theoretical values are less than the measured values, since the finite thickness of walls
causes additional reflections that are neglected in theory.
EM PA WALL
PICKUP SIGNAL REFLECTION
range with the spectrum of the flashlamp shows that the
usable light energy is only 21 gJ. Substituting these
values in Eq. (12) with r = 3.8 cm gives PA = 2.14 X
10-1 W. Conversion loss and finite bandwidth of the
transducer result in a 20-dB loss, giving an output voltage of 3.3 AzV.
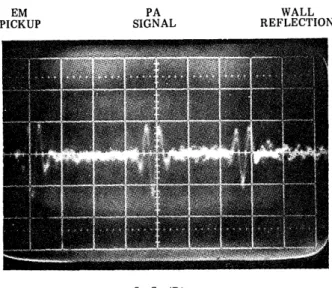
In Fig. 7 an oscilloscope photo of the amplifier output
is shown. The first pulse corresponds to electromag-netic (EM) pickup, the second pulse is the pho-toacoustic signal, and the last one is the acoustic re-flection from the bottom of the cell. The photoacoustic
signal has 1.5-AtV amplitude, which is within 7 dB of the
expected value. The shapes of all the pulses are de-termined by the bandpass network formed by the transducer and its matching network. With a band-width of 200 kHz, the impulse response of the trans-ducer lasts 5 Arsec, which is short enough to separate the EM pickup and wall reflections but not short enough to be compared to the theoretical pulse shape.
V. Discussion
In this section we will compare the various techniques
used in photoacoustic absorbance detection and cal-culate the eventual sensitivities for these techniques.
Equations (7) and (12), which express the available acoustic power for cw and pulsed excitations, are re-peated for comparison:
PA -
2P
0-8ir pC2 r PA = 2a2 E)2S TA=T2 T r (7) (12) 5 iSec/Div
Fig. 7. Oscilloscope photo of the transducer output in response to a short light pulse illuminating the photoacoustic cell.
B. Pulse Modulation Technique
In this experiment we used an EG&G flashlamp (FX-279U) as the photoacoustic exciter. The light
source has a spatial extent of 1.5 mm, and it has an UV
rich spectrum. A short pulse of 1-,sec duration is ob-tained by discharging to the flashlamp 320 mJ stored on a capacitor. Due to the isotropic radiation only a
small fraction of the generated light could be employed.
The usable light energy within the first 2 ,usec is
mea-sured to be 126 AJ. The transducer was the same as
that used in the cw modulation experiment. We used
1:10000 acetone in water as the absorbing medium. The
absorption spectra of the solution is measured to be
0.025/cm in the 240-290-nm range. Comparison of this
For cw modulation the photoacoustic signal power is proportional to the modulation frequency. That is, to measure an absorption coefficient that is half as small, one has to quadruple the modulation frequency. One runs into difficulty when the size of the laser beam be-comes comparable to the acoustic wavelength. This is due to the exponential factor in Eq. (6). Assuming a minimum laser beam radius of 40 Atm, the maximum
modulation frequency in water is 12 MHz. Making a
resonant cell increases the output power by the im-pedance ratio as shown in Eq. (10), but this is at the
expense of reduced bandwidth.
For the pulse modulation case the signal amplitude is proportional to the energy of the pulse. We have to note that the thermal noise level for a pulsed system is greater than that for a cw system of the same output
bandwidth by a factor equal to the reciprocal of the duty cycle. This statement assumes that a boxcar integrator
is used in the pulsed system. Equation (12) tells us that, if pulse duration T is shortened to 0.63T, the
output power will be doubled. However, due to the reduction of the duty cycle, noise increases by 2 dB.
Hence the actual gain in SNR is 4 dB. Therefore, to increase the SNR by 6 dB one has to cut the pulse size in half without changing the pulse energy.
For cw modulation at low frequencies, one has to use nonresonant transducers. In this case Eq. (7) is not useful, instead we employ Eq. (8) to find the output voltage of the transducer:
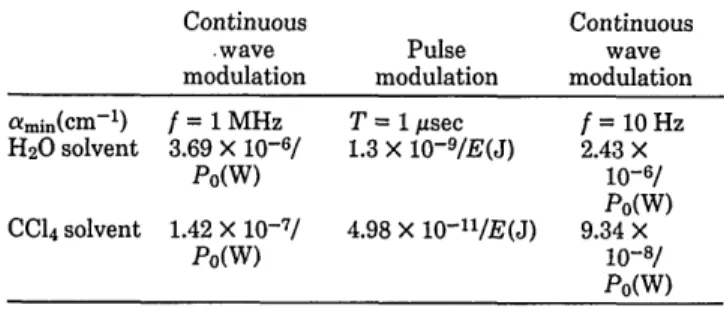
Table 1. Minimum Detectable Absorption Coefficients For Various
Techniques Under the Conditions Given In the Text
Continuous Continuous
wave Pulse wave
modulation modulation modulation
amin(cm-') f = 1 MHz T =1 psec f = 10 Hz H20 solvent 3.69 X 10⁻⁶/ 1.3 X 10⁻⁹/E(J) 2.43 X PO(W) 10-6/ P(W) CC14solvent 1.42 X 10⁻⁷/ 4.98 10-1 11E(J) 9.34 X PO(W) 10-8/ P(W)
V = K flP/C V),
where K is the sensitivity of the transducer in V/N/M2.
The output voltage is inversely proportional to the modulation frequency and square of the cell radius.
The other factors are similar to Eq. (7) or (12). One can
use a radially polarized piezoelectric tube as the trans-ducer. For optimum results a high piezoelectric con-stant material must be used. The transducer can be
modeled as a voltage source in series with a capacitor.
The minimum detectable voltage under unity SNR for a capacitive source driving a resistive load is given by
V14k TB/R/wC, where C is the source capacitance, R is
the load resistance, and B is the bandwidth. Sensitivity of a cylindrical transducer depends on the radius rather than the thickness of the piezoelectric tube.'9 There-fore, the piezoelectric tube should be as thin as possible
to increase the capacitance. But if the tube is too thin, the rigid boundary condition will no longer be true, and the pressure will decrease.
For purposes of comparison, we will calculate the minimum detectable absorption coefficient for all three
techniques as a function of light input power or energy. We take a 1-cm long cell enclosed by a cylindrical
transducer. The assumptions for different techniques
are given below:
(1) Continuous wave modulation (high frequency): modulation frequency is 1 MHz, the cell is at resonance with a wall-to-liquid impedance ratio of 20, one-way
conversion loss of the transducer is 10 dB.
(2) Continuous wave modulation (low frequency); the cell radius is 1 cm, modulation frequency is 10 Hz,
the transducer capacitance is 10 nF (with a load
resis-tance of 10 MQ), the sensitivity is 150 uV/N/m2.
(3) Pulse modulation: pulse duration 1 usec,
repe-tition rate is 20 Hz, one-way conversion loss of the transducer is 10 dB.
For all systems the output bandwidth is 1 Hz, and the
noise figure of the preamplifier is 3 dB. The minimum absorption coefficient is defined when the SNR is unity.
The thermal noise is assumed to be the only noise source. The results are shown in Table I.
To achieve the sensitivities shown for cw modulation techniques, one has to solve the spurious signal problem.
Absorption in the windows, light scattering, and elec-tromagnetic pickup will cause these spurious signals. The pulse system is preferable over cw excitation if
these signals are unavoidable. Moreover, for the same sensitivity the average input light power is less in pulsed
modulation than it is in cw modulation. In other words,
for the same average power the pulse system is more sensitive than the cw system by a factor inversely pro-portional to the duty cycle. This arises from the fact that the photoacoustic effect is a nonlinear process as far as input and output powers are concerned. Using high pulse energies one should be able to measure ab-sorption coefficients not obtainable by other tech-niques.
VIl. Conclusion
We have shown that 1/f frequency dependence at low
frequencies is observed only with pressure transducers
in enclosed cells. Actually the generated acoustic power
increases as the modulation frequency is increased in the cw system or as the pulse duration is decreased in the pulse system. We found that providing a matched cell in the cw case is not the optimum solution. At the expense of bandwidth reduction a resonant cell would generate more power than a nonresonant cell. The pulsed excitation scheme is preferable over the cw sys-tem since it solves the spurious signal problem, and it requires less average light power for the same sensitiv-ity. Even though the photoacoustic conversion is not
an efficient mechanism, use of high pulse energies would
make the measurement of very low absorption coeffi-cients possible, since it is a zero base line technique.
The author would like to acknowledge Dave Bloom
for guidance and valuable discussions during the course
of the work and critical reading of the manuscript. He would like to thank Bob Board for encouragement and Becky Tamura for preparation of the manuscript.
References
1. L. B. Kreuzer, Anal. Chem. 46, 235A (1974).
2. A. C. Tam, C. K. N. Patel, and R. J. Kerl, Opt. Lett. 4, 81 (1979).
3. M. M. Farrow, R. K. Burnham, M. Auzanneau, S. L. Olsen, N. Purdie, and M. E. Eyring, Appl. Opt. 17, 1093 (1978).
4. P. J. Westervelt and R. S. Larson, J. Acoust. Soc. Am. 54, 121 (1973).
5. A. Rosencwaig and A. Gersho, J. Appl. Phys. 47, 64 (1976). 6. F. A. McDonald and G. C. Wetsel, Jr., J. Appl. Phys. 49, 2313
(1978).
7. C. K. N. Patel and A. C. Tam, Appl. Phys. Lett. 34, 467 (1979). 8. C. L. Hu, J. Acoust. Soc. Am. 46, 728 (1969).
9. M. W. Sigrist and F. K. Kneubuhl, J. Acoust. Soc. Am. 64, 1652 (1978).
10. F. A. McDonald, Appl. Opt. 18, 1363 (1979).
11. G. Tyras, Radiation and Propagation of Electromagnetic Waves (Academic, New York, 1969), p. 486.
12. M. Abramowitz and I. A. Stegun, Eds., Handbook of Mathe-matical Functions (Dover, New York, 1965), p. 486.
13. Ref. 12, p. 360.
14. B. A. Auld, Acoustic Fields and Waves in Solids (Wiley, New York, 1973).
15. A. Erdblyi, W. Magnus, F. Oberhettinger, and F. G. Tricomi, Tables of Integral Transforms (McGraw-Hill, New York, 1954), p. 277.
16. A. C. Tam and C. K. N. Patel, Appl. Opt. 18, 3348 (1979). 17. Y. Kohanzadeh, J. R. Whinnery, and M. M. Carroll, J. Acoust.
Soc. Am. 57, 67 (1975).
18. C. P. Germano, J. Acoust. Soc. Am. 34, 1139 (1962). 19. R. A. Langevin, J. Acoust. Soc. Am. 26, 421 (1954). 3210 APPLIED OPTICS / Vol. 19, No. 18 / 15 September 1980