QRS prolongation after cardiac resynchronization therapy
is a predictor of persistent mechanical dyssynchrony
Oguz Karaca1&Onur Omaygenc1&Beytullah Cakal1&Sinem Deniz Cakal1&
Irfan Barutcu1&Bilal Boztosun1&Fethi Kilicaslan1
Received: 18 July 2015 / Accepted: 25 November 2015 / Published online: 1 December 2015 # Springer Science+Business Media New York 2015
Abstract
Purpose Prolonged QRS duration is the main selection crite-rion for cardiac resynchronization therapy (CRT) which ame-liorates left ventricular mechanical dyssynchrony (MD). However, consequences of post-CRT QRS prolongation and residual MD have been poorly evaluated. We aimed to define the predictors of persistent MD and hypothesized that CRT-induced QRS change (ΔQRS) might have an impact on residual MD after CRT.
Methods A total of 80 patients receiving CRT were included in the study.ΔQRS was calculated as the difference between the baseline and paced QRS intervals. Residual MD was assessed early after device implantation with a longitudinal dyssynchrony index (Yu index). Significant MD was defined as a Yu index≥33 msec. Two groups were created based on residual MD and compared according to clinical, electrocar-diographic and echocarelectrocar-diographic features.
Results Patients with persistent MD had longer paced QRS durations (182.5 ± 16.2 vs. 165.4 ±22.5 msec, p = 0.03) and were less likely to have left ventricular (LV) leads located in the posterolateral vein (53 % vs. 85 %, p = 0.002). The linear correlation between the ΔQRS and the Yu index values was modest (Spearman’s rho=−0.341, p=0.002); additionally, a prolonged QRS was strongly associated with MD after CRT (p = 0.00008). Both LV lead localiza-tion and CRT-induced QRS prolongalocaliza-tion emerged as the significant predictors of persistent MD. A biventricularly
paced QRS more than 10 msec longer than the pre-paced QRS width was predictive of persistent MD after CRT (sensitivity = 80 %, specificity = 62 %).
Conclusions ΔQRS was found to be associated with residual MD after CRT. Ten milliseconds of QRS prolongation predict-ed persistent MD after CRT.
Keywords Cardiac resynchronization therapy . Paced QRS . QRS prolongation . Mechanical dyssynchrony
1 Introduction
Cardiac resynchronization therapy (CRT) is associated with improved outcomes in symptomatic heart failure patients with reduced ejection fraction and left bundle branch block (LBBB) [1, 2]. According to the current guidelines, a prolonged QRS interval with a LBBB pattern on the surface electrocardiogram is the main selection criteria and used to determine which patients will benefit from CRT [3,4]. Al-though evaluation of the baseline QRS width is essential prior to device implantation, there has been less interest generated for the CRT-induced QRS prolongation.
Improvement of left ventricular mechanical dyssynchrony is the main target of device therapy in heart failure; the mech-anism of action includes simultaneous activation of the septal and lateral left ventricular walls induced by biventricular pac-ing. Approximately 30 % of patients undergoing CRT do not improve; this is possibly due to ongoing mechanical dyssynchrony after device implantation [5].
The impact and consequences of having a wider QRS du-ration following CRT compared to the pre-CRT value remain unclear. In the current study, we aimed to establish (1) the relationship between the CRT-induced QRS change and me-chanical dyssynchrony index early after CRT, (2) a cut-off * Oguz Karaca
1 Cardiology Department, Medipol University Faculty of Medicine,
level for QRS prolongation to predict ongoing mechanical dyssynchrony and (3) predictors of post-implantation me-chanical dyssynchrony in CRT recipients.
2 Methods
2.1 Patient selection
Ninety-six patients in a single tertiary clinic who received CRT/implantable cardioverter-defibrillator system (CRT-D) devices between April 2013 and September 2014 were initial-ly included in the study. All patients had a left ventricular ejection fraction (LVEF)≤35 %, increased QRS duration (≥130 msec) and symptomatic (NYHA II-IV) heart failure prior to implantation (as compatible with current guidelines). Patients with pre-existing complete atrioventricular block or those with a pacemaker upgraded to CRT were not included in the study. After exclusion of patients without a suitable elec-trocardiogram (ECG) to calculate both pre-CRT and post-CRT QRS width (6 patients), or those with inadequate echocardio-graphic window for analyses (9 patients), 80 consecutive pa-tients constituted the final study population. All papa-tients were assessed with pre-operative clinical, laboratory and echocar-diographic features as well as post-implantation QRS intervals on the ECG and mechanical dyssynchrony on the echocardi-ography. The local ethics committee approved the study pro-tocol, and a written informed consent was obtained from all participants.
2.2 Device implantation and programming
All patients had a permanent biventricular device implanted by using a left subclavian vein puncture. The right atrial and ventricular leads were positioned conventionally. Following a coronary sinus angiography, the left ventricular (LV) lead was inserted preferably in the posterolateral vein, as is recom-mended [6]. The exact LV lead location in the coronary sinus (anterior, lateral, posterior or posterolateral) was determined according to the post-operative chest X-rays [7]. All leads were connected to either a biventricular pacemaker (CRT-P) or CRT-D, depending on the clinical indication or operator’s choice. atrioventricular (AV) and interventricular (VV) inter-vals were set to a default value of 100 and 20 msec (LV preceding regurgitant volume (RV)), respectively. Both AV and VV intervals were checked for optimization by echocar-diography in the next day of device implantation. The AV interval was optimized based on the previously well-defined method (iterative method) used in the CARE-HF trial [1]. The VV interval was optimized based on the measurements of the aortic outflow velocity-time integral (VTI) with pulsed-wave Doppler. The VV interval was consecutively changed by 20 msec (ranging from LV preceding 40 msec to RV
preceding 40 msec) and the corresponding VTI values were recorded for each VV interval. The optimal VV interval was designated as the VV setting with the highest VTI value that reflects the highest cardiac output. The final ECG obtained after optimization was used to calculate the CRT-induced QRS duration to be included in the study data.
2.3 Electrocardiograms
Baseline 12-lead ECG recordings closest to the device implan-tation were obtained from patient or hospital records. QRS intervals were manually calculated and double-checked with the computer output (QRS1). According to the previously
well-defined LBBB criteria [8], QRS morphologies were re-corded as either LBBB or non-LBBB. Biventricular paced ECGs obtained after device optimization were used for calcu-lating paced QRS width (QRS2). Based on the difference in
paced and baseline QRS intervals, the delta-QRS was calcu-lated (ΔQRS=QRS1−QRS2).
2.4 Echocardiographic protocol and the dyssynchrony analysis
All patients underwent a comprehensive echocardiographic examination including standard volumetric measurements, quantification of the mitral regurgitation, and strain measures using speckle-tracking echocardiography before device im-plantation. Once the clinical status was available, echocardio-graphic device optimization was performed for all patients in the following day of the procedure. Patients were re-evaluated with echocardiography in the first post-operative clinical visit (ranging from 3 to 15 days, mean 7 days, depending on the physician’s choice) for measurements of mechanical dyssynchrony. The dyssynchrony analysis was performed by an experienced echocardiographer who was blinded to the data of the pre-operative and post-operative QRS durations.
Patients were imaged in the left lateral decubitus position using a commercially available system (Vivid E9, General Electric, Milwaukee, USA), which used a 3.5 MHz transduc-er. LV volumes were calculated from the conventional apical two- and four-chamber views both in end-systole (LVESV) and end-diastole (LVEDV); once obtained, the results were used to calculate the left ventricular ejection fraction (LVEF) using the biplane Simpson’s technique [9]. Continuous-wave Doppler tracings from the left ventricular outflow tract (LVOT) were recorded as an index of the stroke volume.
The severity of mitral regurgitation (MR) was determined quantitatively as effective regurgitant orifice area (EROA) and RV by using the proximal isovelocity surface area (PISA) method as previously described [10].
Speckle-tracking echocardiography (STE) was used for strain and dyssynchrony parameters, and were analyzed offline using commercially available software (Echo Pac).
Apical two-, three- and four-chamber views were used for calculation of the global longitudinal strain. The endocardial borders were traced manually in an end-systole frame with the myocardium in the region of interest (ROI). The global longi-tudinal strain (GLS) was calculated as the average of peak strain values for each of the segments in all apical views. Similarly, short-axis views at the papillary muscle level were recorded as cine loops analyzed offline in order to obtain both circumferential and radial strain values (CS and RS, respec-tively), as is recommended [11].
Yu index was u sed as a mark er of mech anical dyssynchrony by using tissue synchronization imaging (TSI) with a commercially available software. Time-to-peak longi-tudinal systolic strain values in a 12-myocardial segment mod-el were measured. Standard deviations of these values were recorded as the Yu index; a level equal to or greater than 33 msec was defined as the cut-off value for significant me-chanical dyssynchrony [12,13]. Patients were divided into two groups based on their post-CRT dyssynchrony status: group A (Yu index<33 msec, n=41) and group B (Yu in-dex≥33 msec, n=39). The two groups were compared based on the clinical, demographic, electrocardiographic and echo-cardiographic features.
2.5 Reproducibility
Twenty randomly-selected patients were retrospectively re-evaluated to test the reproducibility of the main variables in the study. Intra-observer variability was found as 8 % for measurements of the Yu index, and found as 3 and 4 % for baseline and post-CRT QRS durations, respectively, all of which were within a clinically acceptable range.
2.6 Statistical analyses
Statistical analyses were conducted using SPSS (version 17.0, SPSS Inc., Chicago, IL, USA). Group data were presented as the mean±SD for continuous variables and percentages for categorical variables. Testing for normal distribution was checked using the Shapiro–Wilk test; a p value>0.05 was defined as normally distributed data. Continuous variables were compared using Student’s t test for independent samples that followed normal distribution, and by the Mann–Whitney U test for non-normally distributed samples based on mechan-ical dyssynchrony. Associations of the categormechan-ical variables between groups were tested using a Chi-square test. Statistical significance was defined as a p value <0.05 for all compari-sons. The Spearman correlation analysis was used to test the relationship between theΔQRS values and the dyssynchrony indices; the results are shown on a scattered-dot graph. A Chi-Square test was used to analyze the relationship between a prolonged or narrowed QRS interval with the dyssynchrony status; the results are shown with a clustered bar chart. A
receiver operating characteristic (ROC) analysis was per-formed to predict a cut-off level for post-CRT QRS prolonga-tion; the results were used to detect mechanical dyssynchrony. Results of the ROC analyses were expressed as an area under the curve (AOC), standard error (SD), p value and 95 % con-fidence interval (CI), along with a graphical demonstration. In order to define the independent predictors of having mechan-ical dyssynchrony after CRT, multiple logistic regression anal-yses were performed. The dependent variable was defined as having mechanical dyssynchrony (Yu index≥33 msec), while the independent variables were selected as the presence of baseline LBBB morphology, ΔQRS, baseline LVEF, paced QRS duration and the presence of LV lead location in the posterolateral coronary sinus vein. The results of the regres-sion analysis were expressed in terms of Omnibus Test of significance, Nagelkerke’s R squared, the Hosmer and Lemeshow test of significance, degrees of freedom (df), p value, odds ratio (OR) and 95 % confidence intervals (CI), along with a demonstrative table.
3 Results
The study population had a mean age of 63.4±12.4 (37 % female, 58 % non-ischaemic aetiology) and mean LVEF of 29.4±8.5 %. The residual mechanical dyssynchrony index after CRT was calculated as a mean Yu index of 38.5 ± 18.8 msec for the overall population. There were 39 patients (49 %, mean Yu index: 22.8±6.3 msec) in group A (without significant dyssynchrony) and 41 patients (51 %, 54.9 ± 12.2 msec) in group B (with significant dyssynchrony). Over-all, 21 patients (26 %) needed echocardiographic device opti-mization [9 patients (22 %) in group A and 12 patients (30 %) in group B] after the CRT procedure. The mean post-optimization QRS durations (QRS2) were not statistically
dif-ferent compared to the post-implantation QRS durations both in the overall population and in separate analyses of group A and group B (paired samples t-test, all p values >0.05).
Patients in both groups were found to have statistically similar characteristics in terms of age, gender, functional class, aetiology, co-morbidities and medication use, along with baseline ECG (LBBB morphology and QRS1duration) and
echocardiographic indices (all p values >0.05), as shown in Table1. Group B patients with post-CRT dyssynchrony had significantly longer (paced) QRS2durations (182.5±16.2 vs.
165.4±22.5 msec, p=0.03) and were less likely to have LV leads located in the posterolateral vein (53 % vs 85 %, p= 0.002) when compared to patients in group A.
Mechanical dyssynchrony (Yu index) was found to have a mild but statistically significant correlation withΔQRS values (Spearman’s rho = −0.341, p = 0.002), indicating that prolonged QRS intervals were associated with higher levels of dyssynchrony.’ (Fig.1). Patients with a narrowed QRS
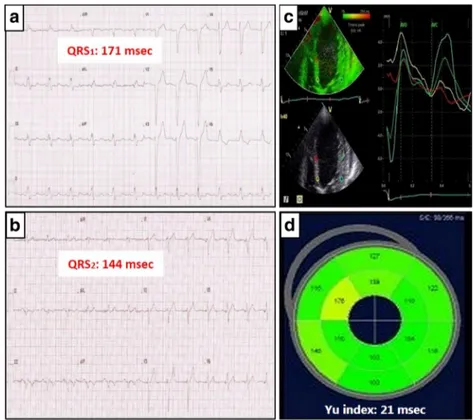
were less likely to have mechanical dyssynchrony, while a prolonged QRS was found to be associated with mechanical dyssynchrony following CRT (Pearson’s Chi-square=15.611, df=1, p=0.00008), as shown in Fig.2. In order to reflect the impact of CRT-induced QRS change on mechanical dyssynchrony following device implantation, two cases from the study population were selected as examples; these cases included patients who had either a wider or narrower
post-CRT QRS interval than the baseline. Figures3and4 demon-strate the two cases with their respective electrocardiograms, which show the QRS1and QRS2durations along with the
dyssynchrony indices for the given subject in each situation. A ROC analysis revealed that the CRT-induced QRS change was predictive of ongoing mechanical dyssynchrony following resynchronization therapy. A cut-off level of 10 msec for QRS prolongation was found to predict residual Table 1 Comparison of the
clinical, demographic, electrocardiographic and echocardiographic features of the study population according to the dyssynchrony status following cardiac resynchronization therapy
Overall Dyssynchrony (−) Dyssynchrony (+) p value
(N=80) (N=41) (N=39) Age (years) 63.4+12.5 63.4+12.2 63.4+12.8 0.98 Gender (male, %) 37 41 33 0.45 BSA (/m2) 1.8+0.2 1.8+0.2 1.8+0.2 0.69 BMI (kg/m2) 27.5+5.0 27.4+4.6 27.5+5.4 0.91 Aetiology (ischaemic, %) 41 41 40 0.92 NYHA Class 2.7+0.8 2.6+0.7 2.6+0.8 0.61 Hypertension (%) 71 66 77 0.27 Diabetes (%) 29 37 21 0.11 Hyperlipidemia (%) 47 46 49 0.83 Atrial fibrillation (%) 31 32 31 0.92 LBBB morphology (%) 85 90 79.5 0.17 Yu index (msec) 38.5+18.8 22.8+6.3 54.9+12.2 0.001 LV lead (PL vein, %) 70 85 53 0.002 QRS1(msec) 159+25 160.2+29.4 157.4+19.8 0.62 QRS2(msec) 174+26 165.4+22.5 182.5+16.2 0.03 Hb (g/dL) 12.3+1.6 12.8+1.3 11.9+1.9 0.42 Cr (mg/dL) 1.1+0.4 1.1+0.5 1.0+0.3 0.71 Medication use (%) Beta blocker 94 95 92 0.61 ACE-I/ARB 95 90 98 0.21 Spironolactone 76 71 82 0.23 Furosemide 88 85 90 0.12 Digoxine 43 49 36 0.24 Nitrate 23 27 18 0.34 Amiodarone 34 24 44 0.07 Warfarin 43 39 46 0.52 LVESV (mL) 145+62 147+73 143+50 0.78 LVEDV (mL) 200+71 197+80 204+60 0.63 LVEF (%) 29.4+8.5 27.8+9.6 31.1+6.8 0.07 EROA (cm2) 0.20+0.16 0.22+0.19 0.17+0.10 0.21 RV (mL) 28.1+20.8 31.0+25 24.8+13.3 0.20 GLS −8.4+6.2 −9.04+7.97 −7.73+3.40 0.34 RS 16.2+11.0 16.11+12.22 16.19+9.8 0.97 CS −6.9+3.3 −6.94+3.29 −6.87+3.30 0.92
BSA body surface area, BMI body mass index, NYHA New York Heart Association, LBBB left bundle branch block, LV left ventricular, PL posterolateral, QRS1baseline QRS interval before CRT, QRS2paced QRS interval
after CRT, Hb haemoglobin, Cr creatinine, ACE-I angiotensin-converting enzyme inhibitor, ARB angiotensin receptor blocker, LVESV left ventricular end-systolic volume, LVEDV left ventricular end-diastolic volume, LVEF left ventricular ejection fraction, EROA effective regurgitant orifice area, RV regurgitant volume, GLS global longitudinal strain, RS radial strain, CS circumferential strain
mechanical dyssynchrony with a sensitivity of 80 % and spec-ificity of 62 % (AOC=0.665, 95 % CI=0.546-0.784, and p value=0.011).
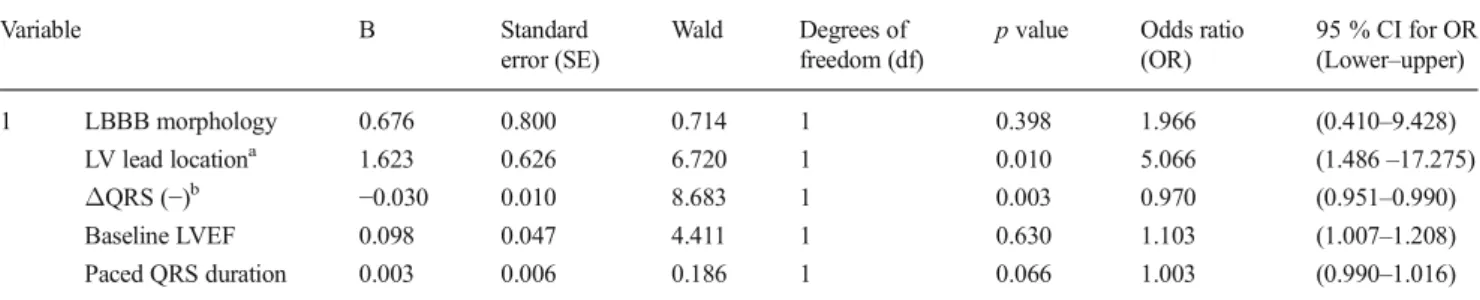
In order to define the independent predictors of post-CRT residual mechanical dyssynchrony, a multiple logistic regres-sion analysis by the enter method was performed. Among the
five independent variables in the model, statistically signifi-cant predictors of post-CRT mechanical dyssynchrony were (1) a negativeΔQRS indicating QRS prolongation after CRT (p value=0.003, df=1, OR=0.970, 95 % CI 0.951–0.990) and (2) the presence of the LV lead located in the posterolateral coronary sinus vein (p value=0.010, df=1, OR=5.066, 95 % Fig. 1 Graphical demonstration
of the negative correlation between the change in QRS duration in milliseconds and the mechanical dyssynchrony by means of Yu index after cardiac resynchronization therapy
Fig. 2 Association of QRS prolongation (ΔQRS-) or QRS narrowing (ΔQRS+) with dyssynchrony status (Yu index≥ 33 msec defined as significant mechanical dyssynchrony) after CRT
CI 1.486–17.275). Detailed information regarding the coeffi-cients and tests scores of the regression model is shown in Table2.
4 Discussion
In the current study, CRT-induced change in the QRS interval was found to be significantly associated with the presence of
mechanical dyssynchrony early after device implantation. Along with the posterolateral localization of the LV lead, pro-longation of the QRS emerged as a significant predictor of LV mechanical dyssynchrony in patients receiving cardiac resynchronization therapy. Moreover, 10 msec of QRS pro-longation was the appropriate cut-off level for the prediction of ongoing mechanical dyssynchrony after CRT.
We achieved similar results compared with previous stud-ies regarding the impact of the post-implantation QRS interval Fig. 3 Selected case from the
study population for demonstration of having a narrowed QRS induced by CRT (a) baseline ECG with a QRS duration of 171 milliseconds, (b) paced ECG with a QRS duration of 144 msec (ΔQRS=27 msec), (c) Septo-lateral time to peak systolic velocity curves early after CRT by Tissue synchronization imaging (TSI). Note that both basal and mid myocardial segments have been nicely synchronized in terms of septo-lateral delay. d The bull’s eye map demonstrating the colour-coded segmental time-to-peak systolic velocities and the overall dyssynchrony index derived from their standard deviations (Yu index=21 msec)
Fig. 4 Patient having a CRT-induced QRS prolongation. a Baseline QRS interval is 177 milliseconds. b Paced QRS interval is 214 milliseconds. (ΔQRS=−37 msec). c Post-implantation TSI demonstration of the marked segmental time delays of the peak systolic velocities from the opposing myocardial walls as shown with the arrows. d Marked differences in the 12-segment model TSI-derived time delays as shown in colour-coded bull’s eye map. Yu index was calculated as 64 msec reflecting significant mechanical dyssynchrony early after CRT
on clinical outcomes of CRT recipients [14, 15]. A wider paced QRS duration compared to the baseline value was shown to predict persistent LV mechanical dyssynchrony which was designated as the echocardiographic outcome var-iable of the study. Unlike the conventional preoperative use of echocardiographic dyssynchrony analysis to identify patients eligible for CRT [16], a unique feature of our study was the assessment of residual LV mechanical dyssynchrony after biventricular device implantation; additionally, we addressed the predictors of this consequence.
4.1 QRS duration in heart failure
QRS duration as a surrogate of electrical dyssynchrony has been established as an essential criterion for selecting heart failure patients eligible for resynchronization therapy, regard-less of the aetiology and functional status. Moreover, several studies evaluating the effect of chronic right ventricular pacing (RVP) revealed that prolongation of the QRS interval is asso-ciated with a poor outcome, including deterioration of LV function and the development of congestive heart failure (even in patients with previously normal ejection fractions) [17,18]. In the PREDICT-HF trial, the investigators reported that QRS prolongation induced by RVP had a detrimental effect on long-term cardiac function and heart failure events [18].
4.2 CRT-induced QRS change
Several studies involving the association of paced QRS dura-tion and the clinical outcome of patients receiving cardiac resynchronization therapy revealed similar results. In a study from Lecoq and colleagues evaluating CRT response in 139 CRT patients, QRS shortening was the single reliable predic-tor for a positive CRT response [14]. Accordingly, in the substudy of the PROSPECT trial, paced QRS width along with the CRT-induced QRS change were predictors of a
positive outcome after CRT based on improved clinical com-posite scores and reductions in LVESV [15]. From a nonsponder point of view, failure of CRT to induce reversed re-modelling in this population is possibly due to the electrical dyssynchrony caused by QRS prolongation, which triggers dyssynchronous ventricular contractions, subsequently lead-ing to haemodynamic deterioration. As a main objective of our study, we tested this hypothesis and found a significant correlation with CRT-induced QRS change and mechanical dyssynchrony following device implantation.
An interesting result of our study was not the baseline or paced QRS duration, but that the QRS change was found to be a significant predictor of residual mechanical dyssynchrony early after CRT. The practical interpreta-tions of our results are that the CRT-induced QRS dura-tion should be closely monitored during both implantadura-tion and optimization of biventricular devices. The LV lead location must be located at the site that results in the shortest possible QRS duration. Similarly, device pro-gramming (especially the AV and VV intervals) should be targeted to minimize the paced QRS duration com-pared to the pre-optimization QRS duration. As shown in the present study, a shorter QRS duration than the baseline value would result in a significant decrease in LV mechanical dyssynchrony that possibly leads to im-provement in systolic functions and clinical outcomes af-ter CRT. However, our results fail to provide evidence to conclude whether the paced QRS duration or the appro-priate LV lead location is the main determinant of out-come to be recommended for CRT implanters. Further studies that explore this topic in more detail are therefore needed. Besides, the cut-off level of a 10-msec QRS pro-longation compared to baseline width has been derived from a relatively small sample size that requires further investigation to establish a clinical implication for early determination of CRT nonresponders.
Table 2 Multiple logistic regression model* for analyzing the independent predictors of having mechanical dyssynchrony (Yu index≥33 msec) following cardiac resynchronization therapy
Variable B Standard
error (SE)
Wald Degrees of freedom (df)
p value Odds ratio (OR) 95 % CI for OR (Lower–upper) 1 LBBB morphology 0.676 0.800 0.714 1 0.398 1.966 (0.410–9.428) LV lead locationa 1.623 0.626 6.720 1 0.010 5.066 (1.486–17.275) ΔQRS (−)b −0.030 0.010 8.683 1 0.003 0.970 (0.951–0.990) Baseline LVEF 0.098 0.047 4.411 1 0.630 1.103 (1.007–1.208) Paced QRS duration 0.003 0.006 0.186 1 0.066 1.003 (0.990–1.016) CI confidence interval, LBBB left bundle branch block, LV left ventricular, LVEF left ventricular ejection fraction
*Omnibus Test p value<0.05, Nagelskerke R2=0.360, Hosmer–Lemeshow Test p value=0.604
a
Presence of LV lead located in the posterolateral coronary sinus vein
bΔQRS (−) is defined as having a prolonged QRS duration following CRT based on the difference between the baseline and the paced QRS intervals
4.3 Echocardiographic indices of mechanical dyssynchrony
It is worth mentioning that the major trials that studied echo-cardiographic dyssynchrony failed to reveal any gold standard technique for quantification of MD [15]. The purpose of using the Yu index in the current study was mainly due to the sim-plicity and reproducibility of the method which depends on easy measurements leading to prompt computer-based results. Despite the negative results of the PROSPECT trial that failed to establish the association of Yu index with CRT response, we believe that the Yu index might still be applicable in a differently designed study. For instance, the Yu index in the current study was used post-operatively to correlate with ΔQRS values unlike the common use of MD as a pre-operative variable. Moreover, due to the lack of a widely-accepted method for measuring MD, any echocardiographic index is prone to criticisms in CRT studies. Besides, it should be kept in mind that we could have achieved different results if we had chosen another marker of MD in our study.
4.4 LV lead localization
The importance of LV lead location on clinical outcomes of patients receiving CRT has been proven in previous studies [19,20]. Derval et al. found that QRS change induced by LV pacing correlated with acute haemodynamic response and that LV pacing location was a primary determinant of paced QRS duration [19]. In another study that retrospectively evaluated the impact of lead position on long-term outcomes of 362 patients, the authors reported that apical or para-septal LV lead localization was associated with poor outcomes [20]. In our study, we achieved comparable results showing that the pres-ence of the LV lead in the posterolateral vein was an indepen-dent predictor of mechanical dyssynchrony early after CRT.
Post-CRT assessments of persistent mechanical (Yu in-dex≥33 msec) and persistent electrical (paced QRS dura-tion>native QRS duration) dyssynchrony are affected by mul-tiple factors such as the loading conditions, heart rate, pre-existing degree of LV remodelling, RV and LV lead locations and device settings (AV and VV delays). The relative impact of these variables on the post-operative analysis needs to be equalized in further studies in order to establish a clinical follow-up algorithm to improve outcomes after CRT.
4.5 Study limitations
Our study has several limitations. First, we have a relatively small sample size and the study population in our cohort is derived from a single tertiary care centre; therefore, it may not be representative of patients treated in other centres in terms of baseline characteristics. Second, although performed by an expert echocardiographer, the comprehensive dyssynchrony
analysis was done by a single operator, a limitation which led to criticisms involving inter-observer variability. Third, although there’s no gold standard index for measuring dyssynchrony, the Yu index that we used in our study is prone to criticisms since the use of a different index for measuring MD might have possibly altered the results of the study. Fi-nally, the main limitation of the study is the lack of follow-up data regarding the impact of ongoing mechanical dyssynchrony in relation to CRT-induced QRS change on clinical outcome variables, such as CRT response, heart failure events and cohort-specific mortality.
5 Conclusion
To our knowledge, the present study is among the first to evaluate mechanical dyssynchrony early after device implan-tation and to examine clinical predictors of this consequence. We found a significant correlation of CRT-induced QRS change with residual mechanical dyssynchrony following CRT. Along with the presence of an LV lead located in the posterolateral vein, QRS prolongation emerged as an indepen-dent predictor of mechanical dyssynchrony early after device implantation. A cut-off level of 10 milliseconds for QRS pro-longation was found to have significant predictive value for residual mechanical dyssynchrony following CRT.
Acknowledgements The authors are grateful to the entire staff and the nurses of the cardiology department of Medipol University for their ex-cellent support and cooperation during the entire study.
Compliance with ethical standards The local ethics committee ap-proved the study protocol, and a written informed consent was obtained from all participants.
References
1. Cleland, J. G., Freemantle, N., Erdmann, E., Gras, D., Kappenberger, L., Tavazzi, L., & Daubert, J. C. (2012). Long-term mortality with cardiac resynchronization therapy in the Cardiac Resynchronization-Heart Failure (CARE-HF) trial. Eur J Heart Fail, 14(6), 628–634.
2. Goldenberg, I., Hall, W. J., Beck, C. A., Moss, A. J., Barsheshet, A., McNitt, S., Polonsky, S., et al. (2011). Reduction of the risk of recurring heart failure events with cardiac resynchronization thera-py: MADIT-CRT (Multicenter Automatic Defibrillator Implantation Trial With Cardiac Resynchronization Therapy). J Am Coll Cardiol, 58(7), 729–737.
3. Brignole, M., Auricchio, A., Baron-Esquivias, G., Bordachar, P., Boriani, G., Breithardt, O. A., Cleland, J., et al. (2013). ESC guide-lines on cardiac pacing and cardiac resynchronization therapy: the task force on cardiac pacing and resynchronization therapy of the European Society of Cardiology (ESC). Europace, 15(8), 1070– 1118.
4. Khairy, P., Van Hare, G. F., Balaji, S., Berul, C. I., Cecchin, F., Cohen, M. I., Daniels, J. C., et al. (2014). PACES/HRS expert consensus statement on the recognition and management of
arrhythmias in adult congenital heart disease: developed in partner-ship between the Pediatric and Congenital Electrophysiology Society (PACES) and the Heart Rhythm Society (HRS). Endorsed by the governing bodies of PACES, HRS, the American College of Cardiology (ACC), the American Heart Association (AHA), the European Heart Rhythm Association (EHRA), the Canadian Heart Rhythm Society (CHRS), and the International Society for Adult Congenital Heart Disease (ISACHD). Can J Cardiol, 30(10), e1–e63.
5. Birnie, D. H., & Tang, A. S. (2006). The problem of non-response to cardiac resynchronization therapy. Curr Opin Cardiol, 21(1), 20– 26.
6. Dong, Y. X., Powell, B. D., Asirvatham, S. J., Friedman, P. A., Rea, R. F., Webster, T. L., Brooke, K. L., et al. (2012). Left ventricular lead position for cardiac resynchronization: a comprehensive cinegraphic, echocardiographic, clinical, and survival analysis. Europace, 14(8), 1139–1147.
7. Chen, L., Tiongson, J. E., Obrzut, S., McDaniel, M. B., Chang, H. Y., Patel, J., Friedman, P. J., et al. (2012). Standard chest radiograph predicts left ventricular lead location in chronic resynchronization therapy patients more accurately than intraoperative fluoroscopy. J Interv Card Electrophysiol, 35(3), 323–330.
8. Strauss, D. G., Selvester, R. H., & Wagner, G. S. (2011). Defining left bundle branch block in the era of cardiac resynchronization therapy. Am J Cardiol, 107(6), 927–934.
9. Lang, R. M., Badano, L. P., Mor-Avi, V., Afilalo, J., Armstrong, A., Ernande, L., Flachskampf, F. A., et al. (2015). Recommendations for cardiac chamber quantification by echocardiography in adults: an update from the American Society of Echocardiography and the European Association of Cardiovascular Imaging. Eur Heart J Cardiovasc Imaging, 16(3), 233–270.
10. Lancellotti, P., Tribouilloy, C., Hagendorff, A., Popescu, B. A., Edvardsen, T., Pierard, L. A., Badano, L., et al. (2013). Recommendations for the echocardiographic assessment of native valvular regurgitation: an executive summary from the European Association of Cardiovascular Imaging. Eur Heart J Cardiovasc Imaging, 14(7), 611–644.
11. Voigt, J. U., Pedrizzetti, G., Lysyansky, P., Marwick, T. H., Houle, H., Baumann, R., Pedri, S., et al. (2015). Definitions for a common standard for 2D speckle tracking echocardiography: consensus doc-ument of the EACVI/ASE/Industry Task Force to standardize de-formation imaging. J Am Soc Echocardiogr, 28(2), 183–193. 12. Gorcsan, J., 3rd, Abraham, T., Agler, D. A., Bax, J. J., Derumeaux,
G., Grimm, R. A., Martin, R., et al. (2008). Echocardiography for cardiac resynchronization therapy: recommendations for
performance and reporting—a report from the American Society of Echocardiography Dyssynchrony Writing Group endorsed by the Heart Rhythm Society. J Am Soc Echocardiogr, 21(3), 191–213. 13. Yu, C. M., Zhang, Q., Fung, J. W. H., Chan, H. C., Chan, Y. S., Yip, G. W., Kong, S. L., et al. (2005). A novel tool to assess systolic asynchrony and identify responders of cardiac resynchronization therapy by tissue synchronization imaging. J Am Coll Cardiol, 45, 677–684.
14. Lecoq, G., Leclercq, C., Leray, E., Crocq, C., Alonso, C., de Place, C., Mabo, P., et al. (2005). Clinical and electrocardiographic pre-dictors of a positive response to cardiac resynchronization therapy in advanced heart failure. Eur Heart J, 26(11), 1094–1100. 15. Hsing, J. M., Selzman, K. A., Leclercq, C., Pires, L. A.,
McLaughlin, M. G., McRae, S. E., Peterson, B. J., et al. (2011). Paced left ventricular QRS width and ECG parameters predict out-comes after cardiac resynchronization therapy: PROSPECT-ECG substudy. Circ Arrhythm Electrophysiol, 4(6), 851–857.
16. Risum, N., Williams, E. S., Khouri, M. G., Jackson, K. P., Olsen, N. T., Jons, C., Storm, K. S., et al. (2013). Mechanical dyssynchrony evaluated by tissue Doppler cross-correlation analysis is associated with long-term survival in patients after cardiac resynchronization therapy. Eur Heart J, 34(1), 48–56.
17. Miyoshi, F., Kobayashi, Y., Itou, H., Onuki, T., Matsuyama, T., Watanabe, N., Liu, C., et al. (2005). Prolonged paced QRS duration as a predictor for congestive heart failure in patients with right ventricular apical pacing. Pacing Clin Electrophysiol, 28(11), 1182–1188.
18. Chen, S., Yin, Y., Lan, X., Liu, Z., Ling, Z., Su, L., Kiuchi, M. G., et al. (2013). PREDICT-heart failure study international group. Paced QRS duration as a predictor for clinical heart failure events during right ventricular apical pacing in patients with idiopathic complete atrioventricular block: results from an observational cohort study (PREDICT-HF). Eur J Heart Fail, 15(3), 352–359.
19. Derval, N., Bordachar, P., Lim, H. S., Sacher, F., Ploux, S., Laborderie, J., Steendijk, P., et al. (2014). Impact of pacing site on QRS duration and its relationship to hemodynamic response in cardiac resynchronization therapy for congestive heart failure. J Cardiovasc Electrophysiol, 25(9), 1012–1020.
20. Jastrzebski, M., Wilinski, J., Fijorek, K., Sondej, T., & Czarnecka, D. (2013). Mortality and morbidity in cardiac resynchronization patients: impact of lead position, paced left ventricular QRS mor-phology and other characteristics on long-term outcome. Europace, 15(2), 258–265.