Electronic Excited States of the CP29 Antenna
Complex of Green Plants: A Model Based on
Exciton Calculations
ERKUT ˙I. ˙I ¸SERI1, DUYGU ALBAYRAK2and DEMET GÜLEN1 1Physics Department, Middle East Technical University, 06531 Ankara, Turkey
2Bilkent University, Department of Computer Technology and Information Systems, East Campus,
06533 Bilkent-Ankara, Turkey, E-mail: [email protected]
Abstract. We have suggested a model for the electronic excited states of the minor plant antenna, CP29, by incorporating a considerable part of the current information offered by structure determ-ination, site-directed mutagenesis, and spectroscopy in the modeling. We have assumed that the electronic excited states of the complex have been decided by the chlorophyll-chlorophyll (Chl) and Chl-protein interactions and have modeled the Coulombic interaction between a pair of Chls in the point-dipole approximation and the Chl-protein interactions are treated as empirical fit parameters. We have suggested the Qydipole moment orientations and the site energies for all the chlorophylls in the complex through a simultaneous simulation of the absorption and linear dichroism spectra. The assignments proposed have been discussed to yield a satisfactory reproduction of all prominent features of the absorption, linear and circular dichroism spectra as well as the key spectral and temporal characteristics of the energy transfer processes among the chlorophylls. The orientations and the spectral assignments obtained by relatively simple exciton calculations have been necessary to provide a good point of departure for more detailed treatments of structure-function relationship in CP29. Moreover, it has been discussed that the CP29 model suggested can guide the studies for a better understanding of the structure-function relationship in the major plant antenna, LHCII. Key words: CP29, electronic excited states, energy transfer, LHCII, light-harvesting complexes, photosynthesis
1. Introduction
Photosynthetic organisms contain light-harvesting pigment-protein complexes (LHCs) that absorb light and transfer energy efficiently to other pigment-protein complexes called as reaction centers (RCs) to initiate the photochemistry of pho-tosynthesis. The key to the efficiency of light-harvesting processes is the ultrafast energy transfers in the LHCs (antenna) of green plants, bacteria and algae which are mainly governed by pigment-pigment and pigment-protein interactions. For a com-prehensive understanding of the ultrafast energy transfer processes, it is essential to relate the structure of these complexes to both the steady-state and time-resolved spectra [1].
In photosystem II (PSII) of green plants light-harvesting is performed by a collection of LHC buried in the photosynthetic membrane (thylakoids). The LHC associated with PSII consists of two parts: an outer antenna binding chlorophyll a (Chl a), Chl b, and carotenoids and an inner antenna binding Chl a and carotenoids. The proteins forming the outer antenna are usually called as Lhcb proteins. The major Lhcb protein, LHCII, binds almost 65% of the PSII chlorophyll (accounting for 50% of the total Chls in the thylakoids) and the minor Lhcb proteins that have been identified so far (usually called as CP24, CP26 and CP29) bind altogether 15% of the PSII chlorophyll [2].
Currently, LHCII is the only Lhcb protein, which is structurally resolved. A large part of the structure of the LHCII is modeled to a resolution of 3.4 Å by Kühlbrandt and co-workers [3]. All the Lhcb proteins are highly homologous and are therefore believed to share a protein folding similar to that of the LHCII shown in Figure 1. The LHCII pigments identified per monomeric subunit of the current model are 12 Chl molecules surrounding 2 central carotenoid (Car) molecules. The minor Lhcb proteins bind a fewer number of Chls with varying pigment-binding stochiometries. The Lhcb protein of interest in this work, CP29, binds 2 Chl b, 6 Chl a and 2 Car molecules [4] (see Figure 1).
The Lhcb proteins are spectroscopically complex objects, exhibiting consider-ably heterogeneous spectra in the spectral range of 630–685 nm (Qy band) and
many spectral forms are commonly observed in all the Lhcb proteins in this ab-sorption region. The number of spectral bands decomposed in the Qyband almost
matches the number of bound Chls in all these complexes [5]. Owing to a fewer number of Chls, the minor antennae show a lower degree of complexity and their spectral data may prove more easily interpretable than that of LHCII. In particular, the spectral bands resolved in the Chl a absorption region of the LHCII and CP29 proteins are essentially identical, suggesting an identical organization for the Chls a common to both complexes [5–7]. In addition, the energy equilibration in CP29 is observed to be very similar to part of the energy equilibration in LHCII both in terms of temporal and spectral characteristics [8]. It is therefore expected that a better interpretation of the light-harvesting process in the major plant antenna, LHCII, can be obtained by understanding a less complicated Lhcb protein like CP29.
The LHCII model available does not allow a direct access to several parameters that are essential for understanding of the light-harvesting function. At the current resolution, the Chls could only be modeled as naked tetrapyrrole rings. Therefore the model does not provide any distinction between the Chls a and the Chls b (the identity problem) and no distinction could be made between the molecular x and y axes of the Chl molecules (the orientation problem). However, most of the chlorophyll-binding sites in LHCII are disclosed by the structural model which led to the identification of the probable binding sites in highly homologous CP29 [4, 9]. Site-directed mutagenesis of chlorophyll binding residues has allowed construction of several mutant proteins lacking individual Chl molecules. Biochemical and
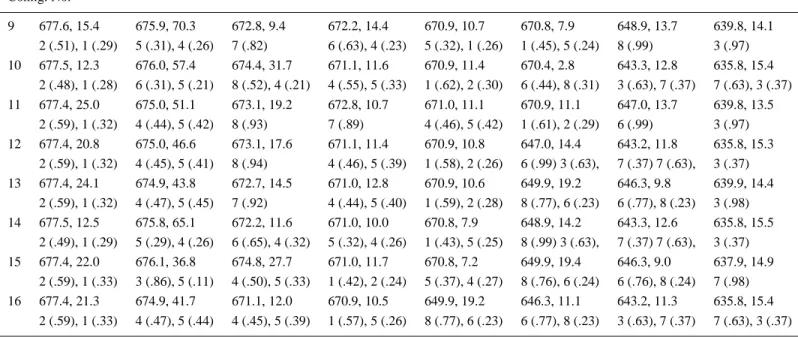
spec-Figure 1. Model structure of CP29. a.) The protein folding of LHCII consists of three
mem-brane-spanning α-helices and a fourth helix running parallel to the presumed position of the photosynthetic membrane (double lines). The helices A and B are related to each other by a two-fold symmetry axis running perpendicular to the membrane. The eight Chl molecules surround the two central carotenoids (L1 and L2). The relevant part of the LHCII structural data resolved by Kühlbrandt et al. [3] is shown. b.) The protein is stripped off for clarity. A1, A2, A4, and A5 are pure Chl a sites and the Chl a binding affinities of the mixed sites are, 70% (A3), 60%(B5), 40%(B6), and 30%(B3). The diagonal lines on the tetrapyrrole rings of the Chls indicate approximately the orientations of the Qytransition dipoles determined in this study.
tral characterization of these mutants have recently been used for determination of the Chl identities in CP29 [4].
Determination of the Chl identities is a major step in correlating the spectra with the structure. But the orientation problem is still an open question to be answered. In this work we have looked for an answer to this question through modeling of the steady-state spectra using exciton calculations [10].
Recently, an electronic excited state structure for CP29 (orientation of the trans-ition dipole moments and transtrans-ition energies) has been suggested [11] by assuming a structure common with the relevant part of the LHCII. This model of Simonetto and co-workers has been based on the interpretation that the pigment-protein inter-actions determine the spectral heterogeneity in the absorption region from 630 nm to 685 nm and, the effects of pigment-pigment interactions have been totally neg-lected. In this interpretation differential spectroscopy of mutant proteins missing single Chls have been used for the reconstruction of the absorption (ABS) and the linear dichroism (LD) spectra of CP29 under the observation that difference spectra can be fitted to one major and one or two minor gaussians. However, a good fit to the LD spectra could only be obtained under a rather unconventional choice of the monomeric Chl transition dipole moment directions.
In this work we have re-addressed the orientation problem. We have provided simultaneous simulations that can explain the key features of the low temperature ABS and LD spectra in the same spectral range. We have discussed that a spectral decomposition including both pigment-pigment and pigment-protein interactions, yet yielding a spectral decomposition very similar to that reported by Simonetto et al. [11] is feasible with a more conventional definition of the individual transition dipole moment directions. We have also discussed that the model we have proposed can explain the observed features of the equilibration of energy in CP29 [8] on the basis of our preliminary energy transfer rate estimates.
2. Materials and Methods
Coulomb interaction between pairs of Chls is assumed to be the relevant physical mechanism and the interactions between the Chls are treated in the point dipole ap-proximation. Recent ab initio calculations of the Coulombic interactions between the transition densities of several Bchl pairs in the LH2 complex of Rhodopseudo-monas acidophila suggest that the Qy-Qyinteractions of Bchl molecules are well
described in the point-dipole approximation for pairwise separations greater than 15 Å and deviations are significant (25–30%) at separations around 9–9.5 Å [12]. Calculations with the same degree of accuracy are not available for determining the extent of deviations from the point-dipole approximation in CP29 as well as in several other photosynthetic antenna in which the major interactions originate from several Chl/Bchl pairs with pairwise separations of 12–15 Å. The recent models using the point-dipole approximation have yielded very satisfactory results in simultaneous simulations of several steady-state spectra of one such complex,
the FMO complex [13–15]. The success in FMO has usually been taken as a good support for using point-dipoles as a good approximation down to distances 11– 12 Å. In CP29 a word of caution is necessary for two of the pairs b3-a3 and b5-a5 (both around 9 Å) for which the interaction strengths are most likely to be subjected deviations, all the other Chl pairs are separated by distances greater than 12 Å.
Pigment-protein interactions, as in [11], are only described through a wavelength shift the Chl site energies (the transition energies in the absence of pigment-pigment interactions) without taking into account the effect of dynamical disorder in the protein environment (i.e., each excitonic transition is dressed with a symmetric gaussian).
The ABS and LD spectra are simulated using the exciton formalism [10] as we have described elsewhere in detail [16] and summarized in Appendix.
The information needed to simulate the experimental spectra at the level of approximation we have used involves:
• Identities of the Chl molecules as a and b • Distances between the Chl molecules
• Effective absorption strengths of the Chls in the protein environment
corres-ponding to the Q band (0–0) transitions
• Orientations of the individual Qy(Qx) transition dipole moments for the Chl a
and Chl b molecules
• Site energies of the Chl molecules
The relevant part of the LHCII structural model as suggested earlier [11] via ho-mology between the two complexes is used for the organization of the Chls in CP29 (see Figure 1). The atomic coordinates of the tetrapyrrole rings of the LHCII complex are used to determine the distances between the Chls and the orientation of the planes in which the transition dipole moments are assumed to lie.
The Chl identities determined recently by Bassi et al. [4] are used: A1, A2, A4, and A5 are pure Chl a sites and the Chl a binding affinities of the four mixed sites are respectively, 70% (A3), 60% (B5), 30% (B3) and 40% (B6). Note that we use A/B for the binding sites and indicate the identities with a/b.
The effective absorption strength corresponding to the Qy (0–0) transitions of
each Chl a is taken as µa2 = 21 debye2, following the recent determination by
Kleima [17] for monomeric Chl a in the protein environment of Amphidinium carterae and that of each Chl b is taken as µb2= 14 debye2by keeping µb2/a2= 0.7
[18]. This effective value is estimated to correspond to a refractive index of 1.6± 0.1 [17].
The Qxtransitions and assumed to carry 10% of the Qyabsorption strength and
have been assigned around 620 nm (for Chl a) and around 595 nm (for Chl b). We have determined the remaining parameters (the site energies in the Qyand
the orientations) through a simultaneous simulation the key features of the ABS and LD spectra. The nomenclature of Gülen et al. [19] for the two possible directions of the molecular y axis, i.e., 0 (along the NA-NCaxis) and 1 (along the NB-NDaxis)
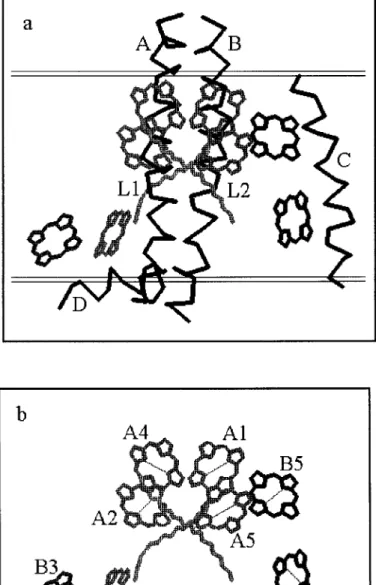
Table I. Probability of occurrence of the 16 configura-tions in CP29 Configuration A3 B5 B3 B6 Probability 1 a a a a 0.0504 2 a a a b 0.0756 3 a a b a 0.1176 4 a b a a 0.0336 5 b a a a 0.0216 6 a a b b 0.1764 7 a b b a 0.0784 8 a b a b 0.0504 9 b a a b 0.0324 10 b a b a 0.0504 11 b b a a 0.0144 12 b b b a 0.0336 13 b b a b 0.0216 14 b a b b 0.0756 15 a b b b 0.1176 16 b b b b 0.0504
is maintained. Here the subscripts refer to the convention of the file provided by Dr Werner Kühlbrandt.
The Qy transition dipole moment direction of each Chl is shown in Figure 1
and the direction for each Chl is selected as described below (see Results and Discussion). The selection is basically guided by the previous results of Gülen et al. [19, 20] and Gradinaru et al. [21]. The Qxtransitions are taken perpendicular
to the Qy transitions. The sense of the rotations, ‘+/–’, defined as the c.w./c.c.w.
rotations of the vectors from NDto NBand from NAto NC, where the nitrogens are
arranged in c.c.w. from NAto ND.
Each excitonic transition in the Qyregion is dressed by a symmetric Gaussian
of bandwidth 9 nm and the bandwidths for the Qxtransitions are taken to be 28 nm.
The LD analysis is performed in the same convention as Simonetto et al. [11]. The pseudo 2-fold internal symmetry axis of the LHCII monomers is defined as a normal to ‘the molecular plane’ which is the plane in which the membrane presum-ably lies (see Figure 1). It has been assumed that the macroscopic alignment axis of the LD measurements is parallel to the molecular plane and LD = Ak-A⊥where Ak(⊥)is the absorption parallel (perpendicular) to the macroscopic alignment axis. Due to presence of 4 mixed sites there are 16 different configurations for the 8 Chls of the CP29 complex. These configurations are listed in Table I with their respective probabilities of occurrence determined by the Chl a/b binding affinities
of the mixed sites. The spectra of CP29 are simulated as weighted sums of the gaussian dressed spectrum of each of the 16 configurations given in Table I.
The experimental spectra are taken from [9].
3. Results and Discussion
The need for including the Chl-Chl interactions is already apparent in view of the emerging picture of the energy transfer pattern in the CP29 complex. Gradinaru and co-workers [21] have followed the suggestion of Prof Robert S. Knox, and voiced that the energy transfer in CP29 has a compartmental nature: energy equilibrates very fast (on subpico- to pico-second scale) in the compartments consisting of a few Chl molecules, and a less rapid equilibration (≥10 ps) takes place between the compartments. Recent results of Simonetto et al. [11] also support this description. The details of the energy transfer pathways are somewhat different in these two models: in part due to different assumptions on the extent of Chl-Chl interactions and, in part owing to the differences in the assignments of the molecular y-axis for some of the Chls, and also in the orientations of the Qytransition dipole moment
directions in the tetrapyrrole plane. What is clear however is that there are several pairs/groups of Chls (e.g., a1-a2, a4-a5-(B5) and A3-B3) which always equilib-rate on subpico- to a few pico-seconds scale. In fact, the LHCII model forces the rapid energy transfers between three of the pairs (i.e., a1-a2, a4-a5 and A3-B3) irrespective of their identities and orientations.
The strong pairwise interactions causing ultrafast transfers from Chls b to Chls a are not expected to cause delocalization of excitation due to large energetic sep-aration. However, delocalization effects especially for the pairs/groups of Chls a (or Chls b) belonging to the same compartment are to be expected, and this has set the point of departure of this work.
We have assigned the direction of the Qytransition dipole moment of each Chl a
molecule along the molecular y axis (i.e., 0 or 1). We have based this assignment on a number of studies in which either monomeric or a pair of very weakly interacting Chl a molecules in a very well-defined geometry are analyzed. In all these analyses the Qy transition dipole moment of Chl a is found to be almost (within about 5◦)
along the molecular y axis. In the recent model of Simonetto et al. [11], it has been concluded that unless there is a 20◦(30◦) deviation from the molecular y axis for the Chl a (b) transition dipole moments, the LD of CP29 could not be explained in the absence of Chl-Chl interactions.
In angle-resolved fluorescence depolarization experiments on monomeric Chl a oriented in anhydrous nitrocellulose films the Qytransition dipole moment for
absorption is found to be along the molecular y axis [22].
In the monomeric unit of PCP (Peridinin-Chlorophyll a-Protein) from Amphidi-nium carterae [23] – a very weakly interacting pair of Chl a molecules (interaction strength less than 10 cm−1) in a very well-defined geometry (2 Å resolution) – the
Chl a dipole moment corresponding to the Qyabsorption is concluded to lie very
close to the molecular y axis [17].
A similar result has also been reported in a dimer of zinc chlorophyllide, em-bedded in the heme pockets of hemoglobin [24].
In addition, it has recently been possible to explain the key features of sev-eral steady-state spectra of the FMO protein by assigning the Qytransition dipole
direction of each of the seven Bchl a molecules along the molecular y axis [13–15]. We are not aware of any study of the kind in which a very well defined geometry is used for the determination of the transition dipole moment direction of the Chl b molecule. In the literature there are reports suggesting a 10◦difference between the Qydipole moment directions of the Chl a and the Chl b molecules [e.g., 25 and
the references therein].
We have based the selection of the Qytransition dipole moment orientations (0
or 1) of each of the Chls on the assignments reported in a series of work by Gülen et al. [19, 20] and by Gradinaru et al. [21]. In [19–21] the most probable orientations have been suggested upon performing a quite extensive search in a large space of possible combinations of individual dipole moment orientations. The combinations that can comply with the global features of both the steady-state and the temporal and spectral behavior of kinetic observations have been selected using a set of relatively mild restrictions. The LD features in both Chl a and Chl b regions and the CD characteristics in Chl a region were evaluated in the presence of Chl-Chl interactions and the excited state kinetics were evaluated on the basis of Förster transfer.
Although the search procedure mentioned above has been applied to CP29 prior to the full Chl identification, the model used has been very similar to the one suggested in the recent work of Bassi and co-workers [4]. The same eight Chl molecules identified by Bassi and co-workers have been included and the organiz-ation of these eight molecules were assumed to be identical to those binding to the same sites in LHCII. The identities of the molecules in the Chl a-binding core (a1, a2, a4, and a5) have been assigned correctly. The mixed identities of the sites A3, B3, B5, and B6 have not been taken into account. However, those binding mostly Chl b (B3 and B6) have been assigned as Chls b and similarly, those binding mostly Chl a (A3 and B5) have been assigned to be Chls a.
The selection process that is described above has used very mild selection cri-teria and therefore, did not yield an unambiguous solution for the orientations. It did however provide a very restricted set of possible orientational configurations. The most probable orientational assignments (judged mostly by the polarized ab-sorption characteristics) have been: a1(0), a2(0 or 1), A3 (a, 0 or 1), a4(0), a5(0), B5(a, 0 or 1), B3(b, 1) and B6(b, 0). We note that none of these orientational assignments contradicts the ‘individual’ LD signs of the Chls suggested in [11] by using the difference spectra of CP29 versus mutants.
We have tested the orientations discussed above to determine the best solution, that can give a simultaneous explanation of all the prominent features of ABS and
LD spectra. Although we have not provided any simultaneous fits, we shall discuss that this solution can also explain the key features of the CD spectrum and the excitation transfer kinetics.
Under the assumption that the mixed sites bind Chls a and b in the same geo-metry, the best solution we have found has the following parameters. The orienta-tional assignments: a1(0), a2(1), A3(0), a4(0), a5(0), B5(1), B3(1), and B6(0), and the site energies (in nm): a1(673), a2(675), A3(a, 675), a4(673), a5(673), B5(a, 673), B3(a, 672), B6(a, 673), A3(b, 640.5), B3(b, 638.5), B5(b, 647), and B6(b, 649).
To have a satisfactory fit of the Chl b region LD properties, it has been necessary to allow some deviation from the molecular y axis for the dipole moments of the Chl b molecules. For A3(b), B5(b), and B6(b) rotations of around 5–10 ◦ was sufficient for fine-tuning the LD signal in the 645–660 nm range. The blue-most LD signal (peaking around 635 nm) is mainly associated with the B3(b) molecule, which has a very large positive monomeric LD. In the absence of Chl a Qx band,
which should also contribute to the blue tail of the Chl b absorption [18], the in-tensity of this signal could still match the experimental one if we allow a rotation of around 15–20◦for the dipole moment of B3(b) in the molecular plane. The overall effect of the Chl a Qx transitions is a predominantly negative LD signal, which
helps to reduce the intensity of the 635 nm LD. When Qxtransitions are included,
it was sufficient to rotate the dipole moment of B3 by 5–10◦in the molecular plane. (Further details of the rotations are explained in the caption of Figure 2).
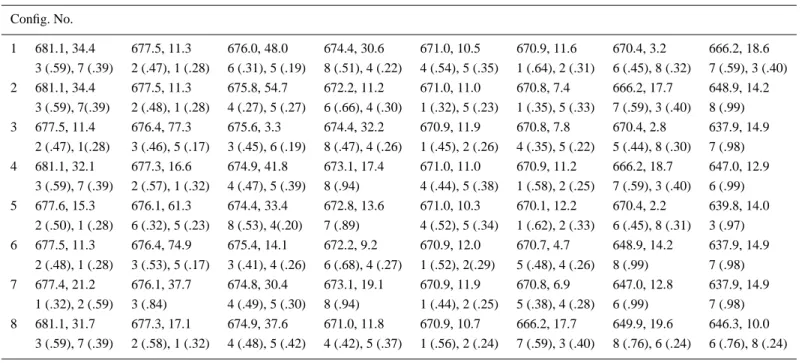
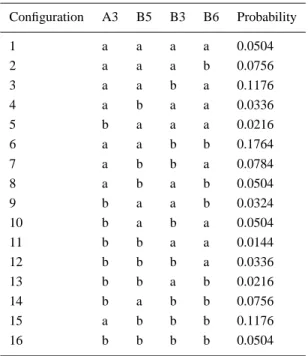
In Figure 2 the ABS and LD spectra of CP29 are presented for the solution given above and compared with the experimental data [9]. Each spectrum given in Figure 2 is constructed as a weighted sum of the gaussian dressed spectrum corresponding to the 16 configurations as listed in Table II with the weights given in Table I. In Table II we detail the resolution given in Figure 2 by giving the transition wavelengths, the absorption intensities, and the delocalization characteristics for each of the 16 configurations making up the spectra.
Each of the 16 configurations have a different excited state structure, the average over all configurations yield a composition which can be approximated by eight independent gaussian subbands with midpoints and widths very similar to those presented in the model by Simonetto et al. [11].
The electronic excited state structure in the Chl a region (≈665–685 nm) is mainly governed by the interactions within four pairs: a1-a2 (≈–65 cm−1), a4-a5 (≈45 cm−1), B5(a)-B6(a) (≈45 cm−1), B3(a)-A3(a) (≈–155 cm−1) and by the weaker cross-couplings between the first three of these dimers. Much stronger pair-wise coupling of B3(a)-A3(a) prevents any mixing with the others, when unpaired these molecules also mix with the others.
Each Chl a in these dimers contributes both to the blue and the red spectral bands. The blue-most (≈666 nm) and the red-most (≈681 nm) bands originate from the A3(a)-B3(a) interaction. A3(a)-B3(a) pair is a dimer with about equal contributions of both molecules to the delocalized states. a1 and a2 molecules
Figure 2. Experimental ABS, LD, and CD spectra versus simulations. Experimental data
(ABS at 130 K, LD and CD at 77 K) are reproduced from [9] (solid lines). Open dots are the simulation results including the Qxbands. Dashed line in LD is the simulation with only the Qytransitions. In all the simulations the dipole moment directions of all the Chl a molecules are taken along the molecular y-axis, while those of the Chl b molecules deviate by: –10◦(A3, and B5), by +10◦(B3), by –5◦(B6) from the y-axis in the tetrapyrrole plane of each molecule.
ITED ST A TES OF THE C P2 9 C OM PLEX 331
Table II. Transition energies, absorption strengths and delocalization characteristics of the 16 configurations. For each configuration, the first row gives the transition energy (nm), absorption strength (debye2). The molecules contributing to each transition and their percentage contribution, in parenthesis, are given in the second row. The molecules are labeled as: 1 (a1), 2(a2), 3 (A3), 4 (a4), 5 (a5), 6 (B5), 7 (B3) and 8 (B6). The data for the Qyband transitions are shown, but in the calculations the Chl a and b Qxbands are also included.
Config. No. 1 681.1, 34.4 677.5, 11.3 676.0, 48.0 674.4, 30.6 671.0, 10.5 670.9, 11.6 670.4, 3.2 666.2, 18.6 3 (.59), 7 (.39) 2 (.47), 1 (.28) 6 (.31), 5 (.19) 8 (.51), 4 (.22) 4 (.54), 5 (.35) 1 (.64), 2 (.31) 6 (.45), 8 (.32) 7 (.59), 3 (.40) 2 681.1, 34.4 677.5, 11.3 675.8, 54.7 672.2, 11.2 671.0, 11.0 670.8, 7.4 666.2, 17.7 648.9, 14.2 3 (.59), 7(.39) 2 (.48), 1 (.28) 4 (.27), 5 (.27) 6 (.66), 4 (.30) 1 (.32), 5 (.23) 1 (.35), 5 (.33) 7 (.59), 3 (.40) 8 (.99) 3 677.5, 11.4 676.4, 77.3 675.6, 3.3 674.4, 32.2 670.9, 11.9 670.8, 7.8 670.4, 2.8 637.9, 14.9 2 (.47), 1(.28) 3 (.46), 5 (.17) 3 (.45), 6 (.19) 8 (.47), 4 (.26) 1 (.45), 2 (.26) 4 (.35), 5 (.22) 5 (.44), 8 (.30) 7 (.98) 4 681.1, 32.1 677.3, 16.6 674.9, 41.8 673.1, 17.4 671.0, 11.0 670.9, 11.2 666.2, 18.7 647.0, 12.9 3 (.59), 7 (.39) 2 (.57), 1 (.32) 4 (.47), 5 (.39) 8 (.94) 4 (.44), 5 (.38) 1 (.58), 2 (.25) 7 (.59), 3 (.40) 6 (.99) 5 677.6, 15.3 676.1, 61.3 674.4, 33.4 672.8, 13.6 671.0, 10.3 670.1, 12.2 670.4, 2.2 639.8, 14.0 2 (.50), 1 (.28) 6 (.32), 5 (.23) 8 (.53), 4(.20) 7 (.89) 4 (.52), 5 (.34) 1 (.62), 2 (.33) 6 (.45), 8 (.31) 3 (.97) 6 677.5, 11.3 676.4, 74.9 675.4, 14.1 672.2, 9.2 670.9, 12.0 670.7, 4.7 648.9, 14.2 637.9, 14.9 2 (.48), 1 (.28) 3 (.53), 5 (.17) 3 (.41), 4 (.26) 6 (.68), 4 (.27) 1 (.52), 2(.29) 5 (.48), 4 (.26) 8 (.99) 7 (.98) 7 677.4, 21.2 676.1, 37.7 674.8, 30.4 673.1, 19.1 670.9, 11.9 670.8, 6.9 647.0, 12.8 637.9, 14.9 1 (.32), 2 (.59) 3 (.84) 4 (.49), 5 (.30) 8 (.94) 1 (.44), 2 (.25) 5 (.38), 4 (.28) 6 (.99) 7 (.98) 8 681.1, 31.7 677.3, 17.1 674.9, 37.6 671.0, 11.8 670.9, 10.7 666.2, 17.7 649.9, 19.6 646.3, 10.0 3 (.59), 7 (.39) 2 (.58), 1 (.32) 4 (.48), 5 (.42) 4 (.42), 5 (.37) 1 (.56), 2 (.24) 7 (.59), 3 (.40) 8 (.76), 6 (.24) 6 (.76), 8 (.24)
ERKUT
˙I.
˙I¸SERI
ET
AL.
Table II. Continued Config. No. 9 677.6, 15.4 675.9, 70.3 672.8, 9.4 672.2, 14.4 670.9, 10.7 670.8, 7.9 648.9, 13.7 639.8, 14.1 2 (.51), 1 (.29) 5 (.31), 4 (.26) 7 (.82) 6 (.63), 4 (.23) 5 (.32), 1 (.26) 1 (.45), 5 (.24) 8 (.99) 3 (.97) 10 677.5, 12.3 676.0, 57.4 674.4, 31.7 671.1, 11.6 670.9, 11.4 670.4, 2.8 643.3, 12.8 635.8, 15.4 2 (.48), 1 (.28) 6 (.31), 5 (.21) 8 (.52), 4 (.21) 4 (.55), 5 (.33) 1 (.62), 2 (.30) 6 (.44), 8 (.31) 3 (.63), 7 (.37) 7 (.63), 3 (.37) 11 677.4, 25.0 675.0, 51.1 673.1, 19.2 672.8, 10.7 671.0, 11.1 670.9, 11.1 647.0, 13.7 639.8, 13.5 2 (.59), 1 (.32) 4 (.44), 5 (.42) 8 (.93) 7 (.89) 4 (.46), 5 (.42) 1 (.61), 2 (.29) 6 (.99) 3 (.97) 12 677.4, 20.8 675.0, 46.6 673.1, 17.6 671.1, 11.4 670.9, 10.8 647.0, 14.4 643.2, 11.8 635.8, 15.3 2 (.59), 1 (.32) 4 (.45), 5 (.41) 8 (.94) 4 (.46), 5 (.39) 1 (.58), 2 (.26) 6 (.99) 3 (.63), 7 (.37) 7 (.63), 3 (.37) 13 677.4, 24.1 674.9, 43.8 672.7, 14.5 671.0, 12.8 670.9, 10.6 649.9, 19.2 646.3, 9.8 639.9, 14.4 2 (.59), 1 (.32) 4 (.47), 5 (.45) 7 (.92) 4 (.44), 5 (.40) 1 (.59), 2 (.28) 8 (.77), 6 (.23) 6 (.77), 8 (.23) 3 (.98) 14 677.5, 12.5 675.8, 65.1 672.2, 11.6 671.0, 10.0 670.8, 7.9 648.9, 14.2 643.3, 12.6 635.8, 15.5 2 (.49), 1 (.29) 5 (.29), 4 (.26) 6 (.65), 4 (.32) 5 (.32), 4 (.26) 1 (.43), 5 (.25) 8 (.99) 3 (.63), 7 (.37) 7 (.63), 3 (.37) 15 677.4, 22.0 676.1, 36.8 674.8, 27.7 671.0, 11.7 670.8, 7.2 649.9, 19.4 646.3, 9.0 637.9, 14.9 2 (.59), 1 (.33) 3 (.86), 5 (.11) 4 (.50), 5 (.33) 1 (.42), 2 (.24) 5 (.37), 4 (.27) 8 (.76), 6 (.24) 6 (.76), 8 (.24) 7 (.98) 16 677.4, 21.3 674.9, 41.7 671.1, 12.0 670.9, 10.5 649.9, 19.2 646.3, 11.1 643.2, 11.3 635.8, 15.4 2 (.59), 1 (.33) 4 (.47), 5 (.44) 4 (.45), 5 (.39) 1 (.57), 5 (.26) 8 (.77), 6 (.23) 6 (.77), 8 (.23) 3 (.63), 7 (.37) 7 (.63), 3 (.37)
predominantly contribute to the spectra around 670 nm and around 677 nm. a4, a5, B5(a), and B6(a) are associated with the bands in the middle of the absorption (≈670–675 nm). a1-a2 character is also observed in the middle bands due to cross-coupling with the a4-a5 pair. Similary, a4-a5 character is also observed in the bands towards blue. When unpaired the mixed sites A3 and B3 mainly merge into the bands in the middle as well.
The blue side of the Chl b absorption (630–640 nm) is mainly attributed to the B3 and A3 molecules. B3(b)-A3(b) interaction (≈–110 cm−1) delocalizes the two transitions around (638.5 and 640.5 nm) into two transitions around 636 nm and 643 nm. The red side of the Chl b absorption is shaped by the B5 (647 nm) and B6 (649 nm) molecules. B5-B6 interaction is weaker than the B3-A3 interaction (≈30 cm−1), but it is strong enough to cause about≥ 25% delocalization.
Large energetic separation between Chls b and Chls a precludes any significant delocalization between these two spectral regions. Less than 2% mixing is observed in the most strongly coupled a-b pair, A3-B3.
We would like to note that we have only considered the 0–0 transitions and have not made any attempt to introduce vibrational transitions. The absorption offset observed in the Qyregion between 630 and 665 nm, which is also present in
the ABS construction of Simonetto et al. [11], is mostly related to the neglect of vibrational tails in the Chl a absorption forms.
We have not attempted to fit the CD spectrum, but our model also produces the overall character of the CD spectra in the Chl a absorption region: the strongly biphasic signal, negative on the red and positive on the blue (see Figure 2). The non-conservative negative CD signal in the Chl b absorption region remains to be understood. It is a fact that in CP29, LHCII, CP26, and also in reconstituted com-plexes with varying Chl a/b ratios (see e.g., [26]) there exists a non-conservative negative CD signal in the Chl b band. Existence of a negative, non-excitonic CD signal in the Chl b region may offer a resolution.
Experimental measurements of transient absorption on CP29 upon selective excitation of the two Chl b subbands around 640 nm and 650 nm [8], have in-dicated that the blue Chls b (absorbing around 640 nm) transfer excitation to the red Chls a with a time constant of 350 ± 100 fs, while the red Chls b (absorbing around 650 nm) transfer on a picosecond time scale (2.2± 0.5 ps) towards a Chl a pool more on the blue. Furthermore, both fast (280 ± 50 fs) and slow (10–15 ps) equilibration among the Chl a molecules have been observed. Moreover, it has been concluded that these rates as well as their associated spectra are very similar to those observed in LHCII [27, 28, 21].
In view of the results we have presented above, it is necessary to evaluate the energy equilibration by taking the delocalized nature of the excited states into account and therefore it is not entirely proper to talk in terms of the Förster rates between the pairs of molecules. However to guide the rest of the discussion on energy equilibration and to connect with the previous models [21, 11] we have provided a block diagram in Figure 3. We have estimated the rate constants of this
Figure 3. Block diagram representation of the excitation pathways in CP29.
diagram using the Förster mechanism as we have described elsewhere in detail [29, 21].
It was already evidenced by the previous studies that excitation delocalization will be important within the compartments. Our calculations show that the delocal-ization of excitation is not only limited to the compartments: there is considerable delocalization over the entire core region Chls a (a1, a2, a4, a5) and cross-couplings with the core also induce delocalization over the entire Chl a pool. Excitation equi-libration among all these delocalized levels in the Chl a spectral region needs to be detailed. It is however clear that all the Chls a will be fully equilibrated since there are several bi-directional pathways between ‘the compartments’ (see Figure 3). We avoid any strong comments on the time scales and on the spectral properties of the equilibration among the Chl a states on the basis of Förster rates given in Figure 3. Nevertheless, the time scales of the intra- (≈500 fs–1 ps) and inter-compartmental (≈5–10 ps) transfers correlate well with the experimentally observed equilibration rates.
B3(b)-A3(b) pair is highly delocalized and equilibrates very rapidly, but trans-fer of excitation from this Chl b pair to the Chl a pool is rather slow (≈15 ps). The monomeric B3(b) and A3(b) molecules are responsible for the ultrafast de-excitation of the 640 nm band. Both molecules transfer to a pool of weakly coupled Chls a in which the leading contribution will be due to B3(b) to A3(a) and A3(b) to B3(a) transfers at a rate (≈250–300 fs) consistent with the experiments. In the model of Simonetto et al. these two molecules are also responsible for the 640 nm
band. But the orientational assignments of these two molecules are such that they become not only weakly coupled to the Chl a pool but also to each other. Therefore this assignment is unlikely to explain the ultrafast energy transfer out of the 640 nm band.
Our model attributes the slow de-excitation (2.2± 0.5 ps) of the 650 nm band to B5(b) and B6(b) molecules. These molecules equilibrate with each other in several picoseconds and as a pair transfer to the Chl a pool via B5(b)-a5 coupling (≈5 ps), which is also the route of de-excitation for the monomeric B5(b). B6(b) transfers to the Chl a pool through its interaction with B5(a) (≈3.5 ps). B5 (b) transfers to a pool of strongly coupled Chls a, while B6 (b) transfers to a weakly coupled Chl a pool. In the model proposed by Simonetto et al. B5(b) also de-excites through its coupling to the a4-a5 pair. However their orientational assignment (a4 = 1 and a5 = 1, B5 = 1) yields an extremely fast (<100 fs) de-excitation. Such a combin-ation of orientcombin-ations would also be inconsistent with the steady-state spectra, as it would yield an interaction strength greater than the spectral splitting observed experimentally. In [11] slow de-excitation of the 650 nm band is attributed only to the B6(b) molecule, which de-excitates through its interactions with the group of Chls a4-a5-B5.
Very recently the site-directed mutagenesis approach has also been applied to LHCII [7] and it has been reported that most of the sites present in both CP29 and LHCII induce similar absorption characteristics. Combination of this information with extensive spectroscopic data on LHCII and with the orientational assignments that we have proposed in this study can provide a better understanding of the structure-function relationship in both the LHCII and the other minor LHCs of the PSII.
Acknowledgements
We would like to thank to Dr Werner Kühlbrandt for providing the data file con-taining the atomic coordinates of the LHCII model. We also would like to thank to Dr Roberto Bassi for sharing some of the results from his laboratory with us prior to publication.
Appendix
In this appendix we describe the formalism of one-exciton states, used in the absorption (ABS), linear dichroism (LD) and circular dichroism (CD) spectra sim-ulations. One can refer to [10] for an extensive account of this formalism.
A system of N molecules whose positions and orientations are ‘fixed’ in space (e.g., Chl molecules embedded in a protein environment) is considered. Suppose each molecule has a dipole allowed transition (a singly excited state) in the spectral region of interest. The dipolar interaction between a pair of molecules in the point dipole approximation is given by
Vij = 5.04
µi · µj · κij
rij
(cm−1) (A.1)
where µi is the effective magnitude of the dipole moment vector of the ithmolecule (in debye); rij is the center-to-center distance from the ith molecule to the jth
mo-lecule (in nm); and κijdepends on the orientations of the transition dipole moments and is given by
κij = [ ˆµi· ˆµj − 3( ˆµi · ˆrij)(ˆµj· ˆrij)]
Here is ˆµi the unit vector in the direction of the transition dipole moment of the ith molecule. ˆrij is the unit vector along the line connecting the ‘centers’ of these
molecules.
In the basis of N singly excited states (|i>, i = 1, . . ., N), the matrix elements of the one-exciton Hamiltonian of the system (H) are;
< i | H | j >= Vij, i6= j
< i| H | j >= Ei◦, i= j
where Ei◦’s are the individual transition energies (site energies) of each molecule and Vij is defined in equation (A.1).
One uses the term ‘one-exciton’ state for the delocalized eigenstates of H, i.e., each one exciton state is a linear combination of the N singly excited states.
Let Z and 3 be respectively, the eigenvector and the eigenvalue matrices of H satisfying the eigenvalue problem H.Z=3.Z. Each column of Z (an NxN matrix) corresponds to the eigenstate vector of an one-exciton state and the off-diagonal elements of 3 (an NxN matrix) are zero and the diagonal elements are the energies of the one-exciton states.
The ABS, the LD and the CD strengths corresponding to the Kthone-exciton
transition are defined as;
ABSK =| EµK |2= N
P
i,j=1
µiµj(ˆµi· ˆµj)ZiKZj K (A.2)
LDK = ABSK,k− ABSK,⊥ (A.3)
where, ABSK,k=| EµK,k|2= N P i,j=1 µiµj(ˆµi· ˆd)( ˆµj · ˆd)ZiKZj K ABSK,⊥=| EµK,⊥|2= 1 2 N P i,j=1 µiµj[ ˆµi · ˆµj − ( ˆµi· ˆd)( ˆµj · ˆd)]ZiKZj K
and CDK = RK = 1.7 × 10⁻⁹ N P i,j=1 νiµiµjrij[ˆrij · ( ˆµj × ˆµi)]ZiKZj K (A.4) In (A.2) – (A.4), EµK is the dipole moment (in debye) of the Kth one-exciton transition, ZiK is the ithelement of the eigenstate vector corresponding to the Kth one-exciton transition; νi is the site energy (in cm−1) of the ithmolecule; ˆd is the
unit vector in the direction of a macroscopically defined alignment axis; CD is the difference in the absorption of the system exposed alternately to left and right circularly polarized light and is expressed in rotational strength RK(in debye-Bohr magnetons) of the Kthexcitonic transition, and EµK,kand EµK,⊥are the components
EµKrespectively parallel and perpendicular to ˆd.
The spectrum obtained by plotting the one-exciton energies (the diagonal ele-ments of 3) versus the intensities found using the equation (A.2), (or (A.3) and (A.4)) is termed as the ‘stick spectrum’. Each line of the stick spectrum is then dressed by a symmetric gaussian given below by keeping the integrated area under each gaussian equal to the intensity of the transition. The intensity of the dressed one-exciton transition is given by;
εK(λ)= εP Kexp[−4ln2(λ − λK)2/WλK2 ] (A.5) where,
εpK = [(lnn)/π]1/2(2IkλK)/WλK
in which IK corresponds to one of the ABSK, LDK or CDK depending on which spectrum is to be contructed, λKis the peak position (in nm) of the Kthone-exciton
transition and WλK is the full-width at half-maximum (band width) of the Kth one-exciton transition. The simulated spectrum is the sum of the gaussian dressed spectra.
References
1. van Grondelle, R., Dekker, J.P., Gillbro, T. and Sundström, V.: Energy Transfer in Photosyn-thesis, Biochim. Biophys. Acta 1187 (1994), 1–65.
2. Boekema, E.J., van Roon, H., Calkoen, F., Bassi, R. and Dekker, J.P.: Multiple Types of As-sociation of Photosystem II and Its Largest Light-Harvesting Antenna in Partially Solubilized Photosystem II Membranes, Biochemistry 38 (1999), 2233–2239.
3. Kühlbrandt, W., Wang, D.N. and Fujiyoshi, Y.: Atomic Model of Plant Light-Harvesting Complex by Electron Crystallography, Nature 367 (1994), 614–621.
4. Bassi, R., Croce, R., Cugini, D. and Sandona, D.: Mutational Analysis of a Higher Plant An-tenna Protein Provides Identification of Chromophores Bound into Multiple Sites, Proc. Natl.
Acad. Sci. USA 96 (1999), 10056–10061.
5. Zucchelli, G., Dainese, P., Jennings, R.C., Breton, J., Garlaschi, F.M. and Bassi, R.: Gaussian Decomposition of Absorption and Linear Dichroism Spectra of Outer Antenna Complexes of Photosystem II, Biochemistry 33 (1994), 8982–8990.
6. Giuffra, E., Zucchelli, G., Sandona, D., Croce, R., Cugini, D., Garlaschi, F.M., Bassi, R. and Jennings, R.C.: Analysis of Some Optical Properties of Native and Reconstituted Photosystem II Antenna Complex, CP29: Pigment Binding Sites Can be Occupied by Chlorophyll a Or Chlorophyll b and Determine Spectral Forms, Biochemistry 36 (1997), 12984–12993. 7. Remelli, R., Varotto, C., Sandona, D., Croce, R. and Bassi, R., Chlorophyll Binding to
Monomeric Light-Harvesting Complex’, J. Biol. Chem. 274 (1999), 33510–33521.
8. Gradinaru, C.C., Pascal, A., van Mourik, F., Robert, B., Horton, P., van Grondelle, R. and van Amerongen, H.: Ultrafast Evolution of The Excited States in the Minor Chlorophyll a/b Complex CP29 from Green Plants Studied by Energy-Selective Pump-Probe Spectroscopy,
Biochemistry 37 (1999), 1143–1149.
9. Pascal, A., Gradinaru, C.C., Wacker, U., Peterman, E., Calkoen, F., Irrgang, K-D., Horton, P., Renger, G., van Grondelle, R., Robert, B. and van Amerongen, H.: Spectroscopic Characteriza-tion of the Spinach Lhcb4 Protein (CP29), A Minor Light-Harvesting Complex of Photosystem II, Eur. J. Biochem. 262 (1999), 817–823.
10. Pearlstein, R.M.: Theoretical Interpretation of the Antenna Spectra, In H. Scheer (ed.), The
Chlorophylls, CRC Press, Boca Raton, 1991, pp. 1047–1078.
11. Simonetto, R., Crimi, M., Sandona, D., Croce, R., Cinque, G., Breton, J. and Bassi, R.: Orienta-tion of Chlorophyll TransiOrienta-tion Dipole Moments in the Higher-Plant Light-Harvesting Complex CP29, Biochemistry 38 (1999), 12974–12983.
12. Krueger, B.P., Scholes, G.D. and Fleming, G.R.: Calculation of Couplings and Energy-Transfer Pathways Between the Pigments of LH2 by the ab initio Transition Density Cube Method, J.
Phys. Chem. B 102 (1998), 5378–5386.
13. Louwe, R.J.W., Vrieze, J., Hoff, A.J. and Aartsma, T.J.: Towards an Integral Interpretation of the Optical Steady-State Spectra of the FMO-Complex of Prosthecochloris aestuarii. II. Exciton Simulations, J. Phys. Chem. B 101 (1997), 11280–11287.
14. ˙I¸seri, E.˙I. and Gülen, D.: Electronic Excited States Excitation Transfer Kinetics in the FMO Protein Complex of the Photosynthetic Bacterium Prosthecochloris aestuarii at Low Temperatures, Eur. Biophys. J. 28 (1999), 243–253.
15. Vulto, S.I.E., de Baat, M.A., Louwe, R.J.W., Permentier, H.P., Neef T., Miller, M., van Amer-ongen, H. and Aartsma, T.J.: Exciton Simulations of Optical Spectra of the FMO Complex from the Green Sulphur Bacterium Chlorobium tepidum at 6 K, J. Phys. Chem. B. 102 (1998), 9577–9582.
16. ˙I¸seri, E.˙I.: Electronic Excited States and Excitation Transfer Kinetics in the FMO Protein
Com-plex of the Photosynthetic Bacterium Prosthecochloris aestuarii at Low Temperatures, M.S.
Thesis, METU, Ankara, Turkey (1998).
17. Kleima, F.J., Hofmann, E., Gobets, B., van Stokkum, I.H., van Grondelle, R., Diederichs, K. and van Amerongen, H.: Förster Excitation Energy Transfer in Peridinin-Chlorophyll-a-Protein, Biophys. J. 78 (2000), 344–353.
18. Sauer, K., Schmidt, J.R.L. and Schultz, A.J.: Dimerization of Chlorophyll a, Chlorophyll b and Bacteriochlorophyll in Solution, J. Am. Chem. Soc. 88 (1966), 2681–2688.
19. Gülen, D., van Grondelle, R. and van Amerongen, H.: Structural Information on Light-Harvesting Complex II as obtained from Exciton Calculations and Polarized Spectroscopy, In P. Mathis (ed.), Photosynthesis: From Light to Biosphere-Volume I, Kluwer, Dordrecht, 1995, pp. 335–338.
20. Gülen, D., van Grondelle, R. and van Amerongen, H.: Structural Information on the Light-Harvesting Complex II of Green Plants that can be Deciphered from Polarized Absorption Characteristics, J. Phys. Chem. B 101 (1997), 7256–7261.
21. Gradinaru, C.C., Özdemir, S., Gülen, D., van Stokkum, I.H.M., van Grondelle, R. and van Amerongen, H.: The Flow of Excitation Energy in LHCII Monomers: Implications for the Structural Model of the Major Plant Antenna, Biophys. J. 75 (1998), 3064–3077.
22. van Zandvoort, M.A.M.J., Wrobel, D., Lettinga, P., van Ginkel, G. and Levine Y.K.: The Ori-entation of the Transition Dipole Moments of Chlorophyll a and Pheophytin in Their Molecular Frame, Photochem. Photobiol. 62 (1995), 299–308.
23. Hofmann, E., Wrench, P., Sharples, F.D., Hiller, R.G., Welte, W. and Diederichs, K.: Structural Basis of Light-Harvesting by Carotenoids-Peridinin-Chlorophyll a-Protein from Amphidinium
carterae, Science 272 (1996), 1788–1791.
24. Moog, R.S., Kuki, A., Fayer, M.D. and Boxer, S.G.: Excitation Transport and Trapping in a Synthetic Chlorophyllide Substituted Hemoglobin: Orientation of the Chlorophyll S1 Transition Dipole, Biochemistry 23 (1984), 1564–1571.
25. Fragata, M., Norden, B. and Kurucsev, T.: Linear Dichroism (250–700 nm) of Chloro-phyll a and Pheophytin a Oriented in a Lamellar Phase of Glycerylmonooctaonate/ H2 O-Characterization of Electronic Transitions, Photochem. Photobiol. 47 (1988), 133–143. 26. Kleima, F.J., Hobe, S., Calkoen, F., Urbanus, M.L., Peterman E.J.G., van Grondelle, R.,
Paulsen, H. and van Amerongen, H.: Decreasing the Chlorophyll a/b Ratio in Reconstituted LHCII: Structural and Functional Consequences, Biochemistry 38 (1999), 6587–6596. 27. Visser, H.M., Kleima, F.J., van Stokkum, I.H.M., van Grondelle, R. and van Amerongen, H.:
Probing Many Energy-Transfer Processes in the Photosynthetic Light-Harvesting Complex II at 77 K Using Energy Selective Sub-Picosecond Transient Absorption Spectroscopy, Chem.
Phys. 210 (1996), 297–312. Erratum: Chem. Phys. 215 (1997), 299.
28. Connelly, J.P., Müller, M.G., Gatzen, G., Mullineaux, C.W., Ruban, A.V., Horton, P. and Holzwarth A.R.: Ultrafast Spectroscopy of Trimeric Light-Harvesting Complex II from Higher Plants’, J. Phys. Chem. B 101 (1997), 1902–1909.
29. Özdemir, S.: Identification of Several Energy Transfer Pathways in the Light-Harvesting
Com-plex II of Green Plants Using Current Structural and Spectroscopic Information, M.S. Thesis,
![Figure 2. Experimental ABS, LD, and CD spectra versus simulations. Experimental data (ABS at 130 K, LD and CD at 77 K) are reproduced from [9] (solid lines)](https://thumb-eu.123doks.com/thumbv2/9libnet/5687886.114795/10.892.299.669.138.866/figure-experimental-spectra-versus-simulations-experimental-reproduced-lines.webp)