A COMPARATIVE STUDY ON SPATIAL PERCEPTION IN REAL AND VIRTUAL OFFICE ENVIRONMENTS UNDER DIFFERENT
LIGHTING CONDITIONS
A Master’s Thesis
by
BÜŞRA KUŞ
Department of
Interior Architecture and Environmental Design İhsan Doğramacı Bilkent Üniversitesi
Ankara January, 2019 B Ü ŞR A K U Ş A C O MPA R A TIVE ST U D Y O N SP A TIAL PE R C EP TION I N R EA L A N D B ilke nt U nıve rsı ty 2 019 V IR TU A L O FF IC E E N V IR O N MEN TS U N D ER D IF FE R EN T L IG H TING C O N D ITION S
To my parents…
A COMPARATIVE STUDY ON SPATIAL PERCEPTION IN REAL AND VIRTUAL OFFICE ENVIRONMENTS UNDER DIFFERENT
LIGHTING CONDITIONS
The Graduate School of Economics and Social Sciences of
İhsan Doğramacı Bilkent University
by
BÜŞRA KUŞ
In Partial Fulfillment of the Requirements for the Degree of MASTER OF FINE ARTS
THE DEPARTMENT OF
INTERIOR ARCHITECTURE AND ENVIRONMENTAL DESIGN İHSAN DOĞRAMACI BILKENT UNIVERSITY
ANKARA January 20
ii
ABSTRACT
A COMPARATIVE STUDY ON SPATIAL PERCEPTION IN REAL AND VIRTUAL OFFICE ENVIRONMENTS UNDER DIFFERENT
LIGHTING CONDITIONS
Kuş, Büşra
MFA, Department of Interior Architecture and Environmental Design Supervisor: Assist. Prof. Dr. Semiha Yılmazer
January, 2019
The aim of study iş to conduct a comparison between real and virtual environments from the spatial point of view under different lighting conditions. In this study, visually same office environments were created in real environment (RE) as well as in virtual environments (VE) in order to be able to observe only the perception between the two environments. The
experiment was conducted in full-scale office environment and virtual environment by using Unity 3D program with participating of sixty people. These environments were appraised under 4000K (cool white light) and 6500K (daylight) lighting color temperatures. An office room in Bilkent University and Environmental Design building was used to carry out the
iii
experiments. The participants were asked to experience the environments firstly, later on they were as requested to answer the previously prepared questionnaire with semantic differential scale. As a result of this study one can say that the perceptions of both environments RE and VE were similar to some extend in more than half of the 12 adjective pairs under both color temperature. Adjectives such as usual-unusual, dynamic-static, spacious-confined and harmonious-discord demonstrated significant differences for both environments. Moreover, participants perceived real environment more spacious, usual, harmonious and less dynamic than virtual environment under both lighting conditions. Only the functional-nonfunctional and formal-informal adjective pairs behaved significantly different under 4000K and 6500K respectively. There were no significant effects of color temperatures in real and virtual environments.
Keywords: Color Temperature, Office Environment, Real Environment, Spatial Perception, Virtual Environment,
iv
ÖZET
FARKLI AYDINLATMA KOŞULLARINDA GERÇEK VE SANAL OFIS ORTAMININ MEKAN ALGISI ÜZERİNE KARŞILAŞTIRMALI BİR ÇALIŞMA
Kuş, Büşra
İç Mimarlık ve Çevre Tasarımı Yüksek Lisans Programı Tez Danışmanı: Dr. Öğr.Üyesi Semiha Yılmazer
Ocak, 2019
Bu çalışmanın amacı, gerçek ve sanal ofis ortamının insanlar üzerinde yarattığı algıyı farklı renk sıcaklıkları altında karşılaştırmalı olarak incelemektir. Bu araştırmada görsel olarak aynı gerçek ve sanal ortam, bireysel ofis ortamı üzerinden değerlendirilmiştir. Altmış katılımcıyla yapılan deney, tam ölçekli ofis düzeneği ile gerçek ortamda ve görsel olarak aynı düzeneğin Unity 3D programı kullanılarak üçüncü boyuta çıkarılmış haliyle sanal ortamda
gerçekleştirilmiştir. Bu iki ortam, 4000K (soğuk beyaz ışık) ve 6500K (günışığı) renk sıcaklıkları altında değerlendirilmiştir. Bilkent Üniversitesi İç Mimarlık ve Çevre Tasarımı Bölümü’ ndeki ofis odası, deney koşullarına uygun hale getirilerek kullanılmıştır. Gerçek ve sanal ofis ortamlarını tecrübe eden katılımcılara, mekan algısını değerlendirmek için anket çalışması yapılmıştır. Ankette, zıt kutuplu on iki sıfat çifti anlamsal farklandırma methodu ile katılımcılara sorulmuştur. Bu çalışmanın sonuçlarına göre; her iki renk sıcaklığı altında da
v
gerçek ve sanal ortamdaki algı, 12 sıfat çiftinin yarısından fazlası için benzerlik göstermiştir. Her iki renk sıcaklığında da anlamlı farklılık gösteren sıfat çiftleri şunlardır;
alışılmış-alışılmışın dışında, dinamik-statik, ferah-sıkışık ve uyumlu-uyumsuz. Ayrıca katılımcılar iki renk sıcaklığı içinde, gerçek ortamı daha ferah, uyumlu ve alışılmış, sanal ortamı ise daha dinamik olarak algılamışlardır. İki sıfat çiftine –fonksiyonel-fonksiyonel olmayan (4000K) ve resmi-resmi olmayan (6500K)- farklı renk sıcaklıklarının altında farklı reaksiyon
göstermişlerdir. Katılımcıların cevapları doğrultusunda, 4000K (soğuk beyaz ışık) ve 6500K (günışığı) mekan algısı üzerindeki etkisi bir değişken olarak kaydedilmemiştir.
vi
ACKNOWLEDGEMENT
The most appreciation belongs to my valuable advisor Asst. Prof. Dr. Semiha Yılmazer for all her motivator guidance, encouragement, contributions and patient in order to make my thesis better and stimulating.
I express my appreciations to my jury members, Asst. Prof. Dr. Çağrı İmamoğlu and Dr. Saadet Akbay Yenigül for their precious comments, wisely and helpful suggestions.
I would like to thank Prof. Dr. Mehmet Karahan for his instructive guidance and suggestions throughout the part of statistical analysis of my thesis.
I owe thank to Esra Kürkçü for her friendly helps, advices and guidance.
Last but not least, I am grateful to all my family members including my newborn nephew. Without their moral supports and prayers, it would be harder to obtain my master degree. I am blessed to have them for all my life. But, I owe special thanks to my lovely brother
Muhammad, he helped me with all his effort to make my thesis unique. I express my deepest gratitude towards him, I always admire him in my life.
vii
TABLE OF CONTENTS
ABSTRACT ... ii
ÖZET ... iv
ACKNOWLEDGEMENT ... vi
TABLE OF CONTENTS ...vii
LIST OF TABLES ...ix
LIST OF FIGURES ... x
CHAPTER 1: INTRODUCTION ... 1
1.1. Aim of the Study ... 3
1.2. Thesis Structure ... 3
CHAPTER 2: SPATIAL PERCEPTION ... 5
2.1. Spatial Perception ... 6
2.1.1. Vision ... 8
2.1.2. Light ... 12
2.2. Spatial Perception in Real Environment (RE) ... 19
2.3. Spatial Perception in Virtual Environment (VE) ... 23
2.4. Previous Comparative Studies Between Real Environment and Virtual Environment .... 27
CHAPTER 3: EXPERIMENTAL STUDY ... 31
3.1. Aim of the Study ... 31
3.1.1. Research Questions ... 32 3.2. Methodology ... 32 3.2.1. Sample ... 32 3.2.2. Experimental Set-up ... 34 3.2.3. Instruments ... 38 3.2.4. Procedure ... 40 3.2.5. Questionnaire ... 42 3.2.6. Statistical Analysis ... 43 3.3. Results ... 44
3.3.1. Comparison of Spatial Perception in Real and Virtual Environment ... 45
viii
CHAPTER 4: DISCUSSION ... 65
4.1. Spatial Perception in the Real and Virtual Environment ... 66
4.2. The Effects of Color Temperature in the Real and Virtual Environment ... 73
CHAPTER 5: CONCLUSION ... 77 REFERENCES ... 81 APPENDICES ... 90 Appendix A. ... 91 Appendix B. ... 95 Appendix C. ... 98
ix
LIST OF TABLES
Table 1: Values of color temperature and CRI of an ordinary fluorescent lamp from
IESNA………..….…………..16
Table 2: Comparison between human eye and HDM………...……..…….………..29
Table 3: Specification of lighting fixtures………..……….………..37
Table 4: Specifications of the HTC Vive Headset……….………39
Table 5: Comparison between RE and VE under 4000K (Wilcoxon Sign)…...……46
Table 6: Comparison between RE and VE under 6500K (Wilcoxon Sign)………....47
Table 7: Summary of comparison between RE and VE………..………...48
Table 8: KMO and Bartlett’s tests for both color temperature………....53
Table 9: Factor Analysis of 4000K; Total variance………...……..…...55
Table 10: Factor Analysis of 4000K; Pattern Matrix by using Oblimin Method…….55
Table 11: Factor Analysis of 6500K; Total variance………...…...56
Table 12: Factor Analysis of 6500K; Pattern Matrix by using Oblimin Method….…57 Table 13: Independent T-Test between CWL and DL in RE……….……59
Table 14: Independent T-Test between CWL and DL in VE……….….61
Table 15: Summary regression values in RE……….…63
Table 16: Coefficient table of regression in RE……….…………63
Table 17: Summary regression values in VE……….………….64
x
LIST OF FIGURES
Figure 1: Percentage of neurons in brain devoted to each sense………….………….7
Figure 2: Factors that influencing perception……….………..7
Figure 3: Optical system of human eye……….………...9
Figure 4: Optical vision process of HMD……….………9
Figure 5: Illustration of image distortions on HDM………..………..10
Figure 6: Example of distortion in different HMD……….………10
Figure 7: The process of human and virtual visual perception……….………..12
Figure 8: The relationship between lighting and its effects……….……...13
Figure 9: Ratio of the physical and emotional effects of lighting………….……….13
Figure 10: Ratio of the emotional effects of lighting components………….………14
Figure 11: Color Temperature Classes from Commission International de I’Eclairage and CIBSE ………...……...15
Figure 12: Color temperature and familiar light source………..…….….…………16
Figure 13: First version of Kruithof Curve………...……….…..………17
Figure 14: Modern version of Kruithof Curve………...…....……….………18
Figure 15: Comparison of preferences and comfort score..……….………...…....…19
Figure 16: Human perception process in real………..……….………....…...…20
Figure 17: Horizontal visual field of human from eye………21
Figure 18: Vertical visual field of human eye………..………...21
Figure 19: Distance and angle in human visual field……….….……….21
xi
Figure 21: Vision field of HDM……….26
Figure 22: Order of experiment’s sample groups……….….……..33
Figure 23: Plan of the test room (not to scale)……….…………...34
Figure 24: Section of the test room (not to scale)……….…………..35
Figure 25: Reflected ceiling of the test room (not to scale)……….……..35
Figure 26: RE under 4000K (CWL) -left- and 6500K (DL) –right-……….…..……38
Figure 27: VE under 4000K (CWL) -left- and 6500K (DL) -right-……….…...……38
Figure 28: Schematic illustration of the experimental procedure………..….…40
Figure 29: Mean Values of Environments under 4000K and 6500K……….………49
Figure 30: Frequently Distribution table of open ended question……….………...50
Figure 31: Frequently Distribution table of open ended question -2-…...51
Figure 32: Frequently Distribution table of open ended question -3- ……….……...51
Figure 33: Pathway that they followed during the experiment……….………..52
Figure 34: Variables that belongs to Factor I ………...58
Figure 35: Mean values of variables under 4000K and 6500K in RE……….……...60
Figure 36: Mean values of variables under 4000K and 6500K in VE…….……...62
Figure 37: Possible lens distortion for the experiment of this thesis……….……….69
1
CHAPTER 1
INTRODUCTION
The world and life standards are improving on daily basis due to the rapid
developing in technology. Virtual reality is one of the technology branches which is included in such fast improvement. Maybe the humans could not change the world, but at least they are capable of changing the environment (Orer, 2016). Environment can be also changed itself based on some factors. Normally, humans cannot have a full control over the environment as the external factors have influence on it as well. Recently, it became possible to have a full control on the environment by using the virtual reality (VR) control. VR does not only provide the control but it also opens the gates for other experiences beyond the imagination. For instance, it gives the chance to try impossible or fatal experiences such as bird eye fly which was not possible to attempt before such technology (Mudliyar, Ingale, Bhalerao & Jagtap, 2014). Since it is easily adaptable to variant situations, VR can take a part in several fields of our daily life.
2
The fast technology improvement closes the gaps between virtual and real environments. With the support of realistic headsets such as HTC Vive it was possible to approach the reality in some cases, even in the absence of some senses like smell or touch which is considered as a proof on the capability of VR to be as similar as reality world. It is accepted fact by experimental and scientific
communities that VR can be more beneficial in terms of cast, applicability, wildly and also it is easy to control external factors (Mudliyar et. al.,2014). Since the external factors can be easily controlled, this thesis focuses more on internal factors. The side of psychology in VR became a trend topic in this field. It has started to be investigated with the real interpretation of EMMA project (Alcaniz, Banos, Botella, Rey, 2003). Psychology side of VR, gain importance and become an acceptable variable in virtual environment. In this research, spatial perception was selected as a psychological effect. Moreover, these effects were analyzed in both the real
environment (RE) and the virtual environment (VE) under color temperatures of 4000K (cool white light) and 6500K (daylight). Lately, a comparative studies between real and virtual environments were carried out. Nevertheless, a few of them were concentrated on the visual appearances of spatial perception. For that reason, this thesis aimed to identify the similarities and differences between real and virtual environments -the virtual one was created as a simulation of real one- in terms of spatial perception.
3
1.1. Aim of the Study
Spatial perception and color temperatures are the starting points of this study to specify the differences between the real and virtual environments. Individual office environment is selected as an experimental environment as it is easier to control such environment and due to individual space itself, which means there is no human interaction to affect. The selected variables are investigated with the experimental study. Contributions of this dissertation into literature, will be beneficial and eased the understanding of spatial perceptions in selected environments.
1.2. Thesis Structure
This thesis consists of five main chapters. First chapter, the introduction states the rising virtual reality technology and its features as a tool in several work areas. Later on, the differences and similarities between virtual and real environments were addressed within the same chapter. The aim of this study was discussed in the paragraph that followed the introduction. The aim of the study is followed by the structure of this thesis.
The literature review was explained in details in the second chapter. Since the environment is the core topic of this studies, two different types of environments (real and virtual environments) were subject to detailed literature review. The examined variables were also addressed within the same chapter. Additionally, the
4
effect of these variables was investigated as well in order to observe whether they have the same effect on the same environment.
In chapter 3, the experimental setup was addressed in detail in chapter 3. After aim of the study, research questions was indicated and experiment details were stated to clarify. Beginning with experimental setup, specifying the sample group, then the procedure of the experiment. Continuing with the design of the experiment. After that, the statistical analysis was stated at the end of the chapter.
Chapter 4 was named as a discussion. In discussion part, results of the research and information that were gathered from the literature were discussed. Some
implementations were made in the light of these information.
Chapter 5 is the last chapter of thesis in which a brief summary of the study and sentences of conclusion were written. The limitation of this study and some future suggestions were discussed in the same chapter.
5
CHAPTER 2
SPATIAL PERCEPTION
Spatial perception described as a general-purpose representation of the environment that surrounding the humans (Witt et.al, 2007). It is not possible to associate space with the only one sense organ, space perception come into existence with
combination of senses like visual, auditory and time perception (Alexandre & Tavaras, 2010). Because of its quality of spatial perception, it considered as a supra-modal identity. Space perceptual divided into topic defined by distal properties in other name properties of architectural elements like distance, size and shape (Franz, 2005). The influential perspectives of space are psychophysiological dimensions of perceived spatial experience that provoke individual moods, feelings, preferences and attitudes. Personal interpretation of spatial perception shape with the context of culture, imagination, memory or previous emotional judgements (Naz et. el., 2017). To better understanding of spatial perception, definition of perception has to be done clearly than the major component of spatial perception which are vision and light have to be described at first.
6
2.1. Spatial Perception
Perception has several definitions and theories due to the conceptual framework of a structure. Its several definitions and theories, perception is commonly defined as a mental registration of sensory stimuli (Salvendy, 2013). Senses like sight, hearing, smell, taste or touch enable the humans to generate signal or stimuli from their surroundings (Rey et. al., 2004; Salvendy, 2013). Perception process consists of three sequential steps. Such process begins with the recognition -being aware of- which is followed by organizing step like gathering and storing and it is ended up with interpreting this sensory information by binding it to knowledge (Hendee & Wells, 1997; Salvendy, 2013). Perception goes beyond stimuli and it is based on sensations. Therefore, sensations are considered to be easier comparison to perception and it is part of humans’ objective tools. They tend to be identical or at least similar for all humans. However, perception rely on the individualities and their past experience, which makes vary from human to another (Gibson, MacLeod & Pick, 1974).
For instance, a feeling of warmness and smoke smell which can be sensed by human senses, when they both are combined together in a perception, they might be
interpreted into a fire (Gibson, MacLeod & Pick, 1974). Since the perception process starts with the stimulus and continued with the related sense of it, it is considered that senses and stimulus are the prerequisites for the existence of perception. Each sense of the human responsible for some stimulus. Despite of the figure below, generally, the human sensory channels gather under the three most affective channels. These channels have named as a visual related to eye, auditory that connected to ears and lastly haptic is concerned with the sense of touch (Kim et al., 2004).
7
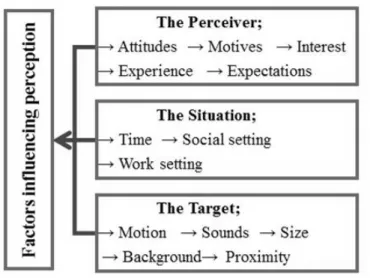
As a subjective process, the perception is influenced by three major factors which can be classified to perceiver based factors, target based factors and situation based factors that has shown in Figure 2 (Pierce & Gardner, 2002).
Perception can be shaped based on the physical structure of a stimulus. Yet, it is likely to have higher efficiency, when the sensorial organs work integrated. Most of the time these organs work under the complementary content (Alexandre & Tavaras, 2010). Vision and audition are the most well understood types of perceptions
(Mazza, 2009). SENSE Vision 30% Touch 8% Auditory 2% Taste / Smell < 1%
Figure 1: Percentage of neurons in brain devoted to each sense (Billinghurst & Thomas, 2017).
Figure 2: Factors that influencing perception.
8
Flynn and his colleagues conducted a study about the effect of white light with different properties on individuals’ perception. Findings indicated that lighting is a measurable factor for individuals’ perception against to visual field. (Flynn, Spencer, Martyniuk & Hendrick, 1973; Flynn, Hendrick, Spencer & Martyniuk, 1979) In addition to light, the effects of surface color on the perception of space have also been a subject of study (Odabasıoglu, 2015). For example, Oberfeld, Hecht and Gamer (2010) found that lighted ceilings and walls made the height of the room seems to be bigger than reality, while lighted floors has no significant impact on the perceived height (Oberfeld, Hecht & Gamer, 2010).
2.1.1. Vision
The most acceptable answer for the question of what is vision for, is that the purpose of the visual system is to generate and estimate a representation or a definition of the world around the human. Obviously, representation is not counted as a single image in the mind, it rather serves a beneficial function about the content of the world to be perceived (Kubovy, Epstein & Gepshtein, 2013). Vision is counted as the first component of the human sensorial system and it is obtained through the human brain rapidly (Alexandre & Tavaras, 2010). Nearly all kinds of animal including human rely on their vision -at first impression- to assist them in interacting with their
environments. In daily basis activities, like finding way around, looking for food and many other activities, require the perception of various features of spatial layout of the visible environmental properties such as sizes, distances and/or shapes (Franz, 2005). This aspect of perceptual activity can be referred to the perception of visual space. The representative view of the vision function remains in the minds. Vision
9
function according to Marr, is explained as “discovering from images what is present in the world” (1982). The most various source of information in the environment is represented by vision (Aznar & Da Silva, 2005). In 1993, Huertas and his co-workers claimed that vision is a pre-eminent perceptual system, as it provides a wide
surrounding to be perceived simultaneously in the existing environment.
The optical system of an eye does not contain the psychological and perceptual parts of individual vision (M.LaValle, 2017). Human visual system begins to operate when the luminous stimulation is detected by a sensitive neuron, the retina which is the first sensorial receiver (Alexandre, Tavaras, 2010). Retina is not static and normally it is not under full control of the human. Receiver transforms the stimulation into physical appearance (Alexandre, Tavaras, 2010). This transformation is directed to the related part in the human brain. In this way, the characteristics of information such as color, size or distance have started to come into existence (Alexandre, Tavaras, 2010).
Figure 3: Optical system of human eye.
10
Lenses causes the main differences between real and virtual in terms of vision. To become closer to the perception and sight of human eye, lenses are indispensable even if it has negative sides also. At the same time, they help to increase level of presence mostly, but rarely, distortions that caused by lenses, can be in high level depends on application (see Figure 5). That time manner, distortions can induce a headache or vertigo (Erskine, 2017).
Figure 5: Illustration of image distortions on HDM (Smus, 2019). -A: pincushion, B: barrel distortion-
Figure 6: Example of distortion in different HMD. -A: Oculus Rift, B: HTC Vive-
A)
B)
11
Moreover, vision provides utility providence to the human without any physical contact with the stimuli (Aznar & Da Silva, 2005). Vision can be considered as the core topic, when comparison is the main purpose of the question due to its ability to (Aznar & Da Silva, 2005);
Notice the stimulus at a certain distance without physical contact, Handle both the animated and unanimated structures,
Deal with multiple scales of spatial resolution,
Integrate the phenomenon of time and space at the same time,
Decide the characteristic of concerned stimulus with the help of brain, Lead to perceivers’ actions and behavior in the environment,
Differentiate between properties of the objects.
Visual sense is one of the most essential channel to perceptiveness towards
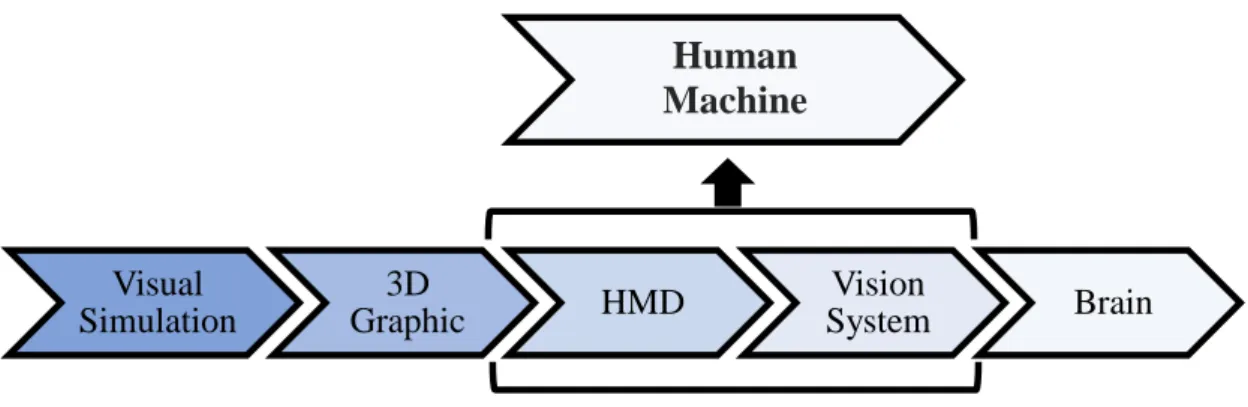
surroundings and for virtual environment as well due to its remarkable contribution in terms of believability (Kim et al., 2004). Visual channel of sensory system is one of the most channels which is subject to study especially in virtual reality scenes (Kim et al., 2004). As is seen in Figure 7, visual simulations are taken and transferred into 3D graphics and thanks to the human machine interface, all data are transmitted to the brain. In virtual environment, the process starts and continues as same until second step, then instead of human-machine, HMD and vision system are situated in step three lastly ends up when transmission process is completed.
12
Figure 7: The process of human and virtual visual perception (Billinghurst & Thomas, 2017).
2.1.2. Light
Light is the last element that needs to be addressed in order to have a clear
understanding of the spatial perception. Basically, light is the word that refers to the visible portion of the electromagnetic spectrum (IESNA, 1993). Without light, it is not possible to see and perceive what is happening in environment (Manav & Yener, 1999). Every individual has different demands, cultural, beliefs and educational background which have influence on his/her emotional reactions and responses to the light quality (Yücetaş, 1997). However, light has no ideal values, some other factors should be controlled in order to achieve better light quality. These quality
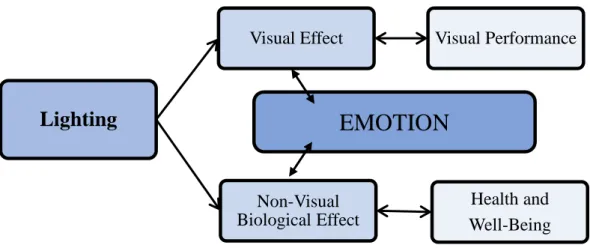
categorized into two segments, visual and non-visual or in some other sources, they can be named as physical and psychological effects (Van Bommel, 2006). The visual effects contain color temperature, brightness or color rendering, while the non-visual effects of light contain emotional responses, health or mood of individuals. In Figure 8, there is some kind of interrelationship between visual-nonvisual effects and emotions that (Van Bommal, 2006).
Visual Simulation 3D Graphic HMD Vision System Brain Human Machine Interface
13
Figure 8: The relationship between lighting and its effects (Van Bommal, 2006)
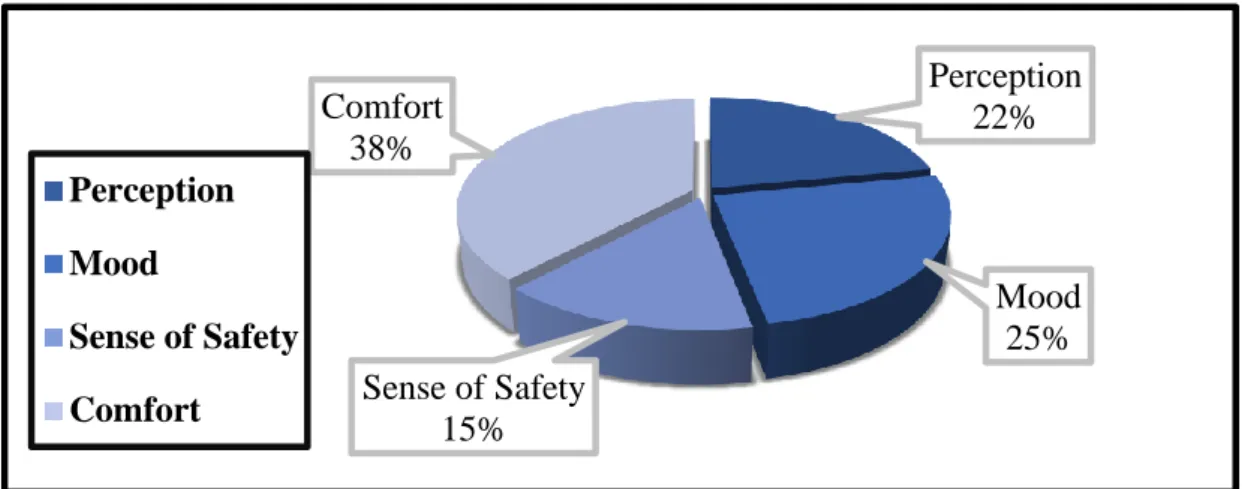
For a good lighting and space quality, designers, architects and engineers should pay attention to both the psychological and physical factors when designing a light. Most of the studies observe the emotional effect of the lighting quality. In one research which is published in 2017, there is a chart which shows the percentage of lighting effect according to previous studies (Kočanovs, Kočanova & Bogodistaja, 2017). As it seen in the following chart, the emotional effects of lighting have bigger influence than the physical effects. According to Bogodistaja and his associates (2017) emotional effects consist of several components which are perception, mood, sense of safety and comfort.
Lighting
Visual Effect Visual Performance
Non-Visual Biological Effect Health and Well-Being Emotional effect 58% Physical effect 42% Emotional effect Physical effect
Figure 9: Ratio of the physical and emotional effects of lighting (Kočanovs et. al., 2017).
EMOTION
14
Perception has been examined in a detailed way at the head of the chapter. Basically, comfort refers to pleasant feeling of being relaxed and for that article which is cited showed the comfort as a major component of the emotional impact of light. The sense of safety has the lowest share in this chart (Kočanovs et. al.2017).
There are some main physical lighting factors that must be given attention while designing light, such as general lighting illuminance, illuminance distribution, color rendering properties and color temperature (Nakamura, Karasawa 1999). According to American National Standard (1987), lighting quality is one of the primarily aspect of lighting and color temperature is one of the most important components of light quality for the human perception, as it provides comfort and effective visual
environments. (Veitch et. al., 1998; Katsuura, 2000; Samani, 2012). The concept of color temperature basically depends on the relationship between the temperature and the radiation emitted by a theoretical standardized material termed as ‘black body radiator’ cooled down to a state in which all molecular motion has ceased
(Abramowitz & Davidson, 2018). Color temperature can be defined as a value of the Perception 22% Mood 25% Sense of Safety 15% Comfort 38% Perception Mood Sense of Safety Comfort
Figure 10: Ratio of the emotional effects of lighting components reviewed studies (Kočanovs et. al., 2017).
15
absolute temperature of a black body radiator chromaticity that matches the one of the light source (Rea, 2000). In the case of the lamps and sources that can only approximate the chromaticity of a black body, the corrected term correlated color temperature is applied through a calculated chromaticity (Abramowitz & Davidson, 2018). The color temperature expresses the warmness or coolness of a light source like yellowish white, bluish white, or neutral in appearance, not the spectral energy distribution or the physical temperature (Egan & Olgyay, 2002).
ColorTemp. < 3300K Warm (reddish white) 3300 < Color Temp. < 5300 Intermediate (white)
5300 < Color Temp. Cool (bluish white)
Figure 11: Color Temperature Classes from Commission International de I’Eclairage (CIE technical report, 2004) and CIBSE (Boyce et al., 1989).
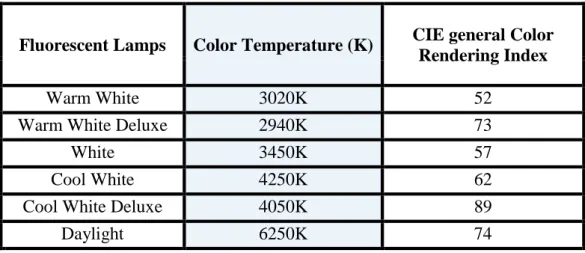
In the last chart, color temperature is divided into three main categories (warm, intermediate, cool) according to their temperature (see Figure 11). According two of the most recognized light organizations, CIE and CIBSE, warm light lays between 0K-3300K, while color temperatures between 3300K - 5300K are expressed as intermediate. Any other color temperature value that is greater than 5300K refers to cool light (Boyce et. al., 1989; CIE technical report, 2004). Some other literatures were more specific regarding the values of color temperatures. IESNA had more specific values and names about color temperatures that is shown in Table 1, which belongs to fluorescent lamps, they also stated the proper color rendering indexes (Kaufman, 1984).
16
Table 1: Values of color temperature and CRI of an ordinary fluorescent lamp from IESNA (Kaufman, 1984).
Figure 12: Color temperatures and familiar light sources from CIBSE (Boyce et al., 1989).
Several studies have been discussing the lighting and the relationship between light conditions and their impact of different physical and visual traits, the results were restricted though. For instance, color temperature (Öztürk , Yılmazer & Ural, 2011),
Fluorescent Lamps Color Temperature (K) CIE general Color Rendering Index
Warm White 3020K 52
Warm White Deluxe 2940K 73
White 3450K 57
Cool White 4250K 62
Cool White Deluxe 4050K 89
17
color temperature and illuminance together (Fleischer, Krueger & Schierz, 2001; Manav 2007), lighting arrangement (Manav & Yener, 1999), spectral power distribution (Fotios & Levermore, 1999) and illuminance and lighting arrangement together (Durak, et. al, 2007). Additionally, experimental psychological studies have conducted various evidence for the non-visual and psychological impact of light, such as attention (Guisa & Perney, 1974), perceived guilt (Taherzadeh, 2018), time-estimation task performance (Öztürk, Yılmazer & Ural, 2011), communication (Gifford, 1988), mood (Belcher & Kluzny, 1987) performance of various cognitive task and interpersonal behaviours (Baron et. al. 1992) mood and decision making (McClaughan, Aspinall & Webb, 1996; Kürkçü, 2017) and self-reported quality of life (Sörensen & Brunnström, 1995).
Since color temperature is one of the studied subjects in this thesis, Kruithof Curve should be shortly explained. In 1941, Kruithof has published his first curve
concerning the illuminance level and color temperature (Kruithof, 1941). The Kruithof Curve later on became the base of the majority of successor light quality studies. In 2015, Cuttle mentioned that “probably the most reproduced curve in the history of light” (Cuttle, 2015). Kruithof linked the color temperature of the light source to a range of illuminances that it was found to be ‘pleasing’ (Ashdown, 2015).
Figure 13: First version of Kruithof Curve (Ashdown, 2015)
18
In early researches, results were significantly different from one another. Baron et. al. (1992) figured out that participants was felt to be more relieved and pleased towards an experimental room when they were exposed to warm colored temperature than cool colored temperature or under the low temperature rather than high
illuminance. However, Boyce and Cuttle (1990) stated that color temperature has no effect on the subjective impression.
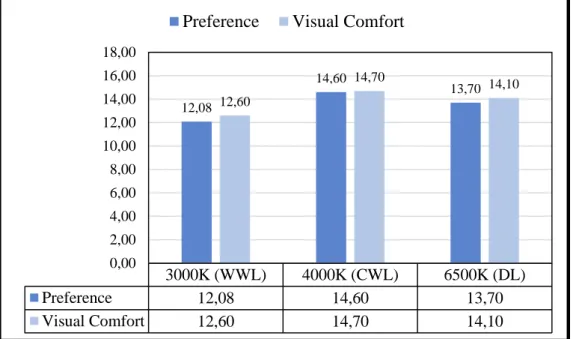
In 2013, an article was published that focuses on effects of light’s color temperature on visual comfort, task performance and alertness on office workers (Shamsul, Sia, & Karmegan, 2013). Their aim was to identify the effects of three different light’s color temperature which are warm white light (WWL = 3000K), cool white light (CWL = 4000K) and artificial daylight (DL = 6500K). Noticeable increase was observed in subjective alertness level and computer-based performance under the daylight condition. The typing performance in terms of speed was significantly better under the CWL when it was compared to WWL and DL. In spite of that, minimum error was made in typing performance under the DL, followed by CWL and WWL. CWL was the one preferred the most and selected as the most comfortable light by workers (Shamsul, et. el. 2013).
Figure 14: Modern version of Kruithof Curve (Fotios, 2016)
19
Another study from International Color Conferences 2018, Yılmazer and her team investigated the effects of color temperatures on color task performance and users’ mood. Two color temperature was used and 100 participants was attended. (2700K and 4000K). Participants showed better total accuracy under 4000K (cool white light) in comparison to 2700K (warm white light). In terms of mood, participants mood was affected in a positive way under 4000K (Yılmazer, et al., 2018).
2.2. Spatial Perception in Real Environment (RE)
The initial and traditional approach towards spatial perception (visual space perception) described that perceiver has internal representation of physical
environment, in other words visually perceived space or visual space, and then try to form an estimate of this visual space properties (Loomis, da Silva, Fujita &
Fukusima, 1992; Örer, 2016). While measuring the properties, they use numerous personal variables like knowledge and experience. Therefore, perception of interior
Figure 15: Comparison of preferences and visual comfort score (Shamsul, et. el. 2013).
and visual comfort
3000K (WWL) 4000K (CWL) 6500K (DL) Preference 12,08 14,60 13,70 Visual Comfort 12,60 14,70 14,10 12,08 14,60 13,70 12,60 14,70 14,10 0,00 2,00 4,00 6,00 8,00 10,00 12,00 14,00 16,00 18,00
20
space is psychological process at the same time it is learned, selective, dynamic, interactive and individual. (Lee & Aronson, 1974; Bloomer, 1990). Spatial perception is investigated under different categories such as auditory or visual perception (Atlı, 2010; Acun & Yılmazer, 2015),
It is not possible to associate space with only one sense organ. As it was said, the space perception comes into existence with combination of senses like visual, auditory and time perception (Alexandre, Tavaras, 2010). Due to this quality of spatial perception, it considered as a supra-modal identity. Powerful multisensory stimulus proved that human senses are connected and act together harmoniously. But the general rule human sensation has tendency to be dominated by the sensation type which ensures the most reliable and extra detailed information about the
surroundings (Eimer, 2004). For this reason in spatial perception, visual perception comes front because vision ensure the most accurate spatial information about the features of space (Eimer, 2004). When the entrance the room, in a highly manner, stimulus has started to perceive in eyes unconsciously. Therefore, the visual field of human eye mainly represents the spatial perception of human. In Figure 19, visual field of human is interchangeable depends on physical factors such like distance or angle (Pérez, Rueda & Orduña, 2018).
21
Figure 19: Distance and angle in human visual field (Pérez, Rueda & Orduña, 2018). Figure 17: Horizontal visual field of human eye (Billinghurst, Thomas, 2017)
22
Environmental factors are highly related with the evaluation of its perception. And, the proper use of these environmental factors physically, possible to change
individual spatial perceptions like enhance the feeling of satisfaction.
Evaluation of environmental quality in architecture has contained both qualitative and quantitative factors. Proportion, size, distance and scale are counted as quantitative statements, meanwhile qualitative statements are related to
environmental side of environment. In environmental psychology, to make correct assessment towards environments, some basic models were developed. Most of the times, these kind of models have been used with semantic differentiate scales for the most influential valuation of space. Beside semantic differentiate scale, opposite adjective pairs have been established as descriptors of environmental aspects. (Naz et. al. 2017). According to many studies there are some components of a
environment that help us while perceiving and evaluating the environment by evoking humans’ emotional responses. (Knez & Enmarker, 1998; Knez & Kers, 2001; Manav, 2007). Color and light are most influential quantitative factors that probably affect individuals’ perception of an environment (Knez & Enmarker, 1998; Knez & Kers, 2001). Perceptual awareness of this aspect individual first enters the space, before the eyes has time to adapt to the condition (Jaglarz, 2011).
Visual perception of a room size and proportions that occur under the impact of individual subjectiveness, visual memory, quality and features of light like glare, brightness, intensity and color perception (Jaglarz, 2011). There are many theories about the understanding of spatial phenomena. And the studies have still ongoing, since the varied content of spatial perception.
23
2.3. Spatial Perception in Virtual Environment (VE)
Cambridge Dictionary defined virtual reality (VR) as ‘’computer, images and sounds that make you feel an imagined situation is real’’ (2018). This definition does not cover the whole concept of virtual reality, where in there are some missing parts. Comprehensive description of virtual reality was written Steven M. Lavalle’s book Virtual Reality in 2017;
‘’Inducing targeted behavior in an organism by using artificial, sensory stimulation while the organism has little or no awareness of the
interference.’’
M Lavalle also had made an elucidator description between reality and virtuality, where he indicated that, real world can include instant experiences of users in physical world, while virtual world can refer to sense of targeted or designed experiences in any world that could be real, imaginary, future or past (M LaValle, 2018). VR become a very powerful technology that assure people to make
differences in human lives by stimulating human senses in an artificial way and human bodies could be manipulated to accept other versions of reality (M LaValle, 2018; Kim et al., 2004).
The main rise of virtual technology was started in parallel with worldwide spread of smartphone industry. This is due to the fact that smartphones are more qualified and developed than older times in terms of high resolution and price especially among college community and young generations who give more attention to this growing technology. Because it provides uncommon and new experiences with fresh ideas in
24
different fields such as art, entertainment, social network and academic fields. Mobilization of VR technology and portable headsets provide compelling VE experience and ease its accessibility among students (Özgen, 2017). VE has gained importance among different industries like medical, automotive, military,
advertising, education and other several industries. Nevertheless, VE has particularly highly developed in design field, where in it opened the gates for a new technology that can be utilized for design researches and practical fields (Özgen, 2017).
Before the passing to next topic, and in the light of previously mentioned
information, virtual environment could reveal the features of 5 matters (Mudliyar et. al, 2014);
1) Changes regarding the work that can be reconfigured easily in software.
2) Besides natural environment, unlimited and unnatural environments can be created to provide impossible or deadly experiences – e.g. bird eye fly- which would not be possible to achieve in the real.
3) Interactive and adaptive.
4) Human sensory motor systems and their senses are utilized more than before.
5) People can feel sense of presence in the synthetic & artificial environment.
As a subjective concept, perception displays the differences of several various perspectives that change from individual to another. The more diverse environment can be induced the more various perception can be realized. As is mention above,
25
since the concept of virtual environment is interactive and adaptive, human senses are used efficiently and at the time of experience in artificial environment not only one sense but multiple sensory channels play a part (Kim et al., 2004).
Real and virtual environment cannot be perceived as an exact same. Because, even if they are identical visually, other sense which are affective in perception, can be felt differently (M.LaValle, 2017). In previous pages, perception towards real
environment was addressed. In order to make meaningful and acceptable comparison between two environments, perception and vision in virtual environment were
analyzed. In title of vision, normal optical eye was examined not eye analyzed with virtual glasses. In virtual reality headsets, lenses are located to display the screen farther than reality (M.LaValle, 2017)
Human bodies and systems that have been living in natural environments since the beginning of the world, are not accustomed to virtual reality system. But with the help of senses and some other external factors, biological mechanism of human could be stimulated and adapted towards virtual environment (M LaValle, 2017). However, human bodies can react negatively in some cases. These negative reactions could cause some diseases like fatigue or headache. As an explanation of these reaction,
26
experts argue the over-worked and muzzy brain (M LaValle, 2017). In general, it is well-known as VR sickness. The most common VR sickness is motion sickness (Erskine, 2017). It occurs when the vestibular system of human does not work efficiently. Vestibular system is located in the inner ear of human and it enables the human to maintain balance, coordination, and awareness of spatial orientation. ("Vestibular system | anatomy", 2018). Normally, motion sickness develops when the vestibular systems send message to the brain of moving body which is
contradicting to the information comes from the eyes. Therefore, it might cause dizziness, sweating and vomiting (Erskine, 2017).
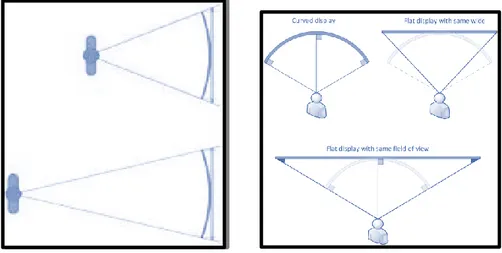
Figure 21: Vision field of HDM
Perception in VE is the concept that developers do not give too much of attention due to its psychological concept. In real environment and humans daily routine
perception process comes to existence unconsciously. For instance, when an
27
him/her immediately, while but the perception process has already started long time before (Daniel & Meitner 2000; M.LaValle, 2017).
In order to understand perception in VE, firstly it needs to understand how human perceives the real environment (RE). Perception in RE seems as it appears and it is completed by itself without any effort (Stahre, 2009). Because human does that every moment unconsciously. On the other hand, in VE, there are some information and cues that can lead, assist or manipulate the human perception (Stahre, 2009). For the next chapter, previous studies about comparative studies between real and virtual environment will be analyzed.
2.4. Previous Comparative Studies Between Real Environment and
Virtual Environment
Before the examination of previous studies in literature, Table 2, can be beneficial for understanding of previous studies objectives easier.
Table 2: Comparison between human eye and HDM (Billinghurst & Thomas, 2017)
HUMAN EYE HTC VIVE
FOV 200⁰ x 135⁰ 110⁰ x 110⁰ Stereo Overlap 120⁰ 110⁰ Resolution 30,000 x 20,000 2,160 x 1,200 Pixels/inch >2190 (100mm to screen) 456 Update 60 Hz 90 Hz
28
According to the M.LaValle, Real and virtual world cannot be perceived as an exact same. Because, even if they are identical visually, other sense which are affective in perception, can be felt differently (2017). However, some researchers such as Danford and Willems (1975), Flynn and his coworker (1977) or Daniel and Meitner (2000) (as cited in İmamoğlu, Şenyapılı and Demirbaş, 2009) stated in their studies that representatives of physical environments may result in similar outcomes like real environments.
In 1993, Henry and Furness made comparison between real and virtual environment about appreciation of room dimensions and object orientation judgements in real environment with three different conditions which was using only monitor, a head mounted display (HMD), without head tracking and lastly using HDM with head tracking. Their result indicated that in virtual environment, participants
underestimated the size of environments compared to participant in real environment condition. Investigators interpreted this situation in a way that HMD provided only restricted field of whole environment, and the borderlines of HMD distort the objects more than the center. These two mentioned factors dispose to demonstrate the
environment smaller than its actual size (Henry & Furness, 1993).
In 2003, other comparative experiment was performed in Virtual Laboratory. This study attempted to measure environmental factors thought the perception with five categories –ambiance, evaluation, arousal, privacy and security- using twenty nine bipolar adjective pairs. Semantic differential scale was applied for adjective pairs. As a statistical analysis, factor analyses was used (Kort, Ijsselsteijn, Kooijman &
29
in all other categories between RE and VE. In addition to that, participants evaluated RE more positively than VE for four other categories.
Researches which are interested in making a comparison of scenes in monoscopic (2D) and stereoscopic (3D) indicated that some minor differences have been recognized in how they are perceived. as a conclusion of such study, the 3D was perceived to be more realistic than 2D (Cauwerts and Bodart 2011). Stereoscopy did not demonstrate any considerable impact when comparing the subjective
interpretations of emotion and perceived presence (Cauwerts and Bodart 2011).
The differences in perceptions between real and virtual environments have been studying for the last decade. In 2013, Bruder and Steinicke, focused on perception of time during walking movement with head-mounted display (HMD). As a result of this research, they recorded no significant differences between real and virtual environments in terms of perception (Steinicke & Bruder, 2013). Similar study was conducted in 2015 by Heydarian and his research team. This study focused on a comparison between real and virtual environments in terms of perception,
performance and presence. Results revealed that participants act similarly in both environments with no significant differences (Heydarian et al., 2015).
In 2017, Anderson and his co-worker aimed to compare perception of users in real and virtual environment under the same physical condition. Most challenging part of this study was the utilizing of day light. Result stated that high level of perceptual accuracy did not point out any significant differences. Besides, participants felt high incidence of presence in virtual environment and there was no any significant impact
30
on physical symptoms on participants after using HDM. In the light of these findings, investigators noted that proffered experimental method appears promotive for usage of virtual environment instead of real environment in terms of considered five dimensions of perception in daylight spaces (Chamilothori, Wienold & Andersen, 2018).
In 2017, a research was conducted about virtual environment space quality by Naz and her research group. They sought an answer the question of that ‘to what extent emotional response in a simulated environment is affected by the same parameters of real environment?’ Result of the experiment demonstrated that perceivable emotional aspects of real spaces could be generated into virtual spaces as a stimulation of design attributes (Naz, Kopper, Ryan P. & Nadin, 2017).
31
CHAPTER 3
EXPERIMENTAL STUDY
3.1. Aim of the Study
After the entrance of virtual reality (VR) into human life, any field that might be somehow connected to the VR is continually changing due to the rapid advancing of VR technology (Botella et. al., 2004). Moreover, VR has become more of an issue for the architecture and design fields mainly in terms of experiencing environments which are unconstructed. Architects are trying to integrate VR in life. To do so, spatial perception – which is the essential factor to integrate VR in life – has to be taken into account. The spatial perception is human oriented factor. Thus, it might change immediately when the human enters an environment (Jaglarz, 2011).
The aim of this study is to make comparison between real environment (RE) and virtual environment (VE) in terms of spatial perception. To make such comparison, two office environments – identical by appearance- were created. One of these two
32
office environments was in the real environment (RE), while the other one was in a virtual environment (VE). Spatial perception was investigated comparatively in the two environments as a priority. As a later stage, the effects of different color temperatures -4000K (Cool White Light), 6500K (Daylight)- were evaluated in the existence office environments
3.1.1. Research Questions
In order to attain the aim of this study, the following research questions were constituted;
Q1: What are the differences between full-scale real and virtual office environments in terms of spatial perception?
Q2: Are there any impact of color temperatures -4000K-6500K- in created environments according to aspects of spatial perception?
3.2. Methodology
3.2.1. Sample
The sample group included graduated as well as undergraduate university students who participated voluntarily in the experiment. The experiment was carried out in Interior Architecture and Environmental Design Faculty of Bilkent University, Ankara. The sixty participants were divided into two, main sample groups equally and disorderedly. In total, participants were consisted of 24 males and 36 females.
33
The mean value of the participants’ age was 24.71 and their ages varied between 19 and 31 years old.
Every participant spent one minute to experience the environment individually. The experiment was conducted using the repeated measures design system in which the same sample group was tested repeatedly – two times- in order to prevent individual differences such as age, characteristic, gender and cultural background of
participants. Also to prevent it, order of conditions was presented in an equal selection. For that purpose, participants divided into two randomly, the half of participants experienced Real Environment (RE) first, while other half experiencing the Virtual Environment (VE) initially. Then the order of participant replace, by this mean, in both experimental environment, an equal number of participants
experienced the experiment at first order without being on familiar with environments.
1st Sample Group 2nd Sample Group Figure 22: Order of experiment’s sample groups
4000K
RE
VE
6500K
RE
VE
S1 S2 . . S29 S30 S30 S29 . . S2 S1 S31 S32 . . S59 S60 S60 S59 . . S32 S31 CWL DL34
3.2.2. Experimental Set-up
Experiment of the study was prepared in two different environments which were the real environment (RE) and the virtual environment (VE) under two different color temperatures; 4000K (CWL) and 6500K (DL). Two environments were prepared in order to guarantee the rooms layouts in terms of visually same appearance.
While the experimental environments were prepared, both environments must be taken into consideration to create identical environments. The experimental set-up was prepared. It was a full-scale office room in which the RE experiment will be carried out. This room was designed as if it was real private office environment with dimensions of; 4.00m length, 4.10m wide and a height of 3.20m (Figure 23, 24, 25).
35
Figure 24: Section of the test room (not to scale). .
Figure 25: Reflected ceiling of the test room (not to scale).
In order to eliminate daylight condition, windows were covered with black board in the manner that only the artificial light was analyzed. In order to minimize, the undesirable impacts of color, all furnishing elements and three dimensional elements
36
were selected and used achromatically or covered with achromatic colors. In addition, the materials’ color and texture in the office environment were chosen to generate matt and smooth surfaces that were far from specular reflection and glare.
As seen in the reflected ceiling plan (Figure 25), there are two fluorescent lighting fixtures that are embedded in the middle of the ceiling and existence sighting has appropriate distances to satisfy the expected illuminance levels (300-500 lux) which were decided by IESNA for office lighting (1993). Each one of existing lighting fixtures included two fluorescent lamps (four fluorescent lights in total).
The construction period of VE was started while RE was proceeding and VE required multiple steps to accomplish. First of all, AutoCAD drawings were transferred into a 3D Max program and harmonized into a three dimensional form without skipping any details. But the 3D Max program and HMD (head mounted display) did not match in terms of program compatibility. The project which was drawn by using 3D Max, had to be optimized in the Unity3d program. The firm of SIMTEK Stimulation and Information Technologies in Hacettepe Teknokent transferred 3D Max file into the Unity3d. To experience the virtual part of the
experiment, the empty room had to be founded in an indoor environment which has a same dimension as the RE room. The laboratory was used during vacant times in order to eliminate noise factor (Appendix B).
Tracking is one of the most common barriers in VR headsets due to the eternal desire to enhance it continuously which enables us to experience a better virtual reality (MLaValle, 2017).
37
Table 3: Specification of lighting fixtures. ("LUMILUX T8 | OSRAM Lamps", 2019)
4000K
(Cool White Light)
6500K
(Daylight)
Cool White Light Light Name
(in OSRAM) Cool Daylight
Fluorescent lamps, Light Type Fluorescent lamps,
T8 36W/840 Light Code T8 36W/865 ≥80 CRI ≥80 36 Wattage Nominal Wattage 36 Wattage 3350 lm Luminous Flux 3350 lm Spectral Power Distribution Color Spectra
38
Figure 26: RE under 4000K (CWL) -left- and 6500K (DL) -right-
Figure 27: VE under 4000K (CWL) -left- and 6500K (DL) -right- (see appendix B)
3.2.3. Instruments
Two types of headset were used for the realistic experience of virtual (VE), camera-based implementation (Oculus Rift) and laser-camera-based implementation (HTC Vive). According to implementations, although both of them are close to each other and high technology, there are some nuances that are important, Oculus Rift is more comfortable and practical for gamers, contrary to that, HTC Vive is offering more realistic and immerse experience to users. In a word, if the subject is desired to more realistic virtual environments and feeling of high presence, the best headset choice is HTC Vive for academic researches for now. Due to the fact that it was better at
39
resolution and sound quality, it gives more reliable results. In Table 4, technical information was given about HTC Vive ("VIVE™ | Virtual Reality System", 2018).
Table 4: Specifications of the HTC Vive Headset from their website ("VIVE™ | VIVE Virtual Reality System", 2018).
HTC VIVE HEADSET
Screen Dual AMOLED 3.6’’ diagonal
Resolution 1080 * 1200 pixels per eye (2160 * 1200 pixels combined)
Refresh Rate 90 Hz
Field of View 110 degree
Safety Features Chaperone play area boundaries and front-facing camera
Sensors SteamVR Tracking, G-sensor, gyroscope, proximity
Connections HDMI, UB2.0, stereo 3.5 mm headphone jack, power, bluetooth
Input Integrated microphone
Operating System Windows 7 SP1, Windows 8.1 or later, Windows 10
Image of HMD
Configuration of HDM
40
3.2.4. Procedure
Participants performed the experiment individually and orderly (Figure 28). Some students who have claustrophobia had difficulties while experiencing VE because of the virtual reality headsets mechanism. Right before the participant started to
perform, the conductor gave specific information and expectations about the
experiment. In the beginning, the participant’s demographic information was noted. The second step was experiencing the environment and it was expected that they should have an experience of one minute in the environment. Participants were free to do anything they want but only to touch was forbidden. While they were
experiencing the environment, one observer noted their path that they were followed during the experiment. After one minute experience, they left the experiment
environment and continued to answer questions which were helping to evaluate their perceptions towards to environments. That, with open ended questions their
41
Figure 28: Schematic illustration of the experimental procedure. Demographic Questions Experience the Environment Lighting Conditions
4000K (CWL)
Evaluation of environments performance Survey Questionnaire Analyzing of RE - VE Analyzing of Color Temperature6500 (DL)
Evaluation of environments performance Survey QuestionnaireRE - VE
42
3.2.5. Questionnaire
Questionnaire of the experiment consists of two kind of questionnaire method which were semantic differential scale by using 12 bipolar adjective pairs - dynamic-static, spacious-confined, formal-informal, usual-unusual, harmonious-discord, pleasant-unpleasant, attractive-unattractive, satisfying-unsatisfying, relax-tense, comfortable-uncomfortable, functional-nonfunctional, organized-disorganized with Five-Likert point and open ended questionnaire about spatial perception towards environments. And participants were expected to fill out the survey by themselves.
The purpose of this study is to reach individuals’ preference about the spatial perception of two different environments. For that purpose, the study was prepared according to the basis of environmental appraisals; personal impressions and
interpretations of spaces (Öztürk, Yılmazer and Ural, 2011). To measure perception towards environments were evaluated with the semantic differential measurement technic with 5-Likert system by using the set of bipolar adjective pairs. According to the Osgood (1952), Semantic Differential Method is used to measure the meaning of events, objects and concepts (Snider and Osgood, 1969). Kasmar (cited in Nasar, 1992) indicated that, if an individual wants to describe a physical environment, they need a proper scale for it. For that reason, the Lexicon of Environmental Descriptor Method was invented and developed by him. In literature, there are many studies that were carried out to improve Semantic Differential Method as a tool to comprehend individual impressions about environments from the point of lighting, acoustic, and so on (Flynn, Hendrick, Spencer & Martynik 1979). While the determination process of adjective pairs, literature retrieval was done and previous studies were analyzed.
43
Studies that were related to personal impression about interior office environment were chosen to construct questionnaires. Then the adjective pairs -dynamic-static, functional-nonfunctional, usual-unusual, harmonious-discord, spacious-confined, pleasant-unpleasant, attractive-unattractive, satisfying-unsatisfying, relax-tense, comfortable-uncomfortable, formal-informal, organized-disorganized- were
translated into Turkish with the help of the dictionary and previous studies (Öztürk, et. al. 2011). After that part of questionnaire, three open ended questions were prepared about personal impressions or interpretations of participants towards to experienced environments. Both part of questionnaire was applied after participants experienced the environment. When they completed both phase of experiment, three open ended questions were asked them to make comparison and express their observations, opinions and comments about environments. As a first question their general opinions was asked. Then if there is any complains about environment, asked them to verbalize that complains. Last question, asked them to suggestions to make environments in a better quality (see Appendix A).
3.2.6. Statistical Analysis
Statistical Package for the Social Science (SPSS 23.0) is the software used to analyze the acquired data. These statistical analyses were stated with reference to the research questions of study (see Chapter 3.1.1). Shapiro Wilk-W, the most reliable normality test was implemented in this study to address the differences between RE and VE (SPSS base 13.0 user's guide, 2004). By implementing such testing method, the P value of the acquired data became measurable. If the P value of data set is less than
44
0,05, it can be interpreted that the data was not distributed normally due to using nonparametric tests for analyzing the differences between RE and VE.
Wilcoxon Sign-Rank is a testing method that can be classified under nonparametric tests which is used to compare two sets of data. The core feature of the Wilcoxon test that the sample group is repeated. Therefore, this testing method was implemented separately to understand the differences between the two environments under different color temperatures. (SPSS base 13.0 user's guide, 2004). Factor Analysis was used to evaluate the differences between the two color temperatures, 4000K (cool white light) and 6500K (daylight). The results were not sufficiently meaningful though (SPSS base 13.0 user's guide, 2004). Therefore, the t-test was conducted to specify the differences between color temperatures of lights instead of factor analysis. Since the sample group was not remained same, the type of t-test was selected as independent (SPSS base 13.0 user's guide, 2004). Then, to make sure about t-test outcomes and learn more about variables, multilinear regression analysis was run.
3.3. Results
The results consist of statistical analyses and its findings. The objective of this paper
work focused mainly on addressing the core differences between RE and VE under
two different lighting conditions. The results were classified under to subheadings. One subheading meant to address the differences between RE and VE. The other
subheading discussed the influence of using two different color temperatures, 4000K
45
3.3.1. Comparison of Spatial Perception in Real and Virtual
Environment
To make comparison between environments, at first sample group, it was handled in respective order (See Figure 22). Spatial perception in real environment (RE) was examined under two different color temperatures of light. In total, four different environments were created for the experiment. While test variables were evaluated, must be considered about sample groups and their order. It needed to be certain that only one variable was able to change which was the evaluated parameter. Otherwise, results have meaningless values or not reliable. For that aim, environments were examined under both condition separately. Since the sample group was the same, the Wilcoxon Sign Test was used for these related samples. Both environments exhibited significant differences from each other. However, one can say that almost same differences between RE and VE were observed under the two color temperatures. Under the color temperature of 4000K, value table demonstrated significant
differences for adjective pairs of dynamic-static (p=0,000), functional-nonfunctional (p=0,037), usual-unusual (p=0,000) and harmonious-discord (p=0,001) and lastly, spacious-confined (p=0,002). On the other hand, the rest of pairs such as pleasant-unpleasant (p=0,782), attractive-unattractive (p=0,834), satisfying-unsatisfying (p=0,713), relax-tense (p=0,682), comfortable-uncomfortable (p=0,212), formal-informal (p=0.059), and organized-disorganized (p=0,939) did not exhibit significant difference in diverse environments (see Table 5). Participants perceived VE more dynamic, functional than RE, while RE was perceived more spacious, usual and formal than RE.