Turkish Journal of Field Crops, 2012, 17(2):177-184
IMPACT OF GENOTYPE AND NITROGEN FERTILIZER RATE ON YIELD
AND NITROGEN USE BY OAT (Avena sativa L.) IN TURKEY
Hasan MARAL1, Ziya DUMLUPINAR2*, Tevrican DOKUYUCU3 and Aydin AKKAYA3
1Karamanoglu Mehmetbey University, Ermenek Vocational School, Karaman, TURKEY. 2Kahramanmaras Sutcu Imam University, Agricultural Faculty, Department of Agricultural
Biotechnology, Kahramanmaras, TURKEY.
3
Kahramanmaras Sutcu Imam University, Agricultural Faculty, Department of Agronomy, Kahramanmaras, TURKEY.
*Corresponding author: [email protected] Received: 05.07.2012
ABSTRACT
Efficient nitrogen (N) use is one of the most crucial issues for crop management in developing countries. Since Turkish agricultural practices tends to use lower inputs of N fertilizers, a field trial was carried out in 2007-08 and 2008-09 cropping years to determine response of six oat genotypes (Seydisehir, Apak, Yesilkoy-330,
Amasya, Checota and Yesilkoy-1779) to three N rates (0, 100 and 200 kg ha-1). According to the results,
differences between the years were significantly important for all investigated traits except soil nitrogen content at planting (NCP), nitrogen content at maturity (NCM) and nitrogen accumulation in grain (NAG). Genotypes significantly varied for all traits except NCP, nitrogen in grain (NG) and NAG. However, differences among N rates were significant for all traits except NCP.Among the genotypes Checota had the
highest nitrogen use efficiency (NUE) and grain yield (GY) (20.6 kg kg-1 N and 2590 kg ha-1, respectively).
Keywords: Avena sativa L., grain yield, nitrogen use efficiency, oats.
INTRODUCTION
Hexaploid oat (Avena sativa L. and Avena byzantina Coch.) is widely used for human food and animal feed. Despite oat production decreases gradually in the world as well as in Turkey, demand in oat for human consumption increased due to dietary benefits of whole grain and β-glucan (soluble fiber) (Achleitner et al., 2008).
In cereals N fertilization accounts for significant proportion of the total input costs and may affect plant growth, development, yield and quality (Mohr et al., 2005). Reduced use of N fertilizer is likely to decrease both production costs and pollution, but could also result in reduced yields (Cassman et al., 2003). However, increasing N concentration does not always increase grain yield due to diminishing returns, and the excessive use of N raises potential adverse environmental and health concerns (Bohlool et al., 1992) and incidence of foliar pathogens and lodging of the plant (Samonte et al., 2006).
Nitrogen use efficiency is a complex trait (Muurinen et al., 2007) that comprises N uptake efficiency and N utilization (Moll et al., 1982; Ortiz-Monasterio et al., 1997). Studies have shown that genetic variation in cereals for nitrogen uptake efficiency (Kelly et al., 1995; Singh and Arora, 2001) and nitrogen utilization efficiency (Woodend et al., 1986; Papakosta, 1994; Singh and Arora, 2001). Przulj and Momcilovic (2003) reported that grain N content in wheat mainly represents N accumulated in
vegetative parts until anthesis and is translocated to the grain during the reproductive phase. Nitrogen in the form of protein and amino acids is a component of the pre-anthesis portion that is potentially available for grain filling (Schnyder, 1993). In barley, 10 to 100% of grain N is taken up during vegetative growth and translocated during the grain filling period (Carreck and Christian, 1991; Bulman and Smith, 1994). Sanford and MacKown (1987) found that variation in final spike N may be associated with variation in total N uptake. Bulman and Smith (1994) reported that post-heading N uptake in barley was generally not related to N concentration and N per plant at heading instead, it was highly correlated with total dry matter accumulation after anthesis and total plant N and grain at harvest. Environmental conditions during the pre- and post-anthesis periods are likely to have different effects on N accumulation. N uptake is influenced by available water (Clarke et al., 1990), the supply of nitrate (Cox et al., 1985; Papakosta and Gagianas, 1991), genotype requirements and nitrogen use efficiency, and other properties of the genotype and growing conditions (Przulj and Momcilovic, 2003).
Slafer and Peltonen-Sainio (2000) put targets on plant breeders to develop cultivars with increased yield potential associated with higher NUE-improved ability to absorb N more efficiently from the soil and partition the greater part of the absorbed N into the grain. Limited researches were devoted to determine NUE of oat
genotypes in literature. Therefore, the aims of the current study were to evaluate nitrogen fertilization response of six oat genotypes released between 1963 and 2004 for nitrogen use efficiency, its components and grain yield.
MATERIALS AND METHODS Plant materials
Oat genotypes Apak (registered in 1963), Yesilkoy-1779 (registered in 1964), Yesilkoy-330 (registered in 1975), Checota (registered in 1986), Seydisehir (registered in 2004) and Amasya (landrace) were evaluated for nitrogen fertilizers based on nitrogen use efficiency, its components and grain yield.
Field trials
Field experiments were carried out in 2007-08 and 2008-09 cropping years in Kahramanmaras province of Turkey (East–Mediterranean Region of Turkey, located between 37° 53' N, 36° 58' E and 507 m above sea level). The experiment was arranged in a Randomized Complete Block Design with three replications. Climate of the region is typical of Mediterranean climate and some
climatic data are shown in Table 1. Wheat plant was planted in previous years without fertilization to consume nitrogen amount in the experiment lands. Some chemical and physical traits of experiment soils sampled from 0-30 and 30-60 cm topsoil and analyzed. According to analysis experiment soils were loamy and alkaline, high in lime, adequate in phosphate and potassium and low in organic matter. Soil pH varied from 7.54 to 7.64. Nitrogen content of the soil from each plots at planting (NCP) were also measured and are given in Table 2. The experiments are planted on the dates of 18 November 2007 and 2008. Plot sizes were arranged as 6 x1.2 m and there were six plant rows in each plot. The sowing density was 350 seeds m -2.Besides different amount and application of N fertilization (0, 100 and 200 kg ha-1), a certain amount (80 kg ha-1) of phosphorus (P) was applied at planting. Half of the nitrogen was applied at planting, while the rest was applied as top dressing on the dates of 10 March 2008 in the first year and 19 February 2009 in the second year at tillering. Herbicide (Tribenuron–Methyl 75%) was used for weed control. At the maturity stage four rows in the middle of plots were harvested.
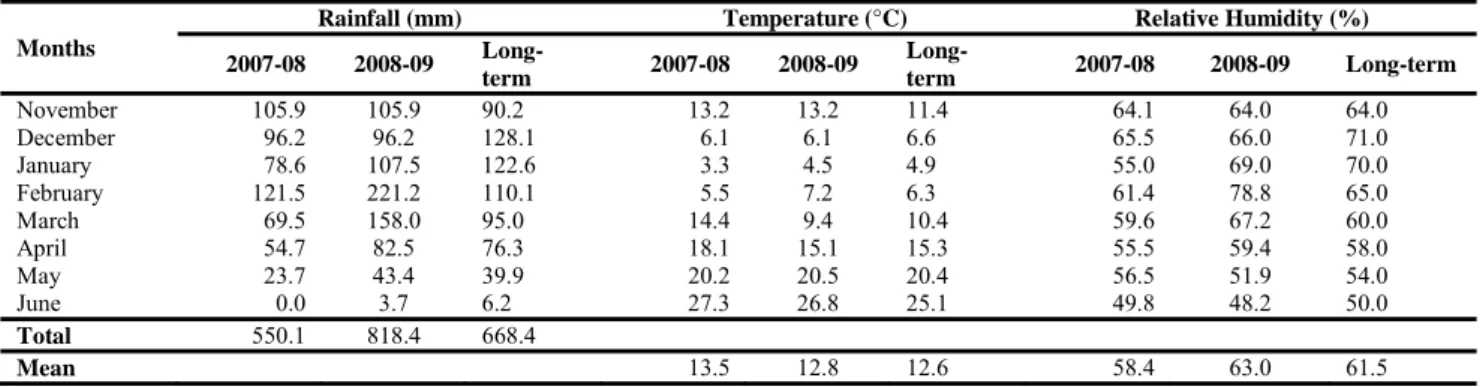
Table 1 Some average climatic data belong to experiment (2007-2009) and long-term years (1930–2009) of Kahramanmaras
province.
Months
Rainfall (mm) Temperature (°C) Relative Humidity (%)
2007-08 2008-09 Long-term 2007-08 2008-09 Long-term 2007-08 2008-09 Long-term November 105.9 105.9 90.2 13.2 13.2 11.4 64.1 64.0 64.0 December 96.2 96.2 128.1 6.1 6.1 6.6 65.5 66.0 71.0 January 78.6 107.5 122.6 3.3 4.5 4.9 55.0 69.0 70.0 February 121.5 221.2 110.1 5.5 7.2 6.3 61.4 78.8 65.0 March 69.5 158.0 95.0 14.4 9.4 10.4 59.6 67.2 60.0 April 54.7 82.5 76.3 18.1 15.1 15.3 55.5 59.4 58.0 May 23.7 43.4 39.9 20.2 20.5 20.4 56.5 51.9 54.0 June 0.0 3.7 6.2 27.3 26.8 25.1 49.8 48.2 50.0 Total 550.1 818.4 668.4 Mean 13.5 12.8 12.6 58.4 63.0 61.5 Investigated traits
Experiment soil was sampled from 0-30 cm depth from each plots and nitrogen content in soil at planting (NCP) was determined by Dumas procedure (Barbottin et al., 2005). Nitrogen content at flowering (NCF) and nitrogen content at maturity (NCM) were determined by Dumas procedure (Pan et al., 2006). Grain samples after harvest were dried at 65 °C for 48 hours and hulls removed by hand. Grain samples ground and screened through 0.5 mm sieve then nitrogen in grain (NG) was determined by Dumas procedure (Barbottin et al., 2005). Nitrogen accumulation in grain (NAG) was calculated by the formula; total grain N content (NG) / grain filling period (GFP) (Pan et al., 2006). Nitrogen utilization efficiency (UTE) was calculated by the formula: grain yield / total above ground N (Muurinen et al., 2006; Dawson et al., 2008). Grain filling period was determined as days between anthesis and maturity. Nitrogen use efficiency (NUE) was determined as: grain yield / total available N (NCP plus N amount applied to the plots) (Muurinen et al., 2006). Nitrogen remobilization
efficiency (NRE) was calculated as: amount of remobilized N (grain N content) / N uptake at flowering (Barbottin et al., 2005) and nitrogen harvest index (NHI) was calculated by the equation: grain N yield / total above ground N (Muurinen et al., 2006; Peng and Bouman, 2007). Grain yield (GY) was also determined by weighing of grain products obtained from the plot, harvested after excluding side effects of the plots.
Data Analysis
Factorial analyses of variance were conducted to determine the significance of the effects of year, genotype and nitrogen on NCP, NCF, NCM, NG, NAG, UTE, NUE, NRE, NHI and GY. The means of significant traits were analyzed and ranked by using the least significant difference (LSD) mean comparison test. Correlation analyses were used to determine the relationships among the investigated traits (SAS, 1999). In addition, linear regressions were used to calculate genetic improvements for grain yield and nitrogen use efficiency and to estimate relationship between grain yield and N rates.
RESULTS
Average air temperature of the experiment years and long-term were similar. The amount of rainfall differed
between years. In 2007-08, precipitation was lower than long-term. In 2008-09, precipitation was higher than in the first year and long-term average. The precipitation was mostly in spring (Table 1).
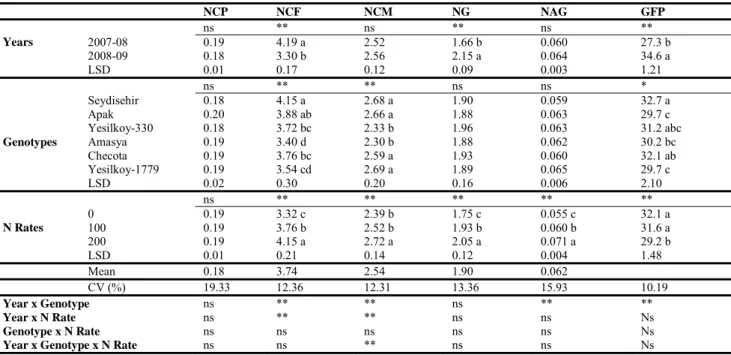
Table 2. Average data belong to soil nitrogen content at planting (NCP, mg kg -1), nitrogen content at flowering (NCF, g N plant-1),
nitrogen content at maturity (NCM, g N plant-1), nitrogen in grain (NG, g N grain-1), nitrogen accumulation in grain (NAG, mg N
grain day-1) and grain filling period (GFP day).
NCP NCF NCM NG NAG GFP Years ns ** ns ** ns ** 2007-08 0.19 4.19 a 2.52 1.66 b 0.060 27.3 b 2008-09 0.18 3.30 b 2.56 2.15 a 0.064 34.6 a LSD 0.01 0.17 0.12 0.09 0.003 1.21 ns ** ** ns ns * Genotypes Seydisehir 0.18 4.15 a 2.68 a 1.90 0.059 32.7 a Apak 0.20 3.88 ab 2.66 a 1.88 0.063 29.7 c Yesilkoy-330 0.18 3.72 bc 2.33 b 1.96 0.063 31.2 abc Amasya 0.19 3.40 d 2.30 b 1.88 0.062 30.2 bc Checota 0.19 3.76 bc 2.59 a 1.93 0.060 32.1 ab Yesilkoy-1779 0.19 3.54 cd 2.69 a 1.89 0.065 29.7 c LSD 0.02 0.30 0.20 0.16 0.006 2.10 N Rates ns ** ** ** ** ** 0 0.19 3.32 c 2.39 b 1.75 c 0.055 c 32.1 a 100 0.19 3.76 b 2.52 b 1.93 b 0.060 b 31.6 a 200 0.19 4.15 a 2.72 a 2.05 a 0.071 a 29.2 b LSD 0.01 0.21 0.14 0.12 0.004 1.48 Mean 0.18 3.74 2.54 1.90 0.062 CV (%) 19.33 12.36 12.31 13.36 15.93 10.19 Year x Genotype ns ** ** ns ** ** Year x N Rate ns ** ** ns ns Ns Genotype x N Rate ns ns ns ns ns Ns
Year x Genotype x N Rate ns ns ** ns ns Ns
** Significant at 1%, * significant at 5% and ns: not significant
Mean values of NCP, NCF, NCM, NG, NAG and GFP are given in Table 2, mean values of UTE, NUE, NRE, NHI and GY in Table 3 and Pearson correlation coefficients of the investigated traits in Table 4. The plant breeding achievements of oat genotypes released between 1963 and 2004, in respect to nitrogen use efficiency and grain yield are shown in Figure 1 and 2.
Figure 1. The plant breeding achievements of oat genotypes
released between 1963 and 2004, in respect to nitrogen use efficiency. Changes in nitrogen use efficiency with release year of six oat genotypes observed for two years.
Figure 2. Genetic improvements for GY of six oat genotypes
released between 1963 and 2004 evaluated with linear regression. Changes in grain yield with release year of six oat genotypes over two years data are illustrated.
Nitrogen content at planting was not different for years, genotypes and N rates. There was no fertilizer application in previous years and wheat was planted to consume nitrogen amount in the experiment soils. Therefore, the experiment soils N content was almost zero before planting. No interaction occurred among years, cultivars and N rates.
15.5 17.5 19.5 19.3 20.6 16.9 R² = 0,2043 Am asy a Ap ak Ye şilkö y‐ 1779 Ye şilkö y‐ 330 Ch ec o ta Sey d iş eh ir Landrace 1963 1964 1975 1986 2004
Nitrogen Use Efficiency (kg kg -1N)
2000 2080 2430 2480 2590 2050 R² = 0,1452 Am asy a Ap ak Ye şilkö y‐ 1779 Ye şilkö y‐ 330 Ch ec o ta Sey d iş eh ir Landrace 1963 1964 1975 1986 2004 Grain Yield (kg ha ‐1)
Significant differences (P<0.01) were recorded for NCF between years, genotypes and N rates. Year x genotype and year x N rate interactions were also significant (P<0.01). Seydisehir genotype had the highest NCF amount (4.15 g N plant-1) and Amasya had the lowest NCF amount (3.40 g N plant-1). Nitrogen content at flowering in the first year (4.19 g N plant-1) was higher than the second year (3.30 g N plant-1). At 200 kg ha-1 N rate, NCF was the highest with 4.15 g N plant-1 (Table 2).
Differences in NCM was significant for genotypes and N rates (P<0.01), whereas it was not significant for years (Table 2). In addition, year x genotype, year x N rate and year x genotype x N rate interactions were also significant for NCM (P<0.01). There was no significant differences between year one and year two, whereas 200 kg ha-1 N treatment had the highest NCM (2.72 g N plant-1) (Table 2). Two groups occurred for genotypes, Yesilkoy-330 and Amasya genotypes were in the same group with lower NCM with 2.33 and 2.30 g N plant-1, while Yesilkoy-1779, Seydisehir, Apak and Checota with higher NCM with 2.69, 2.68, 2.66 and 2.59 g N plant-1, respectively(Table 2). Genotypes were not different for NG, while years and N rates varied significantly
(P<0.01). In addition, no interaction occurred among year, genotype and N rates for NG (Table 2). In the first experiment year NG (1.66 g N grain-1) was lower than second year (2.15 g N grain-1). Nitrogen in grain was the lowest in control treatment (1.75 g N grain-1), whereas it was higher in 100 and 200 kg ha-1 N treatments with 1.93 and 2.05 g N grain-1,respectively. The differences in NAG was significant for N rates (P<0.01), while did not vary over years and genotypes (Table 2). There was a year x genotype interaction for NAG (P<0.01). At 200 kg ha-1 N treatment 0.071 mg N grain day-1 was determined, while the other N rates had lower NAG (Table 2). Genotypes (P<0.05), years (P<0.01), nitrogen rates (P<0.01) and year x genotype interaction (P<0.01) were different for GFP (Table 2). Seydisehir genotype had the highest grain filling with 32.7 days, while Apak and Yesilkoy-1779 genotypes were the earliest. In the first experiment year GFP was 27.3 days, while it was 37.6 days in the second experiment year. The nitrogen rates had significant effect on GFP. The earliest nitrogen rate was 200 kg ha-1 with 29.2 days, while control treatment was the latest with 32.1 days (Table 2).
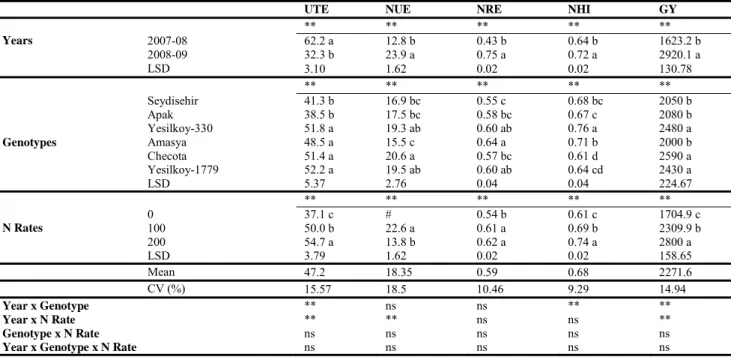
Table 3 Average data for nitrogen utilization efficiency (UTE, kg kg-1 N), nitrogen use efficiency (NUE, kg kg-1 N), nitrogen
remobilization efficiency (NRE, kg N kg-1 N), nitrogen harvest index (NHI, kg N kg-1 N) and grain yield (GY, kg ha-1).
UTE NUE NRE NHI GY
Years ** ** ** ** ** 2007-08 62.2 a 12.8 b 0.43 b 0.64 b 1623.2 b 2008-09 32.3 b 23.9 a 0.75 a 0.72 a 2920.1 a LSD 3.10 1.62 0.02 0.02 130.78 ** ** ** ** ** Genotypes Seydisehir 41.3 b 16.9 bc 0.55 c 0.68 bc 2050 b Apak 38.5 b 17.5 bc 0.58 bc 0.67 c 2080 b Yesilkoy-330 51.8 a 19.3 ab 0.60 ab 0.76 a 2480 a Amasya 48.5 a 15.5 c 0.64 a 0.71 b 2000 b Checota 51.4 a 20.6 a 0.57 bc 0.61 d 2590 a Yesilkoy-1779 52.2 a 19.5 ab 0.60 ab 0.64 cd 2430 a LSD 5.37 2.76 0.04 0.04 224.67 N Rates ** ** ** ** ** 0 37.1 c # 0.54 b 0.61 c 1704.9 c 100 50.0 b 22.6 a 0.61 a 0.69 b 2309.9 b 200 54.7 a 13.8 b 0.62 a 0.74 a 2800 a LSD 3.79 1.62 0.02 0.02 158.65 Mean 47.2 18.35 0.59 0.68 2271.6 CV (%) 15.57 18.5 10.46 9.29 14.94 Year x Genotype ** ns ns ** ** Year x N Rate ** ** ns ns ** Genotype x N Rate ns ns ns ns ns
Year x Genotype x N Rate ns ns ns ns ns
** Significant at 1%, ns: not significant and, # no measured data
Nitrogen utilization efficiency was significant over years, genotypes and N rates (P<0.01). Year x genotype and year x N rate interactions were also significant (P<0.01) for UTE (Table 3). Nitrogen utilization efficiency was higher in the first year (62.2 kg kg-1 N) than second year (32.3 kg kg-1 N). In addition, UTE was affected by increasing of N rates. The highest UTE with 54.7 kg kg-1 N was obtained from 200 kg ha-1 N treatment, while control treatment had the lowest (37.1 kg kg-1 N). Within the genotypes Yesilkoy-1779, Yesilkoy-330,
Checota and Amasya had the higher UTE with 52.2, 51.8, 51.4and 48.5kg kg-1 N, respectively, while Apak and Seydisehir had lower UTE with 38.5 and 41.3 kg kg-1 N, respectively. Significant differences were recorded for NUE over years, genotypes and N rates (P<0.01). Interaction between year x N rate was significant for NUE (Table 3). In the first experiment year NUE was lower with 12.8 kg kg-1 N, while it was higher in the second year with 23.9 kg kg-1 N (Table 3). No data measured for control treatment due to nonexistent available N (very
small amount N content at planting). On the other hand, NUE of 100 kg ha-1 N treatment (22.6 kg kg-1 N) was higher than 200 kg ha-1 N treatment (13.8 kg kg-1 N) (Table3). Nitrogen use efficiency differed markedly among the genotypes. Checota genotype had the highest NUE (20.6 kg kg-1 N), whereas Amasya genotype had the lowest (15.5 kg kg-1 N). Nitrogen remobilization efficiency varied for years, genotypes and N rates (P<0.01). However, there was no significant interaction for NRE (Table 3). Amasya genotype had the highest NRE value (0.64 kg N kg-1 N), while Seydisehir genotype was the lowest (0.55 kg N kg-1 N). Based on the LSD, there was no difference between Amasya, Yesilkoy-330, and Yesilkoy-1779 genotypes (Table 3).Nitrogen remobilization efficiency of the second year (0.75 kg N kg-1 N) was higher than the first year (0.43 kg N kg-1 N). Control treatment had lower NRE value (0.54 kg N kg-1 N), whereas 100 and 200 kg ha-1 N rates had similar NRE values (0.61 and 0.62 kg N kg-1 N) (Table 3). Nitrogen harvest index was significantly different for years, genotypes and N rates (P<0.01). Also, year x genotype interaction of NHI was significant (P<0.01). Yesilkoy-330 genotype had the highest NHI with 0.76 kg N kg-1 N and, Amasya and Seydisehir genotypes followed this genotype with 0.71 and 0.68 kg N kg-1N, respectively, whereas Checota had the lowest NHI with 0.61 kg N kg-1 N (Table 3). Based on the LSD Checota and Yesilkoy-1779 genotypes were similar.
In the first year NHI value was 0.64 kg N kg-1 N, while 0.72 kg N kg-1 N in the second year. Nitrogen harvest index differed for N rates, 200 kg ha-1 N treatment was the highest (0.74 kg N kg-1 N), while control treatment was the lowest (0.61 kg N kg-1 N). Grain yield varied for years, genotypes and N rates (P<0.01). Year x genotype and year x N rate interactions were also significant for GY (P<0.01). Checota genotype had the highest GY (2590 kg ha-1) and, Yesilkoy-330 and Yesilkoy-1779 genotypes followed this genotype (2480 and 2430 kg ha-1). However,
Amasya, Seydisehir and Apak genotypes had lower GY with 2000, 2050 and 2080 kg ha-1, respectively (Table 3). Grain yield was lower in year one (1623.23 kg ha-1), while it was higher in year two (2920.1 kg ha-1). Nitrogen rates had significant effect on GY, the lowest GY was obtained from control treatment (1704.9 kg ha-1), whereas the highest GY was obtained from 200 kg ha-1 N treatment (2800 kg ha-1).
Genetic improvements for NUE and GY of six oat genotypes released between 1963 and 2004 evaluated with linear regression (Figure 1 and Figure 2). There was a moderate relationship (R2= 0.204) between NUE and year of genotype releases except 2004. NUE was calculated 15.5 and 17.5 kg kg-1 N for Amasya landrace and Apak cultivar which was released in 1963. Nitrogen use efficiency was improved to 20.6 kg kg-1 N in Checota which was registered in 1986 (Figure 1). The grain yield improvement of oat genotypes was intermediate (R2= 0.145) between that lacks of improvement in Seydisehir which is released latest (Figure 2). It is noteworthy that Seydisehir genotype (2050 kg ha-1) released in 2004 intercepts between Amasya genotype (2000 kg ha-1) and Apak genotype (2080 kg ha-1) released in 1963. On the other hand, grain yield improvement of Checota genotype released in 1986
was the highest with 2590 kg ha-1 (Figure 2).
According to Pearson correlation coefficients over the mean values of investigated traits, some of the traits were found highly correlated to each other (Table 4). Grain yield was highly correlated with NG, NAG, GFP, UTE, NUE, NRE and NHI (r= 0.61**, r= 0.32**, r= 0.33**, r= 0.91**, r= 0.61**, r= 0.73** and r= 0.39**, respectively), while it was negatively correlated with NCF (r= -0.23*) (Table 4). On the other hand, NUE was highly correlated with NG, GFP, UTE, NRE and GY (r= 0.29*, r= 0.56**, r= 0.71**, r= 0.58** and r= 0.61**), while a negative relationship was determined with NCF (r= -0.56**).
T
able 4. Pearson Correlation Coefficients of investigated traits1 2 3 4 5 6 7 8 9 10 11 1. NCP --- 2. NCF -0.01 --- 3. NCM 0.0001 0.41** --- 4. NG -0.03 -0.16 0.16 --- 5. NAG 0.07 0.14 0.23* 0.64** --- 6. GFP -0.09 -0.04** -0.05 0.38** -0.37** --- 7. UTE -0.11 0.52** -0.14 0.48** 0.16 0.39** --- 8. NUE -0.09 -0.56** -0.02 0.29* -0.17 0.56** 0.71** --- 9. NRE -0.12 -0.52** 0.02 0.69** 0.25** 0.55** 0.75** 0.58** --- 10. NHI -0.02 -0.03 -0.10 0.53** 0.38** 0.20* 0.33** -0.06 0.46** ---11.GY -0.10 -0.23* 0.17 0.61** 0.32** 0.33** 0.91** 0.61** 0.73** 0.39** ---DISCUSSION
The two year experiment results indicate that oat genotypes varied in NCF due to differences in their vegetative periods. Differences in genotypes were influenced by genetics. Przulj and Momcilovic (2003) also reported differences among barley cultivars for NCF.
Nitrogen content at flowering was also affected by N rates. Higher NCF was obtained from the highest N application. In addition, environmental influence was also significant for NCF. Lower rainfall in year one resulted in higher NCF when compared to higher rainfall in year two. Seasonal differences such as rainfall probably accounted for year x genotype and year x N rate interactions. Similar
results were also reported by Muurinen et al. (2007). Genotypes were found different for NCM because of genetic influence. Genotypes responded to higher N rates with higher NCM. In previous work, Muurinen et al. (2007) stated that oat had higher mean total plant N content at maturity. Experiment years were not found different, while year x genotype, year x N rate and year x genotype x N rate interactions were found significant. This situation may be due to different climatic conditions between year one and two. Muurinen et al. (2007) reported large variation over years for NCM, which was in contrast with our findings. This situation may be due to regional conditions. In addition, Przulj and Momcilovic (2003) stated N losses from anthesis to maturity in the above ground plant parts might be caused by loss of some plant parts during the post-anthesis period for instance old leaves. Nitrogen in grain was not significantly different for genotypes. However, genotypes responded to higher N rates with higher NG. In addition, experiment years were found different due to environmental influence for NG. In our study oat genotypes were not significantly different for NAG while Muurinen et al. (2007) reported differences among species for NAG. However, genotypes responded higher N rates with higher NAG. In addition, NAG was not affected by years while year x genotype interaction was significant, which may be caused by significant changes in GFP across the years due to environmental effects and which NAG was calculated by the formula (NG/GFP). Przulj and Momcilovic (2003) also reported that poor growing conditions suppressed N accumulation during pre-anthesis, diminished translocated N amount, and increased post-anthesis N uptake. Genotypes, years and nitrogen rates showed variation for grain filling period. This may be due to genetic influence and climatic conditions. Wych et al. (1982) and Peltonen-Sainio and Rajala (2007) reported genetic influence for GFP.
Oat genotypes varied for nitrogen utilization efficiency. Isfan (1993) defined UTE as an essential physiological parameter contributing to improved NUE, which is in agreement with our findings. Higher nitrogen rates also promoted the higher UTE. Experiment years differed for UTE and, year x genotype and year x N rate interactions were significant for UTE. This situation may be due to environmental influence. Przulj and Momcilovic (2003) indicated variation between years. Ortiz et al. (1998) reported that improvement in UTE was achieved through reduced plant height and lodging, which is resulted in higher grain yield due to improved harvest index in wheat. Differences in UTE for cereals were also reported in previous works (Woodend et al., 1986; Papakosta, 1994; Singh and Arora, 2001). There were differences in NUE among genotypes. Muurinen et al. (2006) reported differences among cultivars of oat, barley and wheat. Calderini et al. (1995) reported differences in NUE for wheat. Nitrogen use efficiency was the highest at 100 kg ha-1 N rate (22.6 kg kg-1 N). Wetselaar and Farquhar (1980) and Papakosta and Gagianas (1991) reported N losses between anthesis to maturity under field conditions, which may explain the reason for lower N rate
was the most efficient than the highest level of N rate. In contrast with our findings, Muurinen et al. (2006) indicated that cultivars responded to higher N rates with higher NUE. Differences in years were significant for NUE and year x N rate interaction was significant. In previous works, for barley and oat, authors reported that agronomic efficiency of N use rather than NUE and varied widely depending on growing conditions (Isfan, 1993; Delogu et al., 1998; Sinebo et al., 2003; Muurinen et al., 2006). Oat genotypes differed for nitrogen remobilization efficiency, which demonstrates the ability of the crop to remove N from vegetative tissue. Nitrogen remobilization efficiency also increased with high level of N rates. In addition, experiment years varied for NRE. Nitrogen movement during grain filling in the soil might be limited by lower rainfall in year one as resulted in lower N content in grain. Muurinen et al. (2007) explained the differences with dry weather conditions during grain filling period, which is in line with our results. However, also reported that NRE might not be controlled by environment, which is not in agreement with our findings.
Nitrogen harvest index varied for genotypes. Nitrogen harvest index ratios of the genotypes were 61 to 76% which is similar with the previous works (Rattunde and Frey, 1986; Welch and Leggett, 1997; McMullan et al.,1988). Nitrogen harvest index responded to high level of N rates. In addition, NHI was affected by years and year x genotype interaction was significant. This situation might be due to precipitation differences between years. Oat genotypes differed for grain yield. Grain yield was ranked between 2000 and 2590 kg ha-1. Grain yield of the genotypes was influenced by genetics. Checota genotype had the highest grain yield with the highest UTE and NUE. Genotypes responded higher grain yield with high level of N rates. In addition, grain yield varied in experiment years and year x genotype and year x N rate interactions were important.
According to changes in NUE with year of six oat genotype releases, NUE improvement of Checota genotype was the highest with year of release of 1986. Genetic improvement for NUE was moderate that lacks of improvement in Seydisehir which had lower NUE than Apak, Yesilkoy-1779, Yesilkoy-330 and Checota even though released latest (Figure 1). On the other hand, changes in grain yield with the release year of six oat genotypes were intermediate. Seydisehir genotype lacks of improvement even though released latest while, grain yield improvement of Checota genotype was the highest that released in 1986 (Figure 2).
Nitrogen in grain, NAG, UTE and NUE were positively correlated with GY, while NCF was negatively correlated. N accumulation and the ratio of translocated N in grain affected grain yield positively. In the second experiment year, growing conditions were favorable and highest N content came from pre-anthesis at the high level of nitrogen treatments, whereas in year one half of the N amount in grain accumulated during grain filling period. Also, there was a positive relationship between NG and NAG. Przulj and Momcilovic (2003) stated that low
temperature and water deficit, lead to the inhibition of N absorption even N is available in the soil. Higher efficiency of N utilization resulted in higher grain yield (Przulj and Momcilovic, 2003). There was also a positive correlation between UTE and NUE. Muurinen et al. (2006) reported positive correlation between UTE and NUE and also stated that NUE would be improved through UTE which is in line with our results. Nitrogen remobilization efficiency and NHI were also positively correlated with GY, while positively correlated to each other as well.
CONCLUSIONS
The current study determines the response of six oat genotypes to nitrogen fertilization based on NUE, its components and GY. Among the genotypes Checota had the highest NUE and GY. In addition, genetic improvement of Checota genotype for NUE and GY was the highest. The cultivars with high NCF, NRE and NHI could be used in the development of cultivars with the desired N balance. Oat breeders should take advantage of the variation among oat cultivars in NUE, NRE, UTE and NHI so that in the future selected genotypes are both high yields and efficient utilizes of N.
LITERATURE CITED
Achleitner, A., N.A. Tinker, E. Zechner, H. Buerstmayr, 2008. Genetic diversity among oat varieties of worldwide origin and associations of AFLP markers with quantitative. Theor. Appl. Genet. 117: 1041-1053.
Bohlool, B.B., J.K. Ladha, D.P. Garrity, T. George, 1992. Biological nitrogen fixation for sustainable agriculture. A perspective. Plant Soil. 14: 1-11.
Barbottin, A., C. Lecomte, C. Bouchard, M.H. Jeuffroy, 2005. Nitrogen remobilization during grain filling in wheat: genotypic and environmental effects. Crop Sci. 45: 1141-1150.
Bulman, P., D.L. Smith, 1994. Post-heading uptake, retranslocation, and partitioning in spring barley. Crop Sci. 34: 977-984.
Calderini, D.F., S. Torres-Leon, G.A. Slafer, 1995. Consequences of wheat breeding on nitrogen and phosphorus yield, grain nitrogen and phosphorus concentration and associated traits. Ann. Bot.76: 315-322. Carreck, N.L., D.G. Christian, 1991. Studies on the pattern of
nitrogen uptake and translocation to grain of winter barley intended for malting. Ann. Appl. Biol. 119: 549-559. Cassman, K.G., A. Dobermann, D.T. Walters, H. Yang, 2003.
Meeting cereal demand while protecting natural resources and improving environmental quality. Ann. Rev. Environ. Resour. 28: 315-358.
Clarke, J.M., C.A. Campbell, H.W. Cutforth, R.M. De Pauw, G.E. Winkleman, 1990. Nitrogen and phosphorus uptake, translocation, and utilization efficiency of wheat in relation to environmental and cultivar yield and protein levels. Can. J. Plant Sci. 70: 965-977.
Cox, M.C., C.Q. Qualset, D.W. Rains, 1985. Genetic variation for nitrogen assimilation and translocation in wheat. II. Nitrogen assimilation in relation to grain yield and protein. Crop Sci. 25: 435-440.
Dawson, J.C., D.R. Huggins, S.S. Jones, 2008. Characterizing nitrogen use efficiency in natural and agricultural ecosystems to improve the performance of cereal crops in
low-input and organic agricultural systems. Field Crops Res. 107: 89-101.
Delogu, G., L. Cattivelli, N. Pecchioni, D. DeFalcis, T. Maggiore, A.M. Stanca, 1998. Uptake and agronomic efficiency of nitrogen in winter barley and winter wheat. Eur. J. Agron. 9: 11-20.
Isfan, D., 1993. Genotypic variability for physiological efficiency index of nitrogen in oats. Plant Soil. 154: 53-59. Kelly, J.T., R.K. Bacon, B.R. Wells, 1995. Genetic variability in
nitrogen utilization at four growth stages in soft red winter wheat. J. Plant Nutr. 18: 969-982.
McMullan, P.M., P.B.E McVetty, A.A. Urquhart, 1988. Dry matter and nitrogen accumulation and redistribution and their relationship to grain yield and grain protein in oats. Can. J. Plant Sci. 68: 983-993.
Mohr, R.M., C.A. Grant, W.E. May, 2005. N, P and K: Fertilizer management for oats. Top Crop Manager. 5: 30.
Moll, R.H., E.J. Kamprath, W.A. Jackson, 1982. Analysis and interpretation of factors which contribute to efficiency of nitrogen utilization. Agron. J. 74: 562-564.
Muurinen, S., G.A. Slafer, P. Peltonen-Sainio, 2006. Breeding effects on nitrogen use efficiency of spring cereals under northern conditions. Crop Sci. 46: 561-568.
Muurinen, S., J. Kleemola, P. Peltonen-Sainio, 2007. Accumulation and translocation of nitrogen in spring cereal cultivars differing in nitrogen use efficiency. Agron. J. 99: 441-449.
Ortiz-Monasterio, J.I., K.D. Sayre, S. Rajaram, M. McMahon, 1997. Genetic progress in wheat yield and nitrogen use efficiency under four nitrogen rates. Crop Sci. 37: 898-904. Ortiz, R., S. Madsen, S.B. Anderson, 1998. Diversity in Nordic
spring wheat cultivars (1901-93). Acta Agri. Scand. Sect. B. Soil Plant Sci. 48: 229-238.
Pan, J., Y. Zhu, D. Jiang, T. Dai, Y. Li, W. Cao, 2006. Modeling plant nitrogen uptake and grain nitrogen accumulation in wheat. Field Crops Res. 97: 322-336.
Papakosta, D.K., A.A. Gagianas, 1991. Nitrogen and dry matter accumulation, remobilization, and losses for Mediterranean wheat during grain filling. Agron. J. 83: 864-870.
Papakosta, D.K., 1994. Analysis of wheat cultivar in grain yield, grain nitrogen yield and nitrogen utilization efficiency. J. Agron. Crop Sci. 172: 305-316.
Peltonen-Sainio, P., A. Rajala, 2007. Duration of vegetative and generative development phases in oat cultivars released since 1921. Field Crops Res. 101: 72-79.
Peng, S., B.A.M. Bouman, 2007. Prospects for genetic improvement to increase lowland rice yields with less water and nitrogen. In:Spiertz, J.H.J., Struikand, P.C., Van Laar, H.H. (eds), Scale and Complexity in Plant Systems Research. Gene-Plant-Crop Relations. Springer, pp. 251-256. Przulj, N., V. Momcilovic, 2003. Dry matter and nitrogen
accumulation and use in spring barley. Plant Soil Environ. 49(1): 36-47.
Rattunde, H.F., K.J. Frey, 1986. Nitrogen harvest index in oats: Its repeatability and association with adaptation. Crop Sci. 26: 606-610.
Samonte, S.O.P.B., L.T. Wilson, J.C. Medley, S.R.M. Pinson, A.M. McClung, J.S. Lales, 2006. Nitrogen utilization efficiency: Relationships with grain yield, grain protein, and yield-related traits in rice. Agron. J. 98: 168-176.
Sanford, D.A., C.T. MacKown, 1987. Cultivar differences in nitrogen remobilization during grain fill in soft red winter wheat. Crop Sci. 27: 295-300.
SAS Institute, 1999. SAS system for windows release 8.01. SAS Inst., Cary, NC.
Schnyder, H., 1993. The role of carbohydrate storage and redistribution in the source-sink relations of wheat and
barley during grain filling-a review. New Phytol. 123: 233-245.
Singh, V.P., A. Arora, 2001. Intraspecific variation in nitrogen uptake and nitrogen utilization efficiency in wheat (Triticum aestivum L.). J. Agron. Crop Sci. 186: 239-244.
Sinebo, W., R. Gretzmacher, A. Edelbauer, 2003. Genotypic variation for nitrogen use efficiency in Ethiopian barley. Field Crops Res. 85: 43-60.
Slafer, G.A., P. Peltonen-Sainio, 2000. Yield trends of temperate cereals in high latitude countries from 1940 to1998. Agric. Food Sci. Finl. 10: 121-131.
Welch, R.W., J.M. Leggett, 1997. Nitrogen content, oil content and oil composition of oat cultivars (A. sativa) and wild Avena species in relation to nitrogen fertility, yield and partitioning of assimilates. J. Cereal Sci. 26: 105-120. Wetselaar, R., G.D. Farquhar, 1980. Nitrogen losses from tops of
plants. Adv. Agron. 33: 263-302.
Woodend, J.J., A.D.M. Glass, C.O. Person, 1986. Intraspecific variation for nitrate uptake and nitrogen utilization in wheat (T. aestivum L.) grown under nitrogen stress. J. Plant Nutr. 9: 1213-1225.
Wych, R.D., R.L. McGraw, D.D. Stuthman, 1982. Genotype x year interaction for length and rate of grain filling in oats. Crop Sci. 22: 1025-1028.