Korean Circulation Journal
Introduction
Coronary artery disease (CAD) is a progressive disease characterized by various symptoms and findings ranging from angina pectoris to sudden cardiac death as a result of decreased blood flow during rest or
exercise due to the characteristics of coronary artery lesions.1) Diagnosis
of CAD is made by non-invasive (electrocardiography [ECG], exercise stress test, myocardial perfusion scintigraphy, coronary computed tomography) and invasive (coronary angiography) methods.2)
Dilaveris et al.3) studied P wave intervals in the ECG. P wave
intervals were measured in all derivations and the difference between the longest P wave (Pmax) and the shortest P wave (Pmin) was calculated as P wave dispersion (PWD). That study demonstrated that Pmax and PWD evidently increased among patients with a history of idiopathic paroxysmal atrial fibrillation as compared to healthy normal controls. The QT interval was defined as a measure of the time between the initiation of the Q wave and the end of the T wave. QT interval varies with heart rate and is calculated with Bazett’s formula as corrected QT (QTc). The difference between the longest QT interval (QTmax) and the shortest QT interval (QTmin) on the ECG is defined as QT dispersion (QTd). If QTc intervals are used, then it is defined as QTc dispersion (QTcd). Print ISSN 1738-5520 • On-line ISSN 1738-5555
The Relationship between P
& QT Dispersions and Presence & Severity
of Stable Coronary Artery Disease
Bingül Dilekci Şahin, MD
1, Erkan Yıldırım, MD
1, Emrah Ipek, MD
1, Mahir Cengiz, MD
2, Kursat Aslan, MD
1,
Esra Poyraz, MD
3, Selami Demirelli, MD
1, Murat Bayantemur, MD
1, Emrah Ermis, MD
1, and Cavlan Ciftci, PhD
41Department of Cardiology, Erzurum Region Training and Research Hospital, Erzurum,2Department of Internal Medicine, Cerrahpaşa Faculty of Medicine, Istanbul
University, Istanbul, 3Department of Cardiology, Istanbul Siyami Ersek Training and Research Hospital, Istanbul,4Department of Cardiology, Istanbul Bilim University,
Istanbul, Turkey
Background and Objectives: The study aimed to evaluate the correlation between electrocardiographic (ECG) parameters and presence and extent of coronary artery disease (CAD) to indicate the usefulness of these parameters as predictors of severity in patients with stable CAD.
Subjects and Methods: Two hundred fifty patients, without a history of any cardiovascular event were included in the study. The ECG parameters were measured manually by a cardiologist before coronary angiography. The patients were allocated into five groups: those with normal coronary arteries (Group 1), non-critical coronary lesions (Group 2), one, two and three vessel disease (Group 3, Group 4 and Group 5, respectively. .
Results: Group 1 had the lowest P wave dispersion (PWD) and P wave (Pmax), QT interval (QTmax), QT dispersion (QTd), corrected QT dispersion (QTcd) and QT dispersion ratio (QTdR), while the patients in group 5 had the highest values of these parameters. Gensini score and QTmax, QTd, QTcmax, QTcd, QTdR, Pmax, and PWD were positively correlated. QTdR was the best ECG parameter to differentiate group 1 and 2 from groups with significant stenosis (groups 3, 4, and 5) (area under curve [AUC] 0.846). QTdR was the best ECG parameter to detect coronary arterial narrowing lesser than 50% and greater than 50%, respectively (AUC 0.858).
Conclusion: Presence and severity of CAD can be determined by using ECG in patients with stable CAD and normal left ventricular function. (Korean Circ J 2016;46(4):522-529)
KEY WORDS: Coronary artery disease; P wave & QT interval; Electrocardiography.
Received: August 8, 2015
Revision Received: November 4, 2015 Accepted: December 1, 2015
Correspondence: Bingül Dilekci Şahin, MD, Department of Cardiology, Erzurum Region Training and Research Hospital, Erzurum 25100, Turkey Tel: 90-442-2325555, Fax: 90-442-2325025
E-mail: [email protected]
• The authors have no financial conflicts of interest.
This is an Open Access article distributed under the terms of the Creative Commons Attribution Non-Commercial License (http://creativecommons. org/licenses/ by-nc/3.0) which permits unrestricted non-commercial use, distribution, and reproduction in any medium, provided the original work is properly cited.
QTd is a parameter measured non-invasively on the surface ECG and indicates heterogeneity of ventricular repolarization. Increased QTd has been found to be associated with serious arrhythmias and sudden death risk in the ischemic or non-ischemic cardiac disease group.3) A report published by Day et al.4) in 1990 stated that QTd
was a direct criterion of heterogeneity of myocardial repolarization. The studies did not show significant differences between male and female patients in terms of QTd.4) Also, it was proved that age did
not significantly affect QTd.5) QT dispersion ratio (QTdR)–defined as
QTd divided by cardiac cycle length- is considered to be a more valuable parameter than QTd in terms of predicting ventricular arrhythmia.6) It was demonstrated that QTd increased in patients
with acute myocardial infarction as compared to normal people.7)
Some studies indicated that QTd increased in the chronic phase of myocardial infarction and in patients with chronic CAD as compared to normal people although not as much as in patients with acute myocardial infarction.8) It was shown that QTd was also
associated with increased cardiovascular mortality and morbidity in patients with diabetes and peripheral vascular disease and end-stage renal disease.9)10)
For measurement of the electrocardiographic parameters, manual and automatic measurement techniques are used. But, it has not yet been demonstrated that automatic measurement techniques are superior to manual measurement techniques.11) One of the most
crucial prognostic factors in CAD patients is the severity of CAD, which was revealed by the Coronary Artery Surgery Study.12) The
scoring technique used in our study was defined by Gensini,13)
in which the scores are obtained according to the degree of angiographic stenosis and multiplied by the coefficients pre-defined for each main coronary artery segment and the sums are added.
The aim of our current study was to evaluate the correlation between ECG parameters and severity of CAD and to examine whether these non-invasive parameters were able to detect coronary artery disease or not.
Subjects and Methods
Study populationThis study was designed as a cross-sectional observational study that included 250 patients who were admitted to our outpatient clinic between April 2012 and September 2012 and were referred for coronary angiography upon suspicion of stable CAD. A total of 512 patients with CAD were screened, and 250 patients who fulfilled the inclusion and exclusion criteria were included in the study. Our study was assessed and approved by the Research
Ethics Committee of Medicine Faculty of Istanbul Bilim University (approval number: 14.03.2013/03-11). All data in hospital archives of the participating patients about the pre-coronary angiography period was examined. Patients’ demographic characteristics (age, gender), risk factors such as hypertension (HT), diabetes mellitus (DM), smoking and family history, left ventricular ejection fraction, and left ventricular hypertrophy, and biochemical and hemogram values were recorded.
Coronary angiography
On coronary angiography, narrowing of coronary arteries by ≥50% was accepted as significant CAD, and accordingly, patients were classified into the following five groups: Group 1: those with normal coronary arteries, Group 2: those with non-critical coronary lesions (narrowing of coronary arteries lesser than 50%), Group 3: those with one vessel disease (narrowing of one major coronary artery greater than ≥50%), Group 4: those with two vessel disease (narrowing of two major coronary arteries greater than ≥50%), Group 5: those with three vessel disease (narrowing of three major coronary arteries greater than ≥50%). Severity of CAD was established using Gensini score index of stenosis obtained from coronary angiography.13) According to the scoring system designed
by Gensini,13) 1 point is given for 0-25% stenosis, 2 points are given
for 25-50% stenosis, 4 points are given for 50-75% stenosis, 8 points are given for 75-90% stenosis, 16 points are given for 90-99% stenosis, and 32 points are given for 100% narrowing. Then, the scores obtained according to the degree of angiographic stenosis are multiplied by the coefficients pre-defined for each main coronary artery segment and the sums are added.
Electrocardiography measurements
ECG of the patients was assessed before angiography. The measurements were performed at a speed of 25 mm/sec by a standard electrocardiography machine (Nihon Kohden Corporation, 1-31-4, Nishiochiai, Shinjuku-ku, Tokyo, Japan). The onset of P-waves was determined by the point of initiation of P-wave deflection on the isoelectric line, and the ending of P-waves was determined by the point of ending of P-wave deflection on the isoelectric line. Pmax was defined as the longest P wave and Pmin was defined as the shortest P wave on 12 lead ECG and the difference between Pmax and Pmin was defined as PWD. The QT interval was measured between the onset of the Q wave and the end of the T wave on the isoelectric line in milliseconds and the lowest point between T and U waves was accepted as the end of the T wave in ECGs with U waves. Derivations that could not be clearly established were not analyzed. It was necessary that all of the subjects should have the measurements of QT intervals for at
least 9 out of the 12 derivations. According to heart rates, using Bazett’s formula (QT/√R-R), QTc was measured. QTcd was measured by calculating the difference between the QTcmax and QTcmin, and QTdR was calculated by dividing the QTd by the cardiac cycle length and obtained using the cardiac cycle formula (QTd/R-R-ms)×100. All of the measurements were manually performed using a magnifier.
Inclusion criteria
The individuals without a history of any known cardiovascular disease (previous myocardial infarction, percutaneous coronary intervention, coronary artery bypass-grafting) and with preserved left ventricular function were included in the study.
Exclusion criteria
The individuals with a history of cardiovascular disease, valvular heart disease, cardiomyopathy, congestive heart failure, cardiac dysrhythmia or heart conduction disorders, permanent pacemakers, antiarrhythmic drugs or drugs that affect the autonomic nervous system, pregnancy, severe organ failure (kidney, liver) or organ malignancies were excluded from the study.
Statistical analyses
Statistical analyses were performed using SPSS 21.0 software for Windows (SPSS Inc., Chicago, IL, USA). All sta tistical comparisons were performed using the student’s t-test. The unpaired t-test was also validated using the non-parametric Mann Whitney U tests. Chi-square test or Fisher exact test was applied for the comparison of
categorical variables. The values were expressed as mean±standard deviation or the median and the inter-quartile range (range from the 25th to the 75th percentile). An analysis of variance was used to compare continuous variables. The subsequent post hoc evaluation was performed by the Bonferroni method. Pearson’s correlation was used for numerical data. Spearman’s correlation was used for nominal data. To assess the diagnostic accuracy, we performed the receiver operating characteristic (ROC) curve analysis. The area under the ROC curve (AUC) was then estimated. p values<0.05 were considered to be statistically significant.
Results
A total of 512 patients with CAD were screened, and 250 patients who fulfilled the inclusion and exclusion criteria were included in the study.
The general characteristics of the study groups are shown in Table 1. Sixty-two participants were females (24.8%) while 188 participants were males (75.2%), and the average age of the patients was 57.9±8.5 years. Age and gender distribution did not differ among groups. When the prevalence of comorbid diseases such as HT, DM and hyperlipidemia was compared among the groups, no difference was observed. There were no differences among the groups in terms of smoking and alcohol consumption. Family history was not different among the groups.
Table 2 demonstrates the laboratory and clinical characteristics Table 1. Categorical distribution of the socio-demographic data of patients
Group 1 Group 2 Group 3 Group 4 Group 5 p
Gender (female/male) 14/36 14/36 9/41 11/39 14/36 0.686 Age 56.2±6.4 56.5±7.6 58.5±9.1 59.1±7.1 59.4±7.2 0.103 HT 24 (17.3) 24 (17.3) 32 (23.0) 29 (20.9) 30 (21.6) 0.370 DM 15 (30) 11 (22) 17 (34) 21 (42) 21 (42) 0.170 HL 25 (50) 24 (48) 32 (64) 33 (66) 34 (68) 0.117 Smoking 9 (18) 16 (32) 13 (26) 21 (42) 17 (34) 0.109 Drinking alcohol 0 (0) 5 (10) 4 (8) 8 (16) 3 (6) 0.051 Family history 15 (30) 7 (14) 7 (14) 16 (32) 12 (24) 0.081 ASA 3 (6) 6 (12) 5 (10) 4 (8) 11 (22) 0.209 ACE inb 7 (14) 6 (12) 5 (10) 4 (8) 4 (8) 0.889 ARB 5 (10) 2 (4) 5 (10) 6 (12) 7 (14) 0.613 Statin 5 (10) 6 (12) 11 (22) 11 (22) 7 (14) 0.313 OAD 5 (10) 3 (6) 5 (10) 11 (22) 5 (10) 0.140 Insulin 3 (6) 1 (2) 1 (2) 1 (2) 7 (14) 0.078
Data are expressed as n (%) or mean±standard deviation. HT: hypertension, DM: diabetes mellitus, HL: hyperlipidemia, ASA: acetylsalicylic acid, ACE inb: angiotensin converting enzyme inhibitor, ARB: angiotensin receptor blocker, OAD: oral anti-diabetic
Table 3. Distribution of ECG findings among the groups Group 1
(n=50) Group 2 (n=50) Group 3 (n=50) Group 4 (n=50) Group 5 (n=50) p
Pmax 110.2±7.28 116.4±5.98 118.1±6.13 121.3±15.41 134.1±10.13 <0.001* Pmin 80.10±4.34 83.40±7.98 80.90±6.75 80.30±13.41 83.9±8.16 0.075 PWD 30.10±6.50 33.20±5.86 38.00±6.92 41.00±6.92 49.80±6.54 <0.001* QTmax 399.10±22.37 403.0±19.71 403.7±25.84 414.8±28.01 414.1±25.06 <0.001* QTmin 366.5±20.60 369.2±19.38 362.4±22.81 369.8±26.76 361.5±22.22 0.325 QTd 32.54±5.21 33.80±8.60 41.30±12.88 45.00±11.64 52.60±15.22 <0.001* QTcmax 429.6±22.31 423.3±24.91 427.2±20.46 438.8±22.99 447.6±30.15 <0.001* QTcmin 395.9±20.26 385.7±24.91 386.1±18.05 391.8±20.65 388.4±28.81 0.101 QTcd 33.68±4.23 36.78±11.89 41.42±16.16 47.18±15.71 59.12±23.64 <0.001* QTdR 3.02±0.65 3.68±1.00 4.58±1.20 5.02±1.37 6.23±1.82 <0.001*
*All of the p values were <0.05 on comparison of these parameters among the groups. Pmax: maximum p wave interval, Pmin: minimum p wave interval, PWD: P wave dispersion, QTmax: maximum QT interval, QTmin: minimum QT interval, QTd: QT dispersion, QTcmax: corrected QT maximum interval, QTcmin: corrected QTc minimum interval, QTcd: corrected QT dispersion, QTdR: QT dispersion ratio
Table 2. Distribution of the groups according to the laboratory and clinical characteristics Group 1
(n=50) Group 2(n=50) Group 3(n=50) Group 4(n=50) Group 5(n=50) p
FBG (mg/dL) 109.5±41.8 105.3±22.4 118.9±39.9 116.4±32.60 121.4±31.8 0.059 HbA1c (%) 5.6±1.1 5.7±0.3 6.1±1.2 5.9±0.9 6.2±1.1 0.051 Total cholesterol (mg/dL) 208.8±46.1 216.3±32.2 195.6±49.14 206.1±43.81 214.1±54.10 0.177 LDL-C (mg/dL) 137.7±40.3 142.9±32.6 126.9±40.07 139.4±39.93 145.8±50.07 0.188 HDL-C (mg/dL) 45.9±9.8 46.2±11.1 42.4±9.8 44.2±6.7 45.1±10.6 0.118 Triglyceride (mg/dL) 163.4±82.2 167.4±94.7 160.6±122.1 171.4±88.65 146.5±62.61 0.713 BUN (mg/dL) 14.7±4.4 16.2±5.1 15.6±3.5 16.1±4.1 16.1±4.1 0.400 Creatinine (mg/dL) 0.7±0.6 0.8±0.4 0.9±0.3 0.8±0.5 0.9±0.4 0.101 AST (U/L) 16.9±5.1 20.2±7.2 21.2±8.4 21.8±13.2 20.6±11.9 0.192 ALT (U/L) 18.3±6.9 24.7±12.2 26.2±21.5 23.6±22.1 22.3±10.1 0.130 Na+ (mmol/L) 141.2±1.7 140.7±1.8 140.5±1.9 140.6±2.9 140.3±2.3 0.114 K+ (mmol/L) 4.2±0.4 4.3±0.5 4.5±0.5 4.5±0.4 4.6±0.4 0.326 Hb (g/dL) 14.4±1.3 14.5±1.7 14.2±1.4 13.9±1.6 14.1±1.9 0.299 Hct (%) 41.6±3.8 42.1±4.5 41.5±3.7 40.7±3.8 41.3±3.4 0.156 MPV (fL) 9.7±0.7 9.8±0.9 10.2±0.7 9.9±0.8 10.2±0.8 0.100 LVH 5 (10) 11 (22) 7 (14) 7 (14) 14 (28) 0.127 LA (cm) 3.85±0.27 3.81±0.19 3.82±0.21 3.88±0.17 3.90±0.25 0.179 RA (cm) 3.48±0.29 3.49±0.17 3.48±0.27 3.53±0.17 3.58±0.22 0.119 LVEDD (cm) 4.93±0.21 4.98±0.33 4.97±0.25 5.00±0.23 5.02±0.29 0.438 LVESD (cm) 3.32±0.24 3.36±0.33 3.32±0.32 3.38±0.27 3.44±0.26 0.188 EF (%) 59.5±3.1 59.2±4.3 59.9±3.3 58.4±3.4 58.6±3.3 0.197 Gensini score 0.00±0.00 6.82±5.59 28.52±20.46 55.80±30.46 86.46±40.32 <0.001*
*All of the p values were <0.001 on comparison of Gensini score among the groups. FBG: fasting blood glucose, HbA1c: glycated hemoglobin A1c, LDL-C: low density lipoprotein cholesterol , HDL-C: high density lipoprotein cholesterol , BUN: blood urea nitrogen, AST: aspartat aminotransferase, ALT: alanine aminotransferase, Na: sodium, K: potassium, Hb: hemoglobin, Hct: hematocrit, MPV: mean platelet volume, LVH: left ventricular hypertrophy, LA: left atrium, RA: right atrium, LVEDD: left ventricular end-diastolic dimension, LVESD: left ventricular end-systolic dimension, EF: ejection fraction
of the patients. When echocardiography findings were compared, it was observed that left atrial dimension, right atrial dimension, left ventricular end-diastolic dimension, and left ventricular end-systolic
dimension did not differ among the groups. Gensini score was found to be the lowest in Group 1 and the highest in Group 5 (p<0.001).
Table 3 presents ECG findings of the patients. Group 1 had the lowest Pmax and PWD, while Group 5 had the highest values of these parameters (p<0.001 and p<0.001, respectively). QTmax and QTd were lowest in Group 1 (p=0.003 and p<0.001, respectively). QTcmax was lowest in Group 2 (p<0.001). QTcd and QTdR were lowest in Group 1, while these values were highest in Group 5 (p<0.001 and p<0.001, respectively). There were no differences among the groups in terms of Pmin, QTmin, and QTcmin intervals.
There were positive correlations between Gensini score and QTmax (r=0.239, p<0.001), QTd (r=0.421, p<0.001), QTcmax (r=0.263, p<0.001), QTcd (r=0.387, p<0.001), QTdR (r=0.467, p<0.001), Pmax (r=0.582, p<0.001), and PWD (r=0.656, p<0.001). In Table 4, the correlations between Gensini score and ECG findings of the patients are presented.
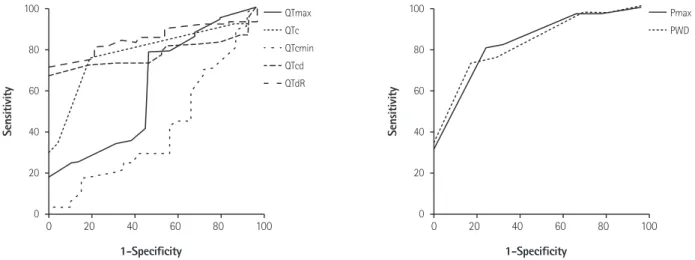
It was observed that the best ECG parameter that differentiated group 1 and group 2 from the groups with significant stenosis was QTdR (AUC 0.846, p<0.001) (Table 5 and Fig. 1). QTdR was also the parameter that differentiated a coronary artery with <50% narrowing from a coronary artery with ≥50% narrowing (AUC 0.858, p<0.001) (Table 6 and Fig. 2).
Table 4. Correlation of ECG findings of the patients with Gensini scores Gensini score r p QTmax 0.239 <0.001 QTmin 0.015 0.062 QTd 0.421 <0.001 QTcmax 0.263 <0.001 QTcmin -0.005 0.059 QTcd 0.387 <0.001 QTdR 0.467 <0.001 Pmax 0.582 <0.001 Pmin 0.116 0.112 PWD 0.656 <0.001
ECG: electrocardiography, QTmax: maximum QT interval, QTmin: minimum QT interval, QTd: QT dispersion, QTcmax: corrected QT maximum interval, QTcmin: corrected QTc minimum interval, QTcd: corrected QT dispersion, QTdR: QT dispersion ratio, Pmax: maximum p wave interval, Pmin: minimum p wave interval, PWD: P wave dispersion
Table 5. Cut-off, sensitivity, specificity, AUC, and p values of ECG parameters that distinguish Group 1 and Group 2 from Groups 3, 4 and 5
Cut-off Sensitivity Specificity AUC p
QTmax 397.5 78 52 0.603 0.024 QTd 37.5 75 80 0.777 <0.001 QTcmin 390.5 42 42 0.396 0.023 QTcd 37.5 71.5 82 0.768 <0.001 QTdR 3.82 80.5 78 0.846 <0.001 Pmax 117.5 79.5 74 0.818 <0.001 PWD 32.5 75 70 0.817 <0.001
AUC: area under the receiver operating characteristic curve, ECG: electrocardiography, QTmax: maximum QT interval, QTd: QT dispersion, QTcmin: corrected QTc minimum interval, QTcd: corrected QT dispersion, QTdR: QT dispersion ratio, Pmax: maximum p wave interval, PWD: P wave dispersion
Table 6. Cut-off, sensitivity, specificity, AUC, and p of ECG parameters that distinguish a coronary artery with <50% narrowing from a coronary artery with ≥50% narrowing
Cut-off Sensitivity Specificity AUC p
QTmax 397.5 80.7 41 0.604 0.005 QTd 37.5 82 63 0.810 <0.001 QTcmax 426.5 63.3 54 0.613 0.002 QTcd 37.5 78 65 0.756 <0.001 QTdR 4.025 78 70 0.858 <0.001 Pmax 117.5 84 54 0.780 <0.001 PWD 37.5 84 72 0.851 <0.001
AUC: area under the receiver operating characteristic curve, ECG: electrocardiography, QTmax: maximum QT interval, QTd: QT dispersion, QTcmax: corrected QT maximum interval, QTcd: corrected QT dispersion, QTdR: QT dispersion ratio, Pmax: maximum p wave interval, PWD: P wave dispersion
Discussion
In our study, we identified that ECG parameters including PWD, Pmax, QTd, QTcd, QTdR had significant correlations with Gensini score.It was found that as the severity of the CAD increased in stable angina pectoris patients with preserved left ventricular function, a positive correlation with Pmax, PWD, QTmax, QTd, QTcd, QTcmax, QTdR was detected. It was shown that the best ECG parameter that enabled differentiation between Group 1 and Group 2 and groups with significant stenosis (Group 3, 4 and 5) was QTdR. QTdR was also the best parameter that differentiated coronary arteries with <50% narrowing from the coronary arteries with ≥50% narrowing. Sudden cardiac death and severe arrhythmia are the most
important precursors of cardiovascular risk among the patients with CAD. Prospective studies demonstrated that sudden cardiac death occurred within the first hour of initial symptoms, and it was the first sign in more than 25-30% of the CAD patients.14)15) Left
ventricular dysfunction that occurs due to ischemic heart disease and ventricular arrhythmias are mostly blamed for mortality.16-18)
It is known that CAD is an independent risk factor for atrial fibrillation (AF). AF is more commonly seen during acute coronary events and in patients with stable coronary artery disease compared to the normal population. PWD and Pmax indicate intra-atrial conduction heterogeneity and elongation of PWD and Pmax is clinically associated with increased AF prevalence.3) Non-invasive
early diagnosis of AF prevents many unwanted complications in 100 80 60 40 20 0 0 20 40 60 80 100 1-Specificity Sensitivity QTmax QTc QTcmin QTcd QTdR 100 80 60 40 20 0 0 20 40 60 80 100 1-Specificity Sensitivity Pmax PWD
Fig. 1. ROC Curve of electrocardiographic parameters that distinguished normal coronary from non-critical and significant stenosis groups. QTmax: maximum QT interval, QTd: QT dispersion, QTcmax: corrected QT maximum interval, QTcd: corrected QT dispersion, QTdR: QT dispersion ratio, Pmax: maximum p wave interval, PWD: P wave dispersion.
100 80 60 40 20 0 0 20 40 60 80 100 1-Specificity Sensitivity QTmax QTc QTcmin QTcd QTdR 100 80 60 40 20 0 0 20 40 60 80 100 1-Specificity Sensitivity Pmax PWD
Fig. 2. ROC Curve of electrocardiographic parameters that distinguished coronary arteries with <50% narrowing from the ones with ≥50% narrowing. QTc: corrected QT, QTmax: maximum QT interval, QTcmax: corrected QT maximum interval, QTcd: corrected QT dispersion, QTdR: QT dispersion ratio, Pmax: maximum p wave interval, PWD: P wave dispersion.
patients with CAD. In the current study, the lowest PWD and Pmax values were detected in Group 1, while the highest values were seen in Group 5. The Gensini score is directly proportional to the extent of coronary artery disease, and this supports our findings which showed a positive correlation between Gensini score and Pmax and PWD.
After the introduction of the definition of asynchronism of ventricular repolarization as heterogeneity of the QT interval by Day et al.4) for the first time, QTd was used clinically. Kautzner and
Malik19) demonstrated that QTd alone was more correlated with
ventricular arrhythmia risk than QT interval. Elongated QTd is an indicator of high risk for severe cardiac arrhythmia and sudden cardiac death.20)21) QTd is a parameter that can predict sudden
cardiac death risk even among the healthy individuals.22) Besides,
QTdR, which was defined as QT dispersion divided by cardiac cycle length, was demonstrated to be a more valuable parameter than QTd in predicting ventricular arrhythmia.6) Akyuz et al.23) found
that impaired and heterogeneous electrical activity caused by myocardial ischemia in ventricles may increase the cQTd and QTdR values among the patients with CAD. Repolarization impairments due to ischemia and regional fibrosis caused by chronic ischemia may be the reasons for increased ECG parameters detected in patients with CAD.24) Zareba et al.25) pointed out that QTd increased
in patients with CAD and it was an independent risk factor for arrhythmic cardiac deaths. Likewise, the study by Batur et al.26)
reported a similar result. Although Lowe et al.27) found that the QTd
interval was longer in patients with three vessel disease, they could not find a correlation between the number of affected vessels and QTd. However, the study by Sporton et al.28) reported that there
was a correlation between the number of coronary lesions and QTd interval. In the current study, there was a positive correlation between the presence and severity of CAD and QTmax, QTd, QTcmax, QTcd, and QTdR variables.
Study limitations
Although our study provided some invaluable findings, it has some limitations. The limitations of our study were that it was conducted in a small number of patients, it was designed as a cross-sectional study, and patients were not followed up in the long run.
Conclusion
In conclusion, our data demonstrated that QTdR was the best ECG parameter to differentiate patients with normal coronary arteries and non-critical coronary lesions from patients with significant stenosis. It was also observed that QTdR was the best ECG parameter to distinguish coronary arterial narrowing lesser
than 50% from stenosis greater than 50%. Apart from the proved ability of PWD, Pmax, QTd, QTcd, QTdR parameters in predicting arrhythmia, we can conclude that these parameters may be used as non-invasive screening tools in patients who need advanced cardiac testing for CAD.
References
1. Napoli C, Glass CK, Witztum JL, Deutsch R, D’Armiento FP, Palinski W. Influence of maternal hypercholesterolemia during pregnancy on progression of early atherosclerotic lesions in childhood: Fate of Early Lesions in Children (FELIC) study. Lancet 1999;354:1234-41. 2. Task Force Members, Montalescot G, Sechtem U, et al. 2013 ESC
guidelines on the management of stable coronary artery disease: the Task Force on the management of stable coronary artery disease of the European Society of Cardiology. Eur Heart J 2013;34:2949-3003. 3. Dilaveris PE, Gialafos EJ, Sideris SK, et al. Simple electrocardiographic
markers for the prediction of paroxysmal idiopathic atrial fibrillation.
Am Heart J 1998;135(5 Pt 1):733-38.
4. Day CP, McComb LM, Campbell RW. QT dispersion: an indication of arrhythmia risk in patients with long QT intervals. Br Heart J 1990;63:342-4.
5. Savelieva I, Camm AJ, Malik M. Gender-specific differences on QT dispersion measured in 1100 healthy subjects. (abstr). PACE 1999;22:885. 6. Higham PD, Furniss SS, Campbell RW. QT dispersion and components
of the QT interval in ischemia and infarction. Br Heart J 1995;73:32-6. 7. Glancy JM, Garrat CJ, de Bono DP. Dynamics of QT dispersion during
myocardial infarction and ischemia. Int J Cardiol 1996;57:55-60. 8. Sporton SC, Taggart P, Sutton PM, Walker JM, Hardman SM. Acute
ischemia: a dynamic influence on QT dispersion. Lancet 1997;349:306-9. 9. Beaubien ER, Pylypchuk GB, Akhtar J, Biem HJ. Value of corrected QT
interval dispersion in identifying patients initiating dialysis at increased risk of total and cardiovascular mortality. Am J Kidney Dis 2002;39:834-42.
10. Naas AA, Davidson NC, Thompson C, et al. QT and QTc dispersion are accurate predictors of cardiac death in newly diagnosed non-insulin-dependent diabetes: cohort study. BMJ 1998;316:745-6. 11. Malik M, Batchvarov VN. Measurement, interpretation, and clinical
potential of QT dispersion. J Am Coll Cardiol 2000;36:1749-66. 12. Emond M, Mock MB, Davis KB, et al. Long-term survival of medically
treated patients in the Coronary Artery Surgery Study (CASS) registry.
Circulation 1994;90:2645-57.
13. Gensini GG. A more meaningful scoring system for determining the severity of coronary heart disease. Am J Cardiol 1983;51:606. 14. Tunstall-Pedoe H, Kuulasmaa K, Amouyel P, Arveiler D, Rajakangas
Health Organization MONICA Project. Registration procedures, event rates, and case-fatality rates in 38 populations from 21 countries in four continents. Circulation 1994;90:583-612.
15. Kannel WB, Doyle JT, McNamara PM, Quickenton P, Gordon T. Precursors of sudden coronary death. Factors related to the incidence of sudden death. Circulation 1975;51:606-13.
16. Risk stratification and survival after myocardial infarction. N Engl J
Med 1983;309:331-6.
17. Sanz G, Castañer A, Betriv A, et al. Determinants of prognosis in survivors of myocardial infarction: a prospective clinical angiographic study. N Engl J Med 1982;306:1065-70.
18. Hull SS Jr, Evans AR, Vanoli E, et al. Heart rate variability before and after myocardial infarction in conscious dogs at high and low risk of sudden death. J Am Coll Cardiol 1990;16:978-85.
19. Kautzner J, Malik M. QT interval dispersion and its clinical utility.
Pacing Clin Electrophysiol 1997;20:2625-40.
20. Day CP, McComb JM, Campell RW. QT dispersion: an indication of arrhytmia risk in patients with long QT intervals. Br Heart J 1990;63:342-4. 21. Day CP, McComb JM, Campell RW. QT dispersion in sinus beats and
ventricular extrasystoles in normal hearts. Br Heart J 1992;67:39-41. 22. Elming H, Holm E, JunL, et al. The prognostic value of the QT interval and
QT interval dispersion in all-cause and cardiac mortality and morbidity in a population of Danish citizens. Eur Heart J 1998;19:1391-400. 23. Akyuz A, Alpsoy S, Akkoyun DC, Degirmenci H, Guler N. Maximal
exercise-corrected QT as a predictor of coronary artery disease: comparison of simpler heart rate corrections. Korean Circ J 2013;43:655-63.
24. Elsässer A, Schlepper M, Klövekorn WP, et al. Hibernating myocardium: an incomplete adaptation to ischemia. Circulation 1997;96:2920-31. 25. Zareba W, Moss AJ, le Cessie S. Dispersion of ventricular
repolarization and arrhythmic death in coronary artery disease. Am J
Cardiol 1994;74:550-3.
26. Batur MK, Aksöyek S, Oto A, et al. Circadian variations of QTc dispersion: is it a clue to morning increase of sudden cardiac death? Clin Cardiol 1999;22:103-6.
27. Lowe MD, Rowland E, Grace AA. QT dispersion and triple vessel coronary disease. Lancet 1997;349:1175-6.
28. Sporton SC, Taggart P, Sutton PM, Walker JM, Hardman SM. Acute ischemia: a dynamic influence on QT dispersion. Lancet 1997;349:306-9.