TARIM BILIMLERI DERGISI 1998, 4 (2), 15-20
Effects of Various Fat Levels and Sources on Blood Cholosterol
Levels in Rabbits
B.Zehra SARIÇIÇEK1 Ali Vaiz GARIPOĞLU1 Ramazan AMANVERMEZ2 Geliş Tarihi : 02.12.1997
Abstract:In this research it was aimed to determine the effects of different fat sources (animal fat and vegetable oil) and different fat levels ( O `)/0, 2.5 °İ. and 5 %) on various blood parameters of rabbits. With this aim, 5 different group ( each of with male and female sub-groups) were established (Group 1= O % fat, grup 2=2.5 % vegetable oil (V0), group 3= 5 % vegetable oil, group 4= 2.5 % animal fat (AF), group 5= 5 % animal fat) and animals were allocated into these groups. At the end of the experiment, it was determined that blood parameters ( LDL-C, total cholesterol, phospolipid, HDL-C, tryglyceride, free cholesterol ) were influenced by different fat sources and levels at different manner and animal fats increased these blood parameters.
Key Words: Rabbit, LDL-C, HDL-C, triglycerides, phospolipid, total cholesterol, free choleste ı-ol, vegetable oil, animal fat.
Farkl
ı
Ya
ğ
Düzeyleri ve Kaynaklar
ı
n
ı
n Tav
ş
anlar
ı
n Kan Kolesterol Düzeyleri
Üzerindeki Etkileri
Özet: Bu çalışma farklı yağ kaynakları ( hayvansal yağ ve bitkisel yağ) ve düzeylerinin (% O, % 2.5 ve % 5) tavşanlarda çeşitli kan parametreleri üzerine olan etkilerinin belirlenmesi amacıyla yapılmıştır. Bu amaçla, herbirinde erkek ve dişi alt grupları bulunan 5 farklı grup oluşturulmuş ( Grup 1= % O yağ, grup 2= % 2.5 BY, grup 3= % 5 BY, grup 4= %2.5 HY, grup 5= %5 HY) ve hayvanlar bu gruplara dağıtılmıştır. Denemenin sonııcunda tavşan kanındaki parametrelerin ( LDL-C, total kolesterol, fosfolipid, HDL-C, trigliserid, serbest kolesterol) farkl ı yağ kaynakları ve seviyelerinden farklı düzeyde etkilendikleri ve hayvansal yağların bu parametreleri artırıcı yönde etki yaptıkları belirlenmiştir.
Anahtar Kelimeler : Tavşan, LDL-C, HDL-C, trigliserid, fosfolipid, toplam kolesterol, serbesi: kolesterol, bitkisel yağ, hayvansal yağ.
Introduction
It is known that there is a relationship between hearth diseases and plasma lipid levels. Despite the discrepancies about the effects of cholesterol and fatty acids consumptions on hearth diseases, it is generally recommended to decrease the cholesterol level and to increase the long chain unsaturated fatty acid levels in blood plasma.
Fats or oils incorporating in the rations can participate in cholestrol synthesis process or , in the contrary nnanner, can cause the cholesterol level to decrease. Total cholesterol level in blood (for humans) is nearly 180-240 mg/dl. Increase in blood cholesterol level (especially LDL-C level) is considered as a primary reason of plaques' formation which causes arteriosclerosis (Anonymous, 1993). Arteriosclerosis is a cardiovascular disease characterized with accumulation of lipid and connective tissue components at the internal layers of arteries (Bhagaron, 1992, Burtil and Ashwood, 1994). These lesions called as atorom can cause arteries
1 Ondokuz Mayıs Only. Ziraat Fak.- Samsun 2 Ondokuz Mayıs Üniv. Tıp Fak. - Samsun
to be constricted and engorged. The relationship between plasma cholesterol levet and arteriosclerosis has been proved by means of epidemicologial studies (Constantinider, 1984). There is an inverse proportion between arteriosclerosis and HDL-C level. On the contrary, there is a positive correlation between arteriosclerosis and destroyed catabolism Ashwood, 1994). Cholesterol is synthesised in various organs within body of chylomicrons and LDL-C (Burtil and or can be taken into the body with foods. As only a little part of the cholesterol in foods can be absorbed, it can't affect blood cholesterol level to a large extent.
Cholesterol is considered as an important preliminary factor in hypercholesterolomy and arteriosclerosis events (Anonymous, 1993).
Lipoproteins are conjugated proteins consisted of lipid components such as triglycerides, cholesterol and
16 TAR1M BiLİMLERİ DERGISI 1998, Cilt 4, Sayı 2
cholesterol esters, phospolipids and fatty acids (özen, 1994).
Lipoproteins act as a basic carrier in fat transportation. There are 5 lipoprotein types (Ensminger et al. 1990).
- Chylomicrons,
- Very Low Density Lipoproteins (VLDL), - Low Density Lipoproteins (LDL.), - High Density Lipoproteins (HDL), - Lipoprotein Small a = Lp (a).
LDL-C found in low density lipoproteins is considered as an important factor in hearth diseases. The normal level of LDL-C in human blood is below 130 mg/d1, LDL-C levels above 160 mg/dI were considered as an important contributor in hearth diseases.
HDL-C is a cholesterol type included in high density lipoproteins. This type of cholesterol prevent arteriosclerotic plaque occurring in aorta and the other arteries. The normal level of HDL-C in human blood ranges between 35-55 mg/dI (Anonymous, 1993).
Phospolipids are lipid compounds formed one- third of the lipids found in the serum. The normal level of phospolipids in human blood ranges from 180-320 mg/dl.
Tryglycerides are esters consisted of 3 mol fatty acid and 1 mol gliserol. Tryglycerides obtained from foods are transported in blood towards various tissues and fat cells by the chylomicrons and the other lipoproteins. The normal level of triglycerides in human blood is nearly 60- 170 mg/dl.
High polyunsaturated fatty acids are known to decrease the blood cholesterol level (Aksoy et al, 1981).
In a study, White New Zealand rabbits were fed with rations containing animal fat or vegetable oil at different levels ( O or 5%). While the animal fat supplementation increased total blood lipid concentration, neither animal fat supplementation, nor vegetable oil supplementation didn't affect the plasma cholesterol level (Flekete et al, 1990).
Ajuyah et al (1991), fed rations supplemented with animal fat or vegetable oil to Hubbard chickens (6 weeks aged) and observed that there were no significant differences between the groups consumed animal fats or vegetable oils in terms of total lipid and cholesterol levels in tissues.
Bergeron et al (1990, 1992> observed that total cholesterol and HDL-C levels in the blood of rabbits giyen rations rich in coconut oil (with high saturated fatty acid content) are superior to those in the blood of rabbits giyen rations rich corn oil (with high unsaturated fatly acid content) (P<0.05). In this study, couldn't be found a significant difference in terms of LDL-C content.
Tne most common method to create arteriosclerosis at experiment animals is to feed these animals with diets rich in cholesterol. It is reported that the rabbits are much sensitive to arteriosclerosis (Heinle and Liebich, 19Ei0).
Material and Method
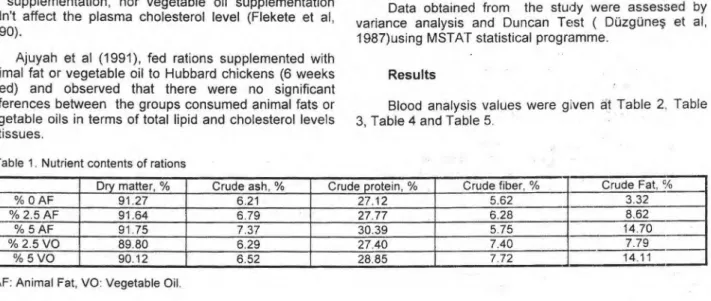
In this study, White New Zealand rabbits of initial liveweights ranging between 1700-1900 g were used. Nutrient contents of the experimental rations compcsed of corn, barley, hazelnut oil meal, bran, salt, minerals, vitamins, sunflower oil and tallow are shown at Table 1. Two fat sources (sunflower oil and tallow) and three levels (O, 2.5 and 5%) were tested in this study. With this aim, 5 different group (each of with male and female sub-groups) were established ( Group 1= O % fat, group 2= 2.5 °/0 animal fat, group 3= 5 % animal fat, group 4= 2.5 % vegetable oil, group 5= 5 °A vegetable oil) and rabbits were allocated into these groups. Average liveweight gains of the groups at feeding period were at table 4. The nutrient contents of rations were determined at the Feed and Animal Nutrition Laboratory as indicated by Akyıldız (1984).
Free cholesterol, HDL-C, LDL-C, tryglyceride, total cholesterol, phospolipid analyses were made at blood samples obtained from 3 male and 3 female of each group according to Trinder method by means of specific enzymatic kits at Biochemistry Laboratory of Medicine Faculty (Trinder, 1969). Rabbits were fasted 18 hours before taking blood samples. Duration of the trial was 60 days. Blood samples were taken on 30th (1st period) and on 60th days (2nd period) of the trial.
Data obtained from the study were assessed by variance analysis and Duncan Test ( Düzgüneş et al, 1987)using MSTAT statistical progri3mme.
Results
Blood analysis values were giyen at Table 2. Table 3, Table 4 and Table 5.
Table 1. Nutrient contents of rations
Dry matter, % Crude ash, % Crude protein, % Crude fiber, % Crude Fat, 94
°A3 O AF 91.27 6.21 _ 27.12 5.62 3.32
% 2.5 AF 91.64 - 6.79 27.77 6.28 8.62
% 5 A F 91.75 7.37 30.39 5.75 14.70
% 2.5 VO 89.80 6.29 27.40 7.40 7.79
% 5 VO 90.12 6.52 28.85 7.72 14.11
SARIÇİÇEK, Z. ve ark. "Effects of various fat levels and sources on biood cholosteroi levels in rabbits" 1 7
Table.2. 1st Period male-female mixed blood analysis results*mg/d1.
Parameters O
% AF
_
2.5%
AF 5 % AF 2.5°Z
VO 5%
VO LDL-C 82.05±6.12 109.90±15.36 127.08±16.40 79.16±7.08 62.45±4.65 bc ab a bc c Totai Cholesterol 121.28±7.93 162.12±15.41 205.08±16.27 118.55±12.00 104.97±6.26 bc ab a bc: c Phospolipid 157.33±7.64 209.33±8.00 240.00±15.55 179.50±5.38 167.83±17.49 c ab a bc: bc HDL-C 24.82±1.37 33.38±2.47 41.56±1.61 37.66±2.14 27.16±2.16 a a a a a Triglyceride 82.72±11.67 92.98±4.08 104 10±6.36 67.983:3.22 73.15±7.36 ab ab a b ab Free Cholesterol 29.96±1.95 30.65±1.22 39.75±2.47 27.66±1.71 26.71±2.01 b b a b b"Means within rows with no common subscripts differ significantly (P<0.05).
Table.3. Period male-female mixed blood analysis results*mg/d1.
Parameters O
% AF
2.5 % AF 5%
AF 2.5%
VO 5%
VO LDL-C 89.67±8.05 -' 77.20±6.39 95.32±7.13 51.93±3.96 47.73±3.72 a_
a a b b Total Cholesterol 139.15±9.18 132.46±6.64 155.26t8.67 91.40d:8.04 85.33±5.62 a a a b b Phospolipid 176.83±12 78 212.00±8.35 244.83±17.91 133.66=13.97 134.83±15.22 b ab a c c HDL-C 31.52±2.69_
39.30±1.80 39.67±2.34 27.55:::4.33 23.47±2.03 b a_
a be c Triglyceride 87.90±10.25 79.17±4.74 100.550±7.87 62.88=4.12 70.23±6.92 ab abc a c bc Free CholesteroI 28.43±2.29 26.50±1.23 28.75±2.26 20.16=1.68 19.08±1.48 a a a a a"Means within rows with no common subscripts differ significantly (P<0.05).
Discussion
There were no significant differences among groups except male subgroups of 2'd and 3rd groups in terms of liveweight gains (P> 0.05). Differences between these two groups and the other groups with respect to liveweight gains were not enough to affect the blood analysis results. Kurowska et al. (1994) stated that observed changes in body weights were not responsible from observed differences in serum parameter concentrations.
The results mentioned below can be drawn from the Table 2. 3rd group is superior to other groups except 2nd
group in terms of LDL-C values (P<0.05). While the differences between 1st, 4th and 5th groups were found insignificant (P>0.05), 5th group is different from 2nd and 3rd groups at significant level (P<0.05). These findings indicate a considerable difference between AF groups and VO groups in terms of LDL-C content.
Total cholesterol levet was higher in 3rd group than those of the other groups except 2nd group (P<0.05). There were no significant differences between 1 st, 2nd and 4th groups (P>0.05). The groups consumed AF are superior to VO groups with respect to this parameter.
Although no differences were seen between groups in terms of HDL-C content (P>0.05) 3rd group is numerically higher than the other groups.
While tryglyceride content was found bighest at 3rd
group, the lowest tryglyceride content was at 4th group. There was a significant difference between 3rd group and 4th group (P<0.05).
The 3rd group is different from the other groups in terms of free cholesterol content (P<O,C5) and the differences among the other groups were found insignificant (P<0.05).
The 2nd period blood analysis results were giyen at Table 3.
From the Table 3 it can be seen that there is a clear difference between AF groups and VO groups in favour of AF groups in terms of LDL-C, total cholesterol and phospolipid contents (p<0.05).
HDL-C contents at AF groups are higher than those of VO groups (P<0.05).
18 TARIM BILIMLERI DERGISI 1998, Cilt 4, Sayi 2
Tryglyceride content in 3rd group is higher than those of 4th and 5th groups (P<0.05).
There are no signifıcant differences between AF groups and VO groups in terms of free cholesterol content (P>0.05).
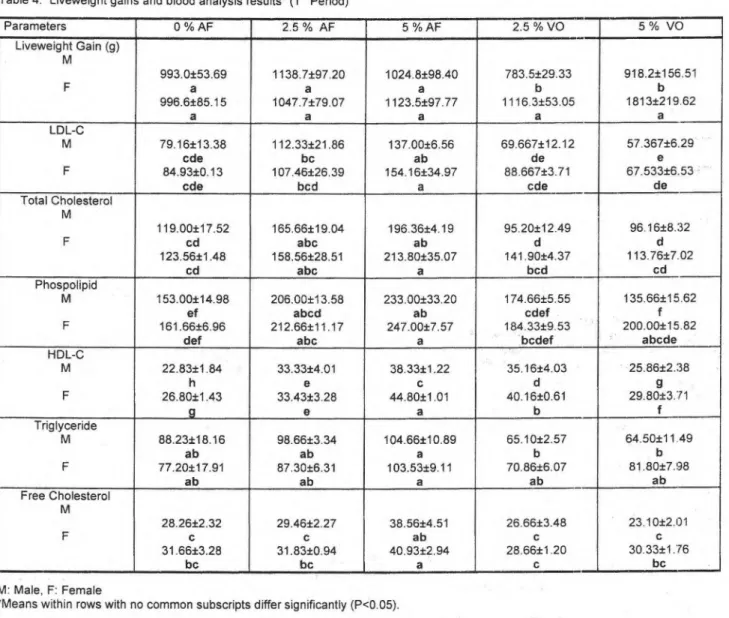
The blood analysis results related to lst period are giyen at Table 4. With respect to LDL-C contents, 2nd and 3rd male groups are superior to 4th and 5th male groups (P<0.05). female group is higher than the other female groups (P<0.05). There were no significant differences among the other female groups (P>0.05).
Total cholesterol levels are higher in AF male subgroups than the VO male subgroups (P< 0.05). The female subgroups of 2"s1 and 3rd groups are higher than the female subgroups of 4th and 5th groups with respect to total cholesterol levels (P< 0.05).
While no significant differences could be found between VO and AF groups in females in terms of tryglyceride levels (P>0.05), the male AF groups are higher than male VO groups (P<O.C5).
Free cholesterol levels in 3rd male and 3rd female groups are higher than the other groups (P<0.05) and the other groups are not different from each other (P>0 05).
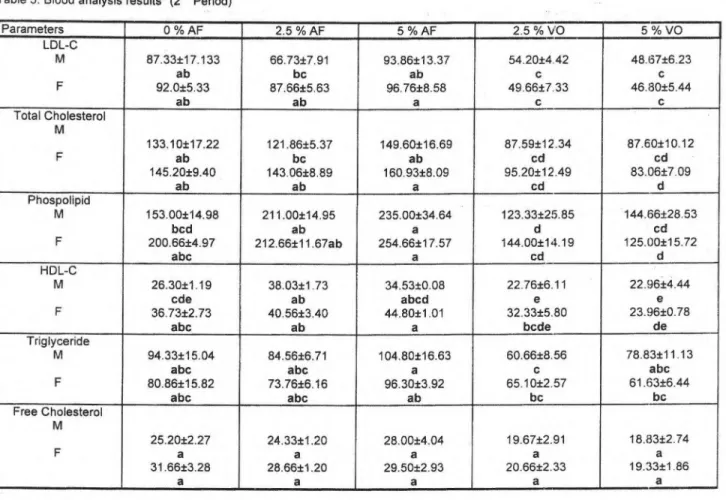
The conclusions related to 2"(1 period can be drawn from the Table 5 as mentioned below.
LDL-C contents in AF groups (male and female) are higher than those in VO groups (male and female) (P<0.05).
Total cholesterol, phospolipıci and HDL-C contents are higher in AF groups (male and female) than VO groups (male and female) (P<0.05)
Table 4. Liveweight gains and blood analysis results* (1st Period)
Parameters O % AF 2.5 °İ. AF 5 % AF 2.5 % VO 5 % VO Liveweight Gain (g) M 993.0±53.69 1138.7±97.20 1024.8±98.40 783.5±29.33 918.2±156.51 F a a a b b 996.6±85.15 1047.7±79.07 1123.5±97.77 1116.3±53.05 1813±219.62 a a a a a LDL-C M 79.16±13.38 112.33±21.86 137.00±6.56 69.667±12.12 57.367±6.29 cde bc ab de e F 84.93±0.13 107.46±26.39 154.16±34.97 88.667±3.71 67.533±6.53 ' cde bcd a cde de Total Cholesterol M 119.00±17.52 165.66±19.04 196.36±4.19 95.20±12.49 96.16±8.:32 F cd abc ab d d 123.56±1.48 158.56±28.51 213.80±35.07 141.90±4.37 113.76±7.02 cd abc a bcd cd Phospolipid M 153.0%14.98 206.00±13.58 233.00±33.20 174.66±5.55 135.66±15.62 ef abcd ab cdef f F 161.66±6.96 212.66±11.17 247.00±7.57 184.33±9.53 200.00±15.82
def abc a bcdef abcde
HDL-C M 22.83±1.84 33.33±4.01 38.33±1.22 35.16±4.03 25.86±2.38 h e c d 9 F 26.80±1.43 33.43±3.28 44.80±1.01 40.16±0.61 29.80±3.71 9 e a b f Triglyceride M 88.23±18.16 98.66±3.34 104.66t 10.89 65.10±2.57 64.50±11.49 ab ab a b b F 77.20±17.91 87.30±6.31 103.53±9.11 70.86±6.07 81.80±7.98 ab ab a ab ab Free Cholesterol M 28.26±2.32 29.46±2.27 38.56±4.51 26.66±3.48 23.10±2.01 F c c ab c c 31.66±3.28 31.83±0.94 40.93±2.94 28.66±1.20 30.33±1 .76 bc bc a c bc
m:
Male, F: FemaleSARIÇIÇEK, Z.. ve ark. "Effects of various fat levels and sources on blood cholosterol levels in rabbits" 1 9
Table 5. Blood analysis results* (2nd Period)
Parameters O % AF 2.5 % AF 5 %AF 2 5 % VO 5 % VO LDL-C M 87.33±17.133 66.73±7.91 93.86±13.37 54.20±4.42 48.67±6.23 ab bc ab c c F 92.0±5.33 87.66±5.63 96.76±8.58 49.66±7.33 46.80±5.44 ab ab a c c Total Cholesterol M 133.10±17.22 121.86±5.37 149.60±16.69 87.59±12.34 87.60±10.12 F ab bc ab cd cd 145.20±9.40 143.06±8.89 160.93±8.09 95.20±12.49 83.06±7.09 ab ab a cd d Phospolipid M 153.00±14.98 211.00±14.95 235.00±34.64 123.33±25.85 144.66±28.53 bcd ab a d cd F 200.66±4.97 212.66±11.67ab 254.66±17.57 144.00±14.19 125.00±15.72 abc a cd d HDL-C M 26.30±1.19 38.03±1.73 34.53±0.08 22.76±6.11 22.96±4.44 cde ab abcd e e F 36.73±2.73 40.56±3.40 44.80±1.01 32.33±5.80 23.96±0.78 abc ab a bcde de Triglyceride M 94.33±15.04 84.56±6.71 104.80±16.63 60.66±8.56 78.83±11.13
abc abc a c abc
F 80.86±15.82 73.76±6.16 96.30±3.92 65.10±2.57 61.63±6.44 abc abc ab bc bc Free Cholesterol M 25.20±2.27 24.33±1.20 28.00±4.04 19.67±2.91 18.83±2.74 F a a a a a 31.66±3.28 28.66±1.20 29.50±2.93 20.66±2.33 19.33±1.86 a a a a a M: Male, F: Female
*Means within rows with no common subscripts differ significantly (P<0.05).
There are no significant differences among AF groups and VO groups in females in terms of trygliceride contents (P>0.05). In males, there are no significant differences among the groups except between 3ra and 4th groups (P>0.05).
The differences among the AF and VO groups (male and female) in terms of free cholesterol contents are not significant (P>0.05).
Results from our study demonstrate that different lipid sources (animal fat and vegetable oil) and different lipid levels (O, 2.5 and 5%) are involved in the change in blood lipid profile. AF groups (male and female) scored higher blood lipid parameters than VO groups (male and female). This phenomenon is valid especially for LDL-C, total cholesterol and phospolipid levels. These results are in agreement with some sources (Aksoy et al. 1981, Bergeron et al. 1990), and are in disagreement with other sources (Flekete et al. 1990, Ajuyah et al. 1991).
References
Ajuyah, A.O., Lee, K.H., Hardin, R.T., Sim, J.S., 1991. influence of Dietary Full-fat Seeds and Oils on Total Lipid Cholesterol and Fatty acid Composition of Broiler
Meats. Journal of animai Science, 71 (4) 1011-1019.
Akyıldız, A.R., 1984. Yemler Bilgisi Laboratuvar Kılavuzu. A.U. Zir. Fak. Yay:895, Uygu. Kil. 213, Ankara
Aksoy, A., Haşimoğlu, S., Çakır., A., 1981. Besin Maddeleri ve
Hayvan Besleme. A.Ü. Zir. Fak. Yay.256. Erzurum.
Anonymous, 1993. Medicana Sağlık Ansiklopedisi, Ana Yayıncılık A.Ş. Istanbul.
Bergeron, N., Deshales, Y., Lavigne, C., Jacqııes, H., 1990. Interaction Between Dietary Proteins and Lipids in the
Regulation of Serum arıd Liver Lipids in the rabbit.
20 TARIM BILIMLERI DERGISI 1998. Cilt 4, Sayı 2
Bergeron, N., Deshales, Y. , Jacques, H., 1992. Factorial
Experiment to determine Influence of Fish protein and Fish Oil on Serum and Liver Lipids in Rabbits. Nutrition
Vol.8, No.5, September/October 1992.
Bhagaron, N.V., 1992. Medical Biochemistry. Jones and Borthett Publishers Inc. (London), pp: 420-57.
Burtil, A.C., Ashwood, E.R., 1994. Tietz Textbook of " Clinical
Chemistry (2"d Edition). W.B. Saunders Company, pp:
1002-58.
Constantinider, P., 1984. Arteriosclerosis- A General Survey
and Synthesis. Surv. Synth., 3: 477-98.
Düzgüneş, O., Kesici, T., Kavuncu, 0.,Gürbüz, F. 1987.
Araştırma ve deneme Metodları (istatistik Metodları-2).
Ank. ()oh/. Z.r. Fak. Yay. 1021, Ders Kitabı: 295, Ankara Ensminger, M.E., Oldfield, C.E., Heineman, W.W., 1990. Feeds
and Nutrition (Second Edition). The Ensminger Publishing
Company, Clavis, California.
Flekete, S., Hullar, I., Febel, H., Bokar,J., 1990. Effect of Animal
Fat and Vegetable Oil Supplemantion ıf Feeds of
Different Energy Concentration Upon the Digestibility of Nutrients and Some Blood Parameters in Rabbits.
Nutr. Abst. and Reviews (Sedes B), 1991, Vol:61, No:10 (539).
Heinle, H., Liebich, H., 1980. The lıfluence of Diet-induced Hypercholesterolemia on The Degree of Oxidation of Glutathione in Rabbit Aorta Arteriosclerosis. 37: 637-
640.
Kurowska, E.M., Carroll, K.K.,1994. Hypercholesterolomic Responses in Rabbits to Selected Groups of Dietary Essential Amino Acids. Nutr. 124: 364-370.
Özen, N., 1994. Hayvan Biyokimyasl. Akdeniz On Yay. Antalya.