• Sonuç bulunamadı

Evaluation of Polycystic Ovary Syndrome Patients with Strain Echocardiography

N/A
N/A
Protected

Academic year: 2021

Share "Evaluation of Polycystic Ovary Syndrome Patients with Strain Echocardiography"

Copied!
6
0
0

Yükleniyor.... (view fulltext now)

Tam metin

(1)

Introduction

Polycystic Ovary Syndrome (PCOS) is a disorder of the reproductive system and is seen in 5 to 10% of the wom-en in reproductive ages (1). Its main features are hyper-androgenism both clinical or biochemical and/or chronic oligo-anovulation and/or ultrasonographic appearance of the polycystic ovaries (2).

There are many studies showing the relationship between PCOS and Cardiovascular Diseases (CVD). Insulin resis-tance, obesity, hypertension, hyperlipidemia, hypercoagu-lability, and endothelial dysfunction can be seen frequent-ly in PCOS patients along with increased cardiovascular risks (3). Previously published data show that coronary atherosclerosis and increased carotid intima-media thick-ness can be observed in PCOS (4).

The aim of our study was to determine the effects of met-abolic factors on myocardial functions in PCOS patients, by measuring the strain (S) and strain rate (SR) as means of quantification of myocardial functions, which were first described by Heimdal et al. to define the global and re-gional myocardial dysfunction (5), and to identify the pos-sible subclinical impairment of left ventricular myocardial function because of the metabolic components of PCOS.

Materials and Methods Study population

This study was carried out with 26 PCOS patients referred to the Obstetrics and Gynecology Clinic of Baskent Uni-versity Hospital between December 2008 and September 2009 and 23 healthy female volunteers as control group. The PCOS patients were diagnosed in accordance with 2003 Rotterdam criteria (2). There were neither menstrual cycle abnormalities nor hyperandrogenism in the control group both clinically and biochemically. Clinical symp-toms of hyperandrogenism were acne and/or hirsutism. A score higher than 7 based on the modified Ferriman-Gall-wey Scale was noted as hirsutism. Any disease other than PCOS including hypertension, diabetes, thyroid function abnormalities, Cushing syndrome, asthma, and other au-to-immune diseases, and all medical conditions which caused regular drug use were exclusion criteria for our study. All participants signed the informed consent before enrolling in our study.

A physical examination with a detailed anamnesis includ-ing body weight and height were performed in all partic-ipants. Body Mass Index (BMI) was determined as body weight (kilograms) divided by height (meters) squared. Abstract

Objectives: Polycystic Ovary Syndrome (PCOS) is characterized by several metabolic abnormalities that may lead to insulin resistance, diabetes, and atherosclerosis which are associated with chronic inflammatory processes and oxidative stress. Due to this fact PCOS patients are at increased risk of cardiovascular diseases. We used echocardiographic quantification tools to detect subclinical changes in myocardial functions.

Materials and Methods: Echocardiographic, hormonal and metabolic measurements were performed in twenty-six women with PCOS and twenty-three healthy volunteers. The age of the attendants ranged between 20 and 31 years. PCOS was diagnosed by using the Rotterdam criteria. We compared the myocardial functions of PCOS patients without any cardiovascular symptoms with healthy volunteers by using strain echocardiography.

Results: No differences were found between the two groups’ strain, strain rate and myocardial velocity measurements.

Conclusion: According to our study PCOS patients without any clinical cardiovascular symptoms have no impairment in myocardial functions. These results should be further confirmed in larger controlled studies.

Keywords:Polycystic Ovary Syndrome, Echocardiography, Myocardium

Evaluation of Polycystic Ovary Syndrome Patients with Strain

Echocardiography

Gamze Aslan1*, Recep Cagdas Aslan2, Leyla Elif Sade1, Ugur Bal1, Gogsen Onalan2, Hulusi Bulent Zeyneloglu2,

Esra Kuscu2, Haldun Muderrisoglu1

Open Access Original Article

International Journal of Women’s Health and Reproduction Sciences

Vol. 3, No. 1, January 2015, 25–30

Received 19 March 2014, Accepted 21 September 2014, Available online 4 October 2014

1Department of Cardiology, Baskent University, Turkey. 2Department of Obstetrics and Gynecology, Baskent University, Turkey.

*Corresponding Author: Gamze Aslan, Department of Cardiology, Baskent University, Turkey. Tel: +903122126868,

(2)

Laboratory measurements

The participants having a regular menstrual cycle gave their blood samples between third and seventh day of their cycle. The participants with irregular menstrual cy-cle gave their blood samples irrespective of their cycy-cle day. The blood samples of the participants were taken between 08:00-12:00 am, after 12 hours of fasting.

High sensitive C-reactive protein (hsCRP) was measured with a turbidimetric method by using an Abbott®

Archi-tect C8000 device. Total cholesterol, triglyceride, Low Density Lipoprotein (LDL), and High Density Lipoprotein (HDL) were measured with an enzymatic colorimetric method by using a Roche/Hitachi Modular PP (Roche Di-agnostics GmbH, Mannheim, Germany). Serum glucose levels were detected with hexokinase method by using a Roche/Hitachi Modular PP (Roche Diagnostics GmbH, Mannheim, Germany). Hemogram tests were performed after the anticoagulation with K3EDTA by using an Ab-bott Cell-Dyne® 3700 System (Abbott Diagnostics, Santa

Clara, CA, USA).

Estradiol (e2), Follicle Stimulating Hormone (FSH), Lu-teinizing Hormone (LH), prolactin, and insulin levels were measured with an immunometric method by using an Immulite® 2000 (Siemens Medical Solutions Diagnostics,

Los Angeles, CA). Free testosterone tests were performed with Radioimmunoassay method (RIA) (Diagnostics Sys-tems Laboratories, Webster, TX). 17-OH-progesterone tests were performed with RIA by using BioSource Europe S.A., Nivelles, Belgium.

The Homeostasis Model Assessment Insulin Resistance index (HOMA-IR) was determined by using the follow-ing formula: fastfollow-ing insulin (mU/L) × fastfollow-ing glucose (mg/ dL)/22.5 (6). HOMA-IR value more than 2.5 was indica-tive of insulin resistance (7).

Echocardiographic examination

Transthoracic echocardiographic examinations were con-ducted with a commercially available cardiac ultrasound system (Acuson Sequoia C256, Acuson Siemens, Moun-tain View, CA, USA) equipped with a broadband 3.5 MHz transducer with second harmonic capabilities. All patients were examined with standard 2D and Doppler echocardi-ography conforming to the American Society of Echocar-diography (ASE) and European Association of Echocardi-ography recommendations (8). In addition, longitudinal myocardial systolic and diastolic velocities at the mitral annular level from the lateral and septal sites were mea-sured by using pulsed wave tissue Doppler in the apical 4-chamber view.

Left ventricular longitudinal myocardial systolic and dia-stolic velocities, sydia-stolic SR and sydia-stolic S were measured from the apical 2- and 4-chamber views and averaged by using the Syngo WST 3.0 software. A narrow angle with an optimal image depth was used to obtain a high frame rate (>100 frames/s) and avoid angulations. All echocar-diographic measurements were performed by the same

echocardiographer blinded to the clinical information of the patients.

Statistical analyses

All analyses were conducted by using the SPSS software (Statistical Package for the Social Sciences, version 15.0, SSPS Inc., Chicago, IL, USA). Continuous variables were expressed as mean ± Standard Deviation (SD) or median (interquartile range) and categorical variables as percent-ages. The normality of distribution was tested by the Sha-piro-Wilk test. Variables with a normal distribution were compared by a Student-T test or univariate analysis of variance (ANOVA). Variables that showed a non-homo-geneous distribution were compared by the Mann Whit-ney U-test. The comparisons of the categorical variables were performed with the chi-square test. Correlations were evaluated by the Spearman’s correlation test. A ‘P’ value lower than 0.05 was noted as statistically significant.

Results

Age intervals for PCOS and control group were similar (Table 1). LH, LH/FSH ratio, BMI, fasting serum glu-cose, HOMA-IR and insulin were higher in PCOS group (P<0.05) (Table 1). FSH, HDL were lower in PCOS group (P<0.05) (Table 1). Eight PCOS patients (31%) had insu-lin resistance. There were 10 (39%) people in PCOS group and 1 (4%) people in the control group in whom BMI val-ues were greater than 30. The number of people having a BMI between 25 and 29.9 was 7 (27%) in PCOS group and 5 (22%) in control group. The other participants’ BMI values were in normal range. Also, all participants’ electrocardiograms were in normal range. Waist circum-ference measurement and the ratio of waist circumfer-ence to thigh circumfercircumfer-ence were higher in PCOS group (P<0.05) (Table 1).

No differences were detected between the two groups’ conventional echocardiographic measurements (Table 2). Myocardial velocities, strain and strain rate measurements (Table 3) were also similar between the groups both for regional and global indices. No differences were found be-tween the strain measurements of participants whose BMI was greater or less than 25. Similarly, comparing the over-weight PCOS patients’ (BMI>25) strain measurements with that of normal weight PCOS patients’ (BMI<25) measurements, we found no differences.

Discussion

PCOS is thought to be an endocrine disorder which in-creases the cardiovascular risks (9). It was shown that metabolic complications associated with PCOS such as hyperinsulinemia, insulin resistance and dyslipidemia are major risk factors for atherosclerosis (9). In our study, we found fasting glucose (10), insulin, HOMA-IR and BMI to be higher and HDL to be lower in PCOS group (11,12). In PCOS group, obesity and irregularity of sex hormones were more evident as expected.

(3)

Our echocardiographic parameters were similar for both groups. The first parameter of our echocardiographic ex-amination was left ventricular ejection fraction and our results were similar for the PCOS patients and the control group, consistent with results of Tekin’s study (13). Howev-er, Orio et al. found lower left ventricular ejection fraction in overweight PCOS patients than the overweight con-trol group (12). Although 65% of the PCOS patients and 26% of the control group in our study were overweight or obese, we could not find similar results to Orio’s study for left ventricular ejection fraction measurements. Previous studies suggested that some factors such as obesity, insulin resistance and age could affect the myocardial strain

mea-surements. Obesity can cause a subclinical impairment in myocardial functions alone (14,15). Insulin resistant peo-ple can show subclinic deterioration in myocardial func-tions (16). In our study, only 31% of PCOS patients had insulin resistance and this low percentage of insulin resis-tant patients can possibly explain the similarity between the PCOS and control groups strain measurements. Our mitral inflow and mitral velocity results used for measuring left ventricular diastolic functions revealed no differences between both groups as in Tekin’s study (13), yet in Erdogan et al. study mitral velocities were lower in PCOS patients (17).

In another study, myocardial peak systolic strain, peak

Table 1. Baseline characteristics and laboratory results of the study population

Clinical characteristics PCOS (N=26) Control (N=23) P

Age (years) 25.9 ± 5.8 25.7 ± 2.8 NSⁿ

Females 100 (%) 100 (%) NS#

Body mass index (kg/m²) 28 ± 5.1 22 ± 2.9 0.00ⁿ

Waist circumference (cm) 84 ± 12 72 ± 8.6 0.00ⁿ

Waist to hip ratio 0.76 ±0.06 0.72 ± 0.05 0.009ⁿ

Hirsutismus 76.9 (%) 13.0 (%) 0.00#

Laboratory results

Fasting serum glucose (mg/dL) 90 ± 8.0 79 ± 7.0 0.00ⁿ

Total cholesterol level (mg/dL) 174 ± 37 167± 30 NSⁿ

HDL (mg/dL) 46± 9 58 ± 16 0.03ⁿ

LDL (mg/dl) 98 ± 32 86 ± 25 NSⁿ

Triglycerides (mg/dL) 96 ± 46 78 ± 40 NSⁿ

High sensitive C-reactive protein (mg/L) 2.9 ± 2.8 1.2 ± 1.0 NSⁿ

FSH (mIU/ml) 4.9 (0.7-7) 6.5 (0.8-10) 0.007* LH (mIU/ml) 6.3 (0.8-21) 4.3 (0.7-12) 0.01* LH/FSH 1.3 (0.3-5) 0.7 (0.09-3) 0.00* Prolactin (ng/ml) 12 (5-65) 20 (5-44) NS* Free testosterone (pg/ml) 1.1 (0.2-3.1) 0.7 (0.3-3.1) NS* DHEA-S (µg/dl) 240 (73-522) 270 (114-723) NS* Estradiol (pg/ml) 44 (20-158) 42 (20-134) NS* 17-OH-progesteron (µgr/ml) 1.0 (0.4-6.8) 1.2 (0.6-2.4) NS* Insulin (µIU/ml) 5.8 (2.8-50) 4.7 (2-10) 0.01* HOMA-IR value 2.5 ± 2.6 0.9 ± 0.4 0.006ⁿ Hemoglobin (g/dL) 13 ± 1 13 ± 1 NSⁿ Leucocytes (1000/µL) 6.303 ± 2 6.103 ± 1 NSⁿ Thrombocytes (1000/µl) 290 ± 73 274 ± 67 NSⁿ

The median (interquartile range), or frequency counts (percentages), as appropriate. DHEA-S= Dehydroepiandrosterone sulfate; FSH= Follicular Stimulating Hormone; HDL= High Density Lipoprotein; LDL= Low Density Lipoprotein; LH= Luteinizing Hormone; NS= no significant difference; PCOS= Polycystic Ovary Syndrome;

(4)

early diastolic strain, and peak early diastolic velocity measurements were found to be lower in obese (BMI>30), insulin resistant PCOS patients (18). However, we could not find any difference in our PCOS group. This can be explained by the small number of insulin resistant PCOS patients [8 (31%)] in our study.

In a study of overweight PCOS patients, longitudinal strain measurements were lower than the control group (17). The same study found higher HOMA-IR and insulin levels in PCOS group than the control group, yet the percentage of insulin resistant participants was not mentioned (17). Although the PCOS patients’ insulin, HOMA-IR and BMI values were higher than the control group in our study, we did not find any impairment of the left ventricular func-tion in both groups. This could be explained by the young

age of the participants in our study resulting in shorter durations as PCOS. Cardiological examination should be advised to these patients in the future.

Conclusion

In conclusion, according to our study PCOS patients with no clinical cardiovascular symptoms have no impair-ment in myocardial functions. Larger controlled studies are needed for further understanding and validating our results.

Ethical issues

Approval of the local ethics committee from “Baskent University Clinical Research Ethics Committee” was tak-en before the study was begun.

Table 2. Echocardiographic data of the patients with PCOS and controls

Echocardiographic data PCOS (N=26) Control (N=23) P

2 Dimensional measurements IVS (cm) 0.8 (0.5-1.1) 0.7 (0.5-1.0) NS* PW (cm) 0.8 (0.5-1.1) 0.7 (0.5-1.0) NS* LVDD (cm) 3.9 ± 0.2 3.7 ± 0.2 NSⁿ LVSD (cm) 2.4 ± 0.2 2.4 ± 0.2 NSⁿ EF (%) 57 (51-70) 57 (51-66) NS* EDV (ml) 83 (56-124) 79 (57-119) NS* ESV (ml) 36 ± 9 34 ± 8 NSⁿ SV (ml) 45 ± 12 43 ± 10 NSⁿ LVMI (g/m²) 55 ± 14 48 ± 9 NSⁿ

Tissue Doppler measurements

Mitral lateral S velocity (cm/s) 11 ± 2 11 ± 3 NSⁿ

Mitral septal S velocity (cm/s) 8.3 ± 1.8 8.7 ± 2.8 NSⁿ

Mitral lateral E’ velocity (cm/s) 17 ± 3 17 ± 4 NSⁿ

Mitral septal E’ velocity (cm/s) 13 ± 2 14 ± 4 NSⁿ

Mitral E-wave (cm/s) 77 ±25 81 ±12 NSⁿ

Mitral A-wave (cm/s) 56 ±9 61 ±10 NSⁿ

E/A 1.4 ± 0.5 1.3 ± 0.2 NSⁿ

E/E’ lateral 4.4 ± 1.5 5.0 ± 1.3 NSⁿ

E/E’ septal 6.1 ± 2.1 5.9 ± 1.8 NSⁿ

Measurements related to doppler assessment

Baseline heart rate (beats/min) 69 ± 11 71 ± 18 NSⁿ

Baseline SBP (mmHg) 114 ± 9 114 ± 8 NSⁿ

Baseline DBP (mmHg) 74 ± 7 74 ± 7 NSⁿ

A, late mitral inflow velocity; DBP, Diastolic Blood Pressure; E, early mitral inflow velocity; E’, early mitral annular velocity; EDV, End Diastolic Volume; EF, Ejection Fraction; ESV, End Systolic Volume; IVS, Interventricular Septum; LVDD, Left Ventricular Diastolic Diameter; LVMI, Left Ventricular Mass Index; LVSD, Left Ventricular Systolic Diameter; PCOS, Polycystic Ovary Syndrome; PW, Posterior Wall; S, Systolic; SBP, Systolic Blood Pressure; SV, Stroke Volume.

(5)

Table 3. Regional quantitative myocardial functional data of the patients with PCOS and controls

Myocardial functional data PCOS (N=26) Control (N=23) P

Systolic Strain measurements

Strain lateral basal (%) 21.3 ± 8.6 19.6 ± 5.6 NSⁿ

Strain lateral mid (%) 17.9 ± 5.6 15.6 ± 5.8 NSⁿ

Strain lateral apical (%) 10.7 ± 4.9 12.1 ± 7.3 NSⁿ

Strain septum basal (%) 17.2 ± 6.7 16.3 ± 9.3 NSⁿ

Strain septum mid (%) 17.9 ± 5.2 17.4 ± 5.2 NSⁿ

Strain septum apical (%) 13.9 ± 6.8 15.6 ± 6.2 NSⁿ

Strain anterior basal (%) 21.8 ± 6.8 20.8 ± 8.4 NSⁿ

Strain anterior mid (%) 15.1 ± 6.3 15.6 ± 5.1 NSⁿ

Strain anterior apical (%) 10 ± 4.7 12 ± 6.0 NSⁿ

Strain inferior basal (%) 17.6 ± 7.8 18.2 ± 7.5 NSⁿ

Strain inferior mid (%) 16.7 ± 6.3 18.4 ± 5.6 NSⁿ

Strain inferior apical (%) 16.6 ± 7.0 18.7 ± 6.1 NSⁿ

Mean systolic strain

Apical 4 chamber 16.7 ± 3.2 16.1 ± 3.9 NSⁿ

Two chamber 16.1 ± 3.8 17.4 ± 4.0 NSⁿ

Systolic Strain Rate, 1/s

Strain rate lateral-basal, 1/s 1.2 ± 0.5 1.1 ± 0.3 NSⁿ

Strain rate lateral-mid, 1/s 1.0 ± 0.3 0.9 ± 0.3 NSⁿ

Strain rate lateral-apical, 1/s 0.6 ± 0.3 0.8 ± 0.4 NSⁿ

Strain rate septum-basal, 1/s 1.0 ± 0.4 1.0 ± 0.7 NSⁿ

Strain rate septum-mid, 1/s 1.0 ± 0.2 0.9 ± 0.2 NSⁿ

Strain rate septum-apical, 1/s 0.8 ± 0.3 0.9 ± 0.2 NSⁿ

Strain rate anterior-basal, 1/s 1.2 ± 0.4 1.3 ± 0.6 NSⁿ

Strain rate anterior-mid, 1/s 0.8 ± 0.3 0.9 ± 0.3 NSⁿ

Strain rate anterior-apical, 1/s 0.6 ± 0.2 0.7 ± 0.3 NSⁿ

Strain rate inferior-basal, 1/s 1.0 ± 0.6 1.1 ± 0.5 NSⁿ

Strain rate inferior-mid, 1/s 0.9 ± 0.3 1.1 ± 0.6 NSⁿ

Strain rate inferior-apical, 1/s 0.9 ± 0.4 1.2 ± 0.5 NSⁿ

Mean systolic strain rate

Apical 4 chamber 0.9 ± 0.2 0.9 ± 0.2 NSⁿ Two chamber 0.9 ± 0.2 1.1 ± 0.3 NSⁿ Systolic Velocity (cm/sn) Velocity lateral-basal, cm/sn 4.2 ± 1.5 4.0 ± 1.1 NSⁿ Velocity lateral-mid, cm/sn 2.3 ± 1.4 2.3 ± 1.2 NSⁿ Velocity lateral-apical, cm/sn 0.7 ± 0.7 0.8 ± 0.6 NSⁿ Velocity septum-basal, cm/sn 4.4 ± 1.1 4.4 ± 0.7 NSⁿ Velocity septum-mid, cm/sn 2.4 ± 0.6 2.8 ± 1.0 NSⁿ Velocity septum-apical, cm/sn 1.0 ± 0.8 0.9 ± 0.7 NSⁿ Velocity anterior-basal, cm/sn 3.8 ± 1.5 4.1 ± 1.3 NSⁿ Velocity anterior-mid, cm/sn 1.7 ± 0.7 2.1 ± 1.2 NSⁿ Velocity anterior-apical, cm/sn 0.4 ± 0.3 0.6 ± 0.5 NSⁿ Velocity inferior-basal, cm/sn 4.5 ± 1.0 4.7 ± 1.3 NSⁿ Velocity inferior-mid, cm/sn 2.8 ± 0.8 3.0 ± 0.7 NSⁿ Velocity inferior-apical, cm/sn 0.8 ± 0.4 1.0 ± 0.4 NSⁿ

Mean Systolic Velocity (cm/sn)

Apical 4 chamber 2.4 ± 0.6 2.6 ± 0.5 NSⁿ

Two chamber 2.4 ± 0.6 2.6 ± 0.6 NSⁿ

(6)

Financial Support

The study was financially supported by Baskent Universi-ty (Ankara, Turkey).

Conflict of interests

We declare that we have no conflict of interests.

Acknowledgments

We have no acknowledgments to disclose.

References

1. Franks S. Polycystic ovary syndrome. N Engl J Med 1995;333(13):853-61.

2. Group TREA-sPcw. Revised 2003 consensus on diagnostic criteria and long-term health risks related to polycystic ovary syndrome (PCOS). Hum Reprod 2004;19(1):41-7.

3. Lo JC, Feigenbaum SL, Yang J, Pressman AR, Selby JV, Go AS. Epidemiology and adverse cardiovascular risk profile of diagnosed polycystic ovary syndrome. J Clin Endocrinol Metab 2006;91(4):1357-63.

4. Legro RS. Polycystic ovary syndrome and cardiovascular disease: a premature association? Endocr Rev 2003;24(3):302-12.

5. Heimdal A, Stoylen A, Torp H, Skjaerpe T. Real-time strain rate imaging of the left ventricle by ultrasound. J Am Soc Echocardiogr 1998;11(11):1013-9.

6. Oktem M, Ozcimen EE, Uckuyu A, Esinler I, Pamuk B, Bayraktar N, et al. Polycystic ovary syndrome is associated with elevated plasma soluble CD40 ligand, a marker of coronary artery disease. Fertil Steril 2009;91(6):2545-50.

7. Bonora E, Kiechl S, Willeit J, Oberhollenzer F, Egger G, Targher G, et al. Prevalence of insulin resistance in metabolic disorders: the Bruneck Study. Diabetes 1998;47(10):1643-9.

8. Lang RM, Bierig M, Devereux RB, Flachskampf FA, Foster E, Pellikka PA, et al. Recommendations for chamber quantification: a report from the American Society of Echocardiography’s Guidelines and Standards Committee and the Chamber Quantification Writing Group, developed in conjunction with the European Association of Echocardiography, a branch of the European Society of Cardiology. J Am Soc Echocardiogr 2005;18(12):1440-63.

9. Dokras A. Cardiovascular disease risk factors in

polycystic ovary syndrome. Semin Reprod Med 2008;26(1):39-44.

10. Gambineri A, Patton L, Altieri P, Pagotto U, Pizzi C, Manzoli L, et al. Polycystic ovary syndrome is a risk factor for type 2 diabetes: results from a long-term prospective study. Diabetes 2012;61(9):2369-74. 11. Lim SS, Norman RJ, Davies MJ, Moran LJ. The effect

of obesity on polycystic ovary syndrome: a systematic review and meta-analysis. Obes Rev 2013;14(2):95-109.

12. Orio F Jr, Palomba S, Spinelli L, Cascella T, Tauchmanova L, Zullo F, et al. The cardiovascular risk of young women with polycystic ovary syndrome: an observational, analytical, prospective case-control study. J Clin Endocrinol Metab 2004;89(8):3696-701. 13. Tekin A, Tekin G, Colkesen Y, Kilicdag EB, Bashan

I, Sezgin AT, et al. Left ventricular function in patients with polycystic ovary syndrome: a Doppler echocardiographic study. Exp Clin Endocrinol Diabetes 2009;117(4):165-9.

14. Tumuklu MM, Etikan I, Kisacik B, Kayikcioglu M. Effect of obesity on left ventricular structure and myocardial systolic function: assessment by tissue Doppler imaging and strain/strain rate imaging. Echocardiography 2007;24(8):802-9.

15. Orhan AL, Uslu N, Dayi SU, Nurkalem Z, Uzun F, Erer HB, et al. Effects of isolated obesity on left and right ventricular function: a tissue Doppler and strain rate imaging study. Echocardiography 2010;27(3):236-43. 16. Peterson LR, Herrero P, Schechtman KB, Racette

SB, Waggoner AD, Kisrieva-Ware Z, et al. Effect of obesity and insulin resistance on myocardial substrate metabolism and efficiency in young women. Circulation 2004;109(18):2191-6.

17. Erdogan E, Akkaya M, Bacaksiz A, Tasal A, Turfan M, Kul S, et al. Subclinical left ventricular dysfunction in women with polycystic ovary syndrome: an observational study. Anadolu Kardiyol Derg 2013;13(8):784-90.

18. Kosmala W, O’Moore-Sullivan TM, Plaksej R, Kuliczkowska-Plaksej J, Przewlocka-Kosmala M, Marwick TH. Subclinical impairment of left ventricular function in young obese women: contributions of polycystic ovary disease and insulin resistance. J Clin Endocrinol Metab 2008;93(10):3748-54.

Copyright © 2014 The Author(s); This is an open-access article distributed under the terms of the Creative Commons Attribution License (http://creativecommons.org/licenses/by/4.0), which permits unrestricted use, distribution, and reproduction in any medium, provided the original work is properly cited.

Şekil

Table 1. Baseline characteristics and laboratory results of the study population
Table 2. Echocardiographic data of the patients with PCOS and controls
Table 3. Regional quantitative myocardial functional data of the patients with PCOS and controls

Referanslar

Benzer Belgeler

[9] In our study, higher IR was detected in patients with PCOS, though not statistically significantly different, and mean plasma SeP level was lower than that of the

In the present study, the prevalence of uterine anomalies in infertile patients with PCOS admitted to our hospital was evaluated retrospectively, and a

Role of osteocalcin, tumor necrosis factor-alpha and adiponectin in polycystic ovary syndrome patients with insulin resistance.. Turk J Obstet

Our aim was to investigate the relationship of body mass index (BMI) and IR with left venticular mass index (LVMI) in obese and nonobese, normotensive, nondiabetic women.. Methods:

Assessment of left ventricular function with tissue Doppler, strain, and strain rate echocardiography in patients with familial

Although there was no relation in terms of tissue Doppler parameters between pseudoexfoliative glaucoma and pseudoex- foliation syndrome patients, plasma BNP concentrations were

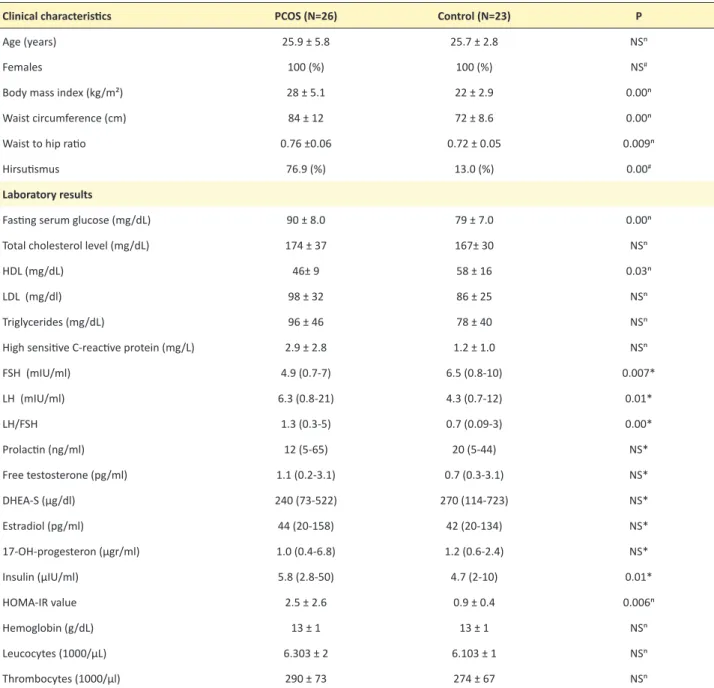
Clinical characteristics and laboratory findings of patients included in the study are shown in Table 1. Mean age of study population was 26.0±5.6 years with no difference between

The aim of the study is to determine left ventricular (LV) functions by tissue Doppler imaging (TDI) and strain/strain rate echocardiography (SE/SRE) in mitral stenosis patients