ISTANBUL BILGI UNIVERSITY
INSTITUTE OF SOCIAL SCIENCES
INTERNATIONAL FINANCE MASTER’S DEGREE
PROGRAM
THE EFFECT OF MACROECONOMIC FACTORS
ON REAL ESTATE PRICES IN ISTANBUL,
ANKARA AND IZMIR
Deniz GÜVEN YAŞIN
109664028
Assoc. Prof. Dr. Cenktan ÖZYILDIRIM
ISTANBUL 2019
ACKNOWLEDGMENTS
First of all, I would like to thank Dr. Bilge Nur Katipoğlu (my aunt) who gave me the courage and all kind of support. I am thankful as for she always stand behind my passion and believed in my purpose.
I would also like to mention my gratitude for Prof. Dr. Cenktan Özyıldırım who always showed me the right path when I needed a light.
A special thanks to dear Prof. Dr. Targan Ünal who supported me with his wisdom in writing my my thesis, patiently answered all hard questions.
I also thank to Dr. Cansu Sarkaya İçellioğlu for her help in econometric portion of my work.
iv TABLE OF CONTENTS ACKNOWLEDGMENTS...iii ABREVIATIONS...vi LIST OF TABLES...viii LIST OF FIGURES...x ABSTRACT...xi ÖZET...xii INTRODUCTION...1 CHAPTER 1 REAL ESTATE MARKET IN THE WORLD AND IN TURKEY 1.1. Real Estate Market and Definition...4
1.2. Basic Characteristics Of The Real Estate Market...5
1.2.1. Substitutability...5
1.2.2. Sensitivity...5
1.2.3. Buyer-Seller Level...5
1.2.4. Price Level…...6
1.2.5. Legal Limitations...6
1.2.6. Market Entry Level of Supply...6
1.2.7. Buyers and Sellers Expectations………...7
1.2.8. Consumption Rate………...7
1.3. Housing Demand and Price...7
1.4. Istanbul – Ankara – Izmir Housing Market...11
1.5. Macro-Economic Factors Affecting House Prices...16
CHAPTER 2: LITERATURE REVIEW...21
CHAPTER 3: DATA AND METHODOLOGY 3.1. Research Model - 1...32
3.1.1. Johansen Co-Integration Test...34
3.1.2.1 Variance De-Composition Analysis...41
3.1.2.2 Impulse Response Analysis...42
3.2. Research Model – 2...45
3.2.1. Panel Data Specification……...46
3.2.2. Unit Effect and Time Effect Testing...47
3.2.3. Hausman Test...48
3.2.4. Homogeneity Testing...49
3.2.5. Test of Cross Sectional Dependence...50
3.2.6. Estimating Heterogeneous Coefficients in Panel Data…...50
CONCLUSION...54
vi
ABREVIATIONS
FDI Foreign Direct Investment SUR Seemingly Unrelated Regression
VAR Vector Autoregression
REPI Real Estate Price Index
HPI House Price Index
FX rate Foreign Exchange Rate
DV Dependent Variable
IV Independent Variable
REPRICE Real Estate Price
CBRT Central Bank of Republic of Turkey USD FX rate Dolar Foreign Exchange Rate
VAT Value Added Tax
TSI Turkey Statistical Institute HHPI Hedonic Housing Price Index
OHPI Old Housing Price Index
TAKBIS Land Registry and Cadastre Information System
viii LIST OF TABLES
Table 1 : Price Index Changes (As of September 2018)…...10
Table 2 : Population Growth in Big Cities………...12
Table 3 : Percentage of Turkey and Istanbul Home Sales …………...13
Table 4 : Percentage of Turkey and Ankara Home Sales …….……...14
Table 5 : Percentage of Turkey and Izmir Home Sales …………...15
Table 6 : Foreign Direct Investment Inflows and Real Estate Purchases…...19
Table 7 : The Relationship Between Real Estate, Economic Growth, Exchange Rate and Interest Rate in the Academic Literature………...23
Table 8 : ADF Unit Root Test Results at I(0) and I(1) for Istanbul & Ankara & İzmir...35
Table 9 : Johansen Co-Integration Test Results for Istanbul...36
Table 10 : Johansen Co-Integration Test Results for Ankara...37
Table 11 : Johansen Co-Integration Test Results for İzmir………...37
Table 12 : Variance De-Composition of Real Estate Price – İstanbul…………...41
Table 13 : Variance De-Composition of Real Estate Price – Ankara…….…..…...42
Table 15 : Test of Unit Effect………...………...47
Table 16 : Test of Time Effect……….………...………...47
Table 17: Hausman Test……….…………...………...48
Table 18 : Test of Cross Sectional Dependence Result………...50
Table 19 : Seemingly Unrelated Regression………....………...51
Table 20: SUM Test Result of İstanbul.…………...………...51
Table 21: SUM Test Result of Ankara.….………...………...52
x LIST OF FIGURES
FIGURE 1 : Construction Licenses in Istanbul-Ankara-Izmir...…...16
FIGURE 2 : Housing Loan Interest Rates (Monthly and Annual)...…...18
FIGURE 3 : Exchange Rate by the last day of each month………...…...19
FIGURE 4 : Research Model – 1……...………..32
FIGURE 5 : Impact of FDI, Exchance Rate, Interest Rate on Real Estate Price – İstanbul……….…………...………...33
FIGURE 6 : Impact of FDI, Exchance Rate, Interest Rate on Real Estate Price – Ankara………….…….…………...………...33
FIGURE 7 : Impact of FDI, Exchance Rate, Interest Rate on Real Estate Price - İzmir……….…………...………...34
FIGURE 8 : VAR Analysis of Istanbul………...39
FIGURE 9 : VAR Analysis of Ankara……….…...39
FIGURE 10 : VAR Analysis of İzmir………..………...40
FIGURE 11 : Impulse Response Analysis - İstanbul….……….…...43
FIGURE 12 : Impulse Response Analysis - Ankara………..……….…...44
ABSTRACT
The Effect Of Macroeconomic Factors On Real Estate Prices in Istanbul, Ankara And Izmir
Real estate, especially housing demand is shaped for housing, status acquisition and investment purposes of individuals. The macroeconomic factors affecting the price are important in meeting all these needs. As the level of development increases, real estate investments are financed by financial institutions and financial market resources rather than resources provided from households and public sector. However, the institutionalization of real estate investments in our country is not fully formed and the financial markets are not utilized sufficiently in financing the investments disrupts the balance of supply and demand.
This thesis is the largest city in terms of Turkey's population of three studies in Istanbul, Ankara and Izmir discussed for macro-economic factors affect the price of housing was examined. In this context, the analysis of different factors affecting the changes in the housing price index of Istanbul, Ankara and Izmir between January 2010 and December 2018 was conducted. Interest rates are addressed as the driving force of the resident people's real estate demand. Especially in these three regions, foreigners' demand for real estate has been investigated. The other factor is the exchange rate and oil prices are added to the study by taking into account the input prices affecting the real estate supply. After investigation of independent variables to real estate, it has used co-integration tests, cause-effect relationship, variance analysis and panel analysis.
This comes to see that interest rate is more effective than FX rate in Ankara and İzmir; whereas FX rate is more influential in housing prices in İstanbul.
Key words: Real Estate Price, FX rate, interest rate, foreign direct investment (FDI) panel data analyses, co-integration tests, cause-effect relationship analysis, variance analysis.
xii ÖZET
Makroekonomik Faktörlerin İstanbul, Ankara ve İzmir'de Konut Fiyatlarına Etkisi
Gayrimenkul, özellikle konut talebi bireylerin barınma, statü elde etme ve yatırım amaçlı olarak şekillenir. Bütün bu ihtiyaçların karşılanmasında fiyat dolayısıyla fiyatı etkileyen makroekonomik faktörler önemlidir. Gelişmişlik düzeyi arttıkça gayrimenkul yatırımları hane halkı ve kamu kesiminden sağlanan kaynaklardan ziyade finansal kuruluşlar ve mali piyasalardan sağlanan kaynaklar ile finanse edilmektedir. Ancak ülkemizde gayrimenkul yatırımlarına yönelik kurumsallaşmanın tam oluşmaması ve yatırımların finansmanında mali piyasalardan yeterince faydalanılmaması arz ve talep dengesini bozmaktadır. Bu tez çalışmasında Ocak 2010 – Aralık 2018 döneminde Türkiye’nin göçe bağlı olarak nüfus açısından ve ekonomik olarak güçlü olan 3 büyük şehri İstanbul, Ankara ve İzmir için ele alınan makro ekonomik faktörlerin konut fiyatlarına etkisinin analizi gerçekleştirilmiştir. Yerleşik halkın gayrimenkul talebini hareketlendiren unsur olarak faiz oranlarını ele alınmıştır. Özellikle bu üç bölgede yabancıların gayrimenkule olan talebini araştırılmıştır. Diğer unsur gayrimenkul arzını etkileyen girdi fiyatlarını dikkate alarak döviz kuru ve petrol fiyatları araştırmaya eklenmiştir. Bağımsız faktörler tespit edildikten sonra panel veri analizi, eş bütünleşme testi, etki – tepki ve varyans ayrıştırması modelleri kullanılmıştır.
Eş bütünleştirme ve VAR analizleri sonucunda Ankara ve İzmir’de faizlerin konut fiyatlarını döviz fiyatlarına göre daha çok etkilediğini, İstanbul’da ise döviz kurunun konut fiyatlarını en çok etkilediği tespit edilmiştir.
Anahtar Kelimeler: Konut Fiyatları, Döviz Kuru, Faiz Oranları, Petrol fiyatları, Yabancı doğrudan yatırım, VAR, Panel Veri Analizi, Eş Bütünleşme Testi, Etki – Tepki ve Varyans Ayrıştırması
INTRODUCTION
Housing investment has an important role in development of cities as a long-term investment tool in addition to the purpose of meeting the housing needs. Purpose of this work is to assess the impact of 3 macro-economic indicators on the selling price of real estate industry by focusing on Turkey's demographically and economically largest cities; Istanbul, Ankara and Izmir.
The factors affecting the sales price of housing were determined with the help of literature studies taking into account the common features of relevant cities and were included in the study.
The thesis explain real estate prices by macroeconomic variables; interest rates, foreign direct investments, oil price increase rates and exchange rates. The analysis of the month-by-month basis are made by utilizing the housing price indices determined by the Central Bank of Turkey between 2010-2020 by monthly. In the study, the impact of the independent variables on the dependent variable (housing pricing) was investigated using Johansen Co-integration Test, VAR Analysis, Impulse Response test in E-views programme and Panel Analysis methods in Stata. Time lapse of housing prices in Istanbul, Ankara and Izmir have been examined in conjunction with the factors affecting them. The thesis is composed of 4 main parts. Introduction part covers purpose of the thesis, the scope and the method.
Section 2 is the literature section where the sources examined are included. The practical and theoretical analyzes of the effect levels of the variables that are thought to be effective on the sale price of the house are analyzed in this section. Approaches related to this subject are examined, similarities and differences have been highlighted.
2
The third chapter covers the implemented model, results obtained from the analyzes, the distribution of the housing sales prices and relevant influential factors. Models are explained.
In section 4 has the results obtained from the analysis of the data obtained in the study, the implications, conclusions and evaluations.
CHAPTER 1
REAL ESTATE MARKET IN THE WORLD AND IN TURKEY
More than half of the world's population lives in urban areas. In the 20th century, new business patterns caused economic growth to shift from agriculture to services sector, while rural population decreased, and the number and size of cities increased. People who migrate from rural areas to urban areas to find jobs, get education, benefit from health services and have a better standard of living cause the urban population to grow at a rate above the natural population growth. There is a significant relationship between the development of urban areas and the demand for real estate investments. In addition to the increase in population demand, the increase in employment creates a need for more commercial space. Therefore, the attractiveness of real estate investments is increasing in parallel with the growth of cities.
The level of real estate investments is determined under the influence of macro-quantities and varies within the general economic conjuncture. The greater the role of the financial market in the operation of the real estate market, the higher the degree of crises The world economy has experienced the global financial crisis, also known as the "Mortgage crisis", the largest after the "Great Depression". The confidence in the US and world financial system has been deeply shaken and the negative effects of the crisis have deeply affected many countries. Due to the weakening of the economic conditions, the crisis stemming from the US housing market began to experience problems in individual and corporate loan repayments. The problems in the mentioned markets rapidly affected real markets in time reflected in financial markets, crisis developed and spread to all developed economies.
The Turkish real estate sector has been stagnant in the last 10 years and has stagnated in the last three years. The fact that the construction sector has a great importance in terms of macroeconomics is the result of the multiplier effect it has
4
created for the economy. The construction sector has a multiplier effect on the country's growth by mobilizing more than 250 sub-sectors and provides great support for employment. The importance of this multiplier effect has been experienced in the financial crisis that started in the USA and spread to other countries. Construction industry components are significantly affected by macro and micro developments, (İçellioğlu, Şarkaya, 2011).
The correct analysis of macro and micro-indicators can also be a warning mechanism for the construction sector. Istanbul mainly in large cities and growing momentum in housing initiatives in rural settlements in Turkey, has a great importance in the sector's growth. Furthermore, making Turkey the rapidly growing population in parallel to both housing growth in the real estate sector, which has the investment function Turkey to become one of the countries carrying out effective activities in this sector between the years 2010-2016.
1.1. Real Estate Market and Definition
Real estate; It is examined under five groups, including residential, commercial real estate, industrial real estate, agricultural real estate and special purpose real estate. Housing refers to buildings such as detached houses, apartments and villas used for housing purposes. Commercial real estates, shopping centers, business centers, office buildings, shops, hotels, tourism facilities and all kinds of commercial properties are commercial properties. Industrial real estate include industrial facilities such as manufacturing plants, factories. Agricultural real estate refers to the land used for agricultural purposes. Private properties include schools, hospitals, museums, historical buildings, marinas, ports, airports, and special transportation stations. (Tatoğlu, Hasan Emin 2008, p.4-5).
Immovable property in Turkey as equivalent to the word, real estate, it is observed that the concept of an independent unit or individual parts is also widely used. In addition, the concept of real estate ”in Property Law finds its place as “real estate”
Real estate is defined as the real property that individuals or institutions have in order to create a living space and also because of investment. For these reasons, the real estate is legal in nature (Parasız,M.Ilker 2015, p.11).
1.2. Basic Characteristics Of The Real Estate Market
The real estate sector, which is one of the fastest growing sectors of the world, also has a more sensitive structure in terms of crises and financial problems than other sectors. Thus, over time, the real estate sector has started to determine its own structure and characteristics.
1.2.1. Substitutability
Since the name is lam immovable adır on the name, real estate is not fixed and cannot be replaced because they are in no position to be replaced by anything and they cannot be compared with any product that is not in their market.
1.2.2. Sensitivity
Real estate sector, positive and negative developments more rapid and harder than other sectors are observed to react. Especially the changes in purchasing power in the domestic market are considered to be one of the biggest reasons affecting the viability of the sector. However, it is seen that the sensitivity of the sector is high in international developments.
1.2.3. Buyer-Seller Level
The number of sellers and the number of buyers in the real estate market are the main factors determining the price of real estate. Although the seller is primarily considered to be the price determinant for a particular real estate, the low or high buyer level will cause the seller to make changes to the price determined by the
6
seller. In other words, in an environment where the buyer level is too high or the number of supply is limited, prices will increase, otherwise the prices will fall. 1.2.4. Price Level
It can be stated that the price level in the real estate market is generally determined by the sellers or by the supply groups. However, according to the demand of the buyers, the sellers can change the price levels. The factors that affect the development potential of each region and the factors behind the price increase or fall of each region, the differentiation of the properties or the benefits of the real estate, are the most important factors of the price level.
1.2.5. Legal Limitations
The legal restrictions in the real estate market are generally set by local authorities. However, it is the highest legal regulatory state as in every sector. Municipalities play an active role, especially in the determination of fair values, determination of regional precedent rates or creation of development plans. All these elements are the values that affect the price mechanism, in the purchase of real estates, in determining the title deeds, etc. transactions are subject to legal framework. The real estate sector, with its various legal constraints, is the sector that provides the momentum of acceleration and a number of incentives provided by the government. For example, tax exemption in the process of Urban Transformation and rent assistance have been included as an incentive.
1.2.6. Market Entry Level of Supply
Unlike other sectors in the real estate market, the market entry level of supply is quite slow. The fact that the products produced will be completed in about two or three years makes it difficult to meet the demand that has arisen in time. The liquidity problems that the supply segments will experience in developing
high-budget projects also affect the production processes and extend the completion of the projects to the longer term. However, the large amount of supply entering the market with the same timing will create a surplus in the market and will put pressure on prices.
1.2.7. Buyers and Sellers Expectations
In the real estate market, both buyers and sellers are trying to make investments and acquisitions according to their expectations. For buyers, buying a house to guarantee themselves and to make an investment for the future, and the processes they design for the future determine the ways in which they buy.
1.2.8. Consumption Rate
In the real estate market, the rate of consumption, such as the entry level of supply, is also quite low. The fact that the consumption rate is lower than expected leads to an increase in the invented stocks but also to lower the prices to a certain level. 1.3. Housing Demand and Price
Among the sub-markets of the real estate market, housing meets one of the most basic needs of people. The housing is also located in Maslow's hierarchy of needs; responds to all aspects of psychology, security, belonging, respectability and self-realization (Hablemitoglu, Özkan ve Purutçuoğlu, 2010, p. 222). Housing ownership allows for control of a physical area and satisfies the sense of control and security in individuals (Taylor, Pevalin ve Todd, 2006, p. 3). Although it is the first target shelter for housing purchase, over time, as individuals' income levels rise, real estate is a significant and valuable investment form. Housing ownership allows for control of a physical area and satisfies the sense of control and security in individuals. Therefore, the attractiveness of real estate investments is increasing in parallel with the growth of cities.
8
The choice between ownership or rental options in housing acquisition may vary depending on country and cultural conditions. In countries such as the UK, where Anglo-Saxon culture is influential, tenancy is considered a culturally preferable form of housing, while housing ownership is considered a symbol of success and economic independence. In southern European countries such as Spain and Greece, housing ownership is seen as both a security and a long-term prosperity tool for the expanding family. In Central European countries with active social security systems such as Germany and Switzerland, it is noteworthy that the share of high quality rental housing in total housing stock is relatively high (Atterhög, 2005a, p. 5, 12). In Turkey, as a matter of accumulating wealth means detecting an increasing effect on the demand for housing. In this context, Çolak and Öztürkler (2012, p. 41) found that housing ownership as a wealth factor for low-income households had a positive effect on the savings by eliminating the rent expenditures which had a very important place in the expenditures of this income group.
Considering the economic level and housing portfolio management; the perception of housing as a means of accumulation providing protection against inflation; alternative financial / non-financial instruments are preferred for a variety of reasons in long-term investment strategies; demand for households is increasing. However, despite the fact that the accessibility of the price in our country is low compared to the international standards, the rapid increase in the home sales seems paradoxical (Coşkun, Watkins and White, p. 2014). This phenomenon is even more striking in the larger cities where the high housing price-lower average income spiral and high housing finance costs are effective. On the other hand, the lack of information on the housing market is another paradoxical trend that is not sufficiently considering that housing demand and sales maintain their upward trend despite the detrimental effects of housing consumers on decision-making processes. It is the concept of 'price' which is one of the main points of attention of the real and legal persons doing business related to the housing. One of the best methods to be followed in order to see the housing prices, or the direction of change in asset
prices, is the indexing . The data set for housing pricing and exchange in our country is unfortunately not yet at the desired level.
The growth of the market and the increasing interest in this necessitates the monitoring of more specific data. Moreover, in many developed countries, statistics with longer series are maintained. In addition, in some countries, prices related to price, gap / occupancy rates, rent variables prepared by universities and private institutions are kept. It should be kept in mind that the analysis made by looking at the data in question will be even more healthy. In our country, there is a lack of data sets that explain the price and rent indices and gap times based on the 'market price'. Since 2010, CBRT has prepared two indices for housing prices in Turkey and filled an important gap. The first of these indices' Turkey Housing Price Index 'and the other' Turkey is the New Housing Price Index. (CBRT takes care to determine a more realistic price based on housing valuation reports in the index accounts). One of the most important problems in the price and appraisal of housing is the fact that the prices in different districts vary widely in different neighborhoods due to the fact that they do not have a 'homogeneous' presence.
As of October 2018, when we look at the important dynamics that affect prices and prices, the following points come to the fore.
• Housing sales in Turkey increased by 19.2% compared to the same month of the previous year in October 2018. The driving force of the increase was primarily through the campaigns of Emlak Konut GYO, GYODER and TOKİ, and tax and mortgage reductions. (GYODER, 2019 Rapor)
• In the second half of 2018, there was a sharp decline in mortgage sales as a result of rate hikes accelerating in the second half of the year and the impact of this on mortgage loans. The decline in mortgage sales is almost met by other types of sales.
10
• Construction permits showed sharp declines compared to October 2017. The main reasons for this are the impact of rising costs and the purpose of balancing the supply of the sector.
• On the other hand, foreigners have shown a significant increase compared to the previous year due to the effects of legal regulations such as housing sales, citizenship and VAT exemption.
• In addition, the Hedonic Housing Price Index decreased by 13.93 percent in real terms in October 2018 compared to the same month of the previous year. This development is attributed to the fact that the nominal increase in housing prices did not increase in line with inflation.
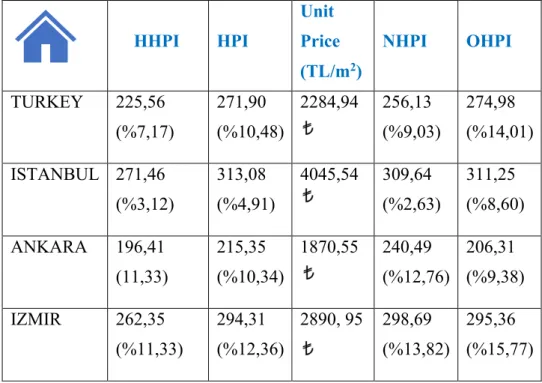
Table 1 : Price Index Changes (As of September 2018), (source: CBRT)
HHPI HPI Unit Price (TL/m2) NHPI OHPI TURKEY 225,56 (%7,17) 271,90 (%10,48) 2284,94 256,13 (%9,03) 274,98 (%14,01) ISTANBUL 271,46 (%3,12) 313,08 (%4,91) 4045,54 309,64 (%2,63) 311,25 (%8,60) ANKARA 196,41 (11,33) 215,35 (%10,34) 1870,55 240,49 (%12,76) 206,31 (%9,38) IZMIR 262,35 (%11,33) 294,31 (%12,36) 2890, 95 298,69 (%13,82) 295,36 (%15,77)
• In Turkey, HPI in October 2018 did not provide a real return in nominal terms when adjusted for inflation increased by 10.48 percent compared to the same period of the previous year.
• The lowest price increase in the three major cities (nominally) was realized as 4.9 percent in Istanbul, while the ratio was 10.34 percent in Ankara and 12.36 percent in İzmir.
• The lowest price increase in the three major cities (nominally) was realized as 4.9 percent in Istanbul, while the ratio was 10.34 percent in Ankara and 12.36 percent in İzmir.
• When we look at the unit square meter prices, it is possible to say that there has been an increasing trend for the last five years. The housing price index (HPI), hedonic housing price index (HHPI) and the recent one-year course of new and non-new housing indices are given in the table 1. Accordingly, as of September 2018; HPI increased by 10.48% while HHPI increased by 7.17%.
• In the New Housing Price Index (NHPI); NHPI increased by 14,01%. Increases in housing price indices have lost momentum in the last year. Index values increased below the inflation level and decreased in real terms.
1.4. Istanbul – Ankara – Izmir Housing Market
In our study population in terms of the top 3 largest city of Istanbul in Turkey, they have a most important share of spending in GDP terms why we chose Ankara and Izmir.
Turkey Statistical Institute (TSI), according to calculations made from the data, the amount of 15,067,724 Istanbul with a population of over 4 years of population growth which has been more than the population of the 64 provinces in the country. Istanbul, 1 million 157 thousand 576 people added to the population in the last 4 years. In Istanbul, population growth is 80 percent, and 20 percent is migration.
12
Since 2014, sales made in Turkey in general in Istanbul when examined ranged from 19.4% of total housing sales with 16.9. Turkey is also one of every five sold-bought and sold housing in Istanbul. As Istanbul is a commercial junction point, it has a serious potential in this type of real estate transactions.
Istanbul is a demographically active city. 18.5 out of every 100 people living in Turkey and lives in Istanbul. Istanbul, one of the most populous cities in the world, has a population of approximately 6.5 times the size of London's 1.7 Berlin and 4 Paris. The population of Istanbul, which has surpassed 145 countries with its population, was added to the population by approximately 1 million more during the 2012-2016 period. (Source: TSI)
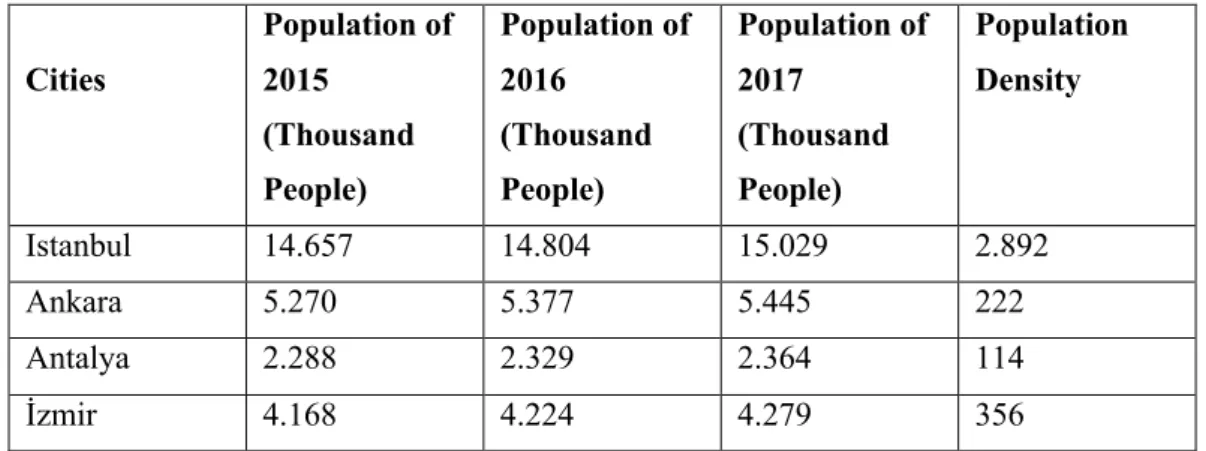
Table 2. Population Growth in Big Cities (Source: TSI)
Cities Population of 2015 (Thousand People) Population of 2016 (Thousand People) Population of 2017 (Thousand People) Population Density Istanbul 14.657 14.804 15.029 2.892 Ankara 5.270 5.377 5.445 222 Antalya 2.288 2.329 2.364 114 İzmir 4.168 4.224 4.279 356
Istanbul has a population of more than 145 of 216 countries in the world. According to TSI data, a certain tendency and livelihood in housing sales are still continuing in Istanbul. The share of foreign investors in these sales is also increasing.
According to the data of General Directorate of Land Registry and Cadastre, in 2014, 6,046 investors took 5,911 independent departments in Istanbul and 8,455 investors took 8,505 independent units in 2015. In 2016, foreign investors purchased 5,811 independent units. (Souce: TAKBIS).
In 2017, foreign investors took 8,182 independent units and 8.611 investors. In 2018, the highest volume of all-time sales was made in the real estate purchases of foreign investments. The sales order for foreigners in January-October period of 2017 was 6.652.
According to 2016 data, 57.3 percent of the households in Istanbul are homeowners. 833.557 households are tenants. 679,816 households have additional housing / dwellings. The main motives of having additional residences are usage and investment.
The owners of the houses have bought their homes with great savings and savings. When households are evaluated according to their income and savings capacities in Istanbul, it is seen that the highest and the highest income groups can accumulate housing and installment loans with their savings and monthly saving capabilities. Istanbul is the most important market for Turkish real estate market. It is a world city which is very attractive for both domestic and foreign investors (see table 3).
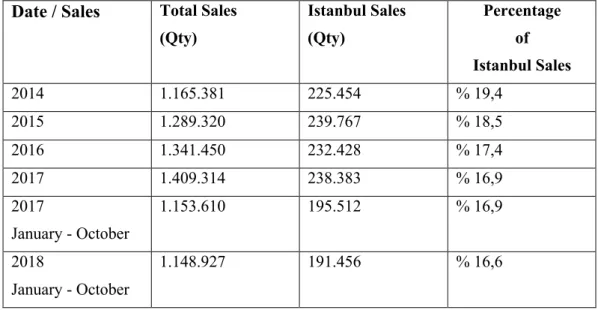
Table 3. Percentage of Turkey and Istanbul Home Sales (Source: TSI)
Date / Sales Total Sales (Qty) Istanbul Sales (Qty) Percentage of Istanbul Sales 2014 1.165.381 225.454 % 19,4 2015 1.289.320 239.767 % 18,5 2016 1.341.450 232.428 % 17,4 2017 1.409.314 238.383 % 16,9 2017 January - October 1.153.610 195.512 % 16,9 2018 January - October 1.148.927 191.456 % 16,6
14
Since 2014, sales made in Turkey in general in Istanbul when examined ranged from 19.4% of total housing sales with 16.9. Turkey is also roughly one in every five sold-residential traded in Istanbul. As Istanbul is a commercial junction point, it has a serious potential in this type of real estate transactions.
Ankara is a city where price increases have been realized for quite a long time. The fact that Ankara started to migrate, the land structure for housing construction and the availability of areas were repressed. Similar to Istanbul, the dwellings in the city walls can be sold at lower prices than the ones in the center.
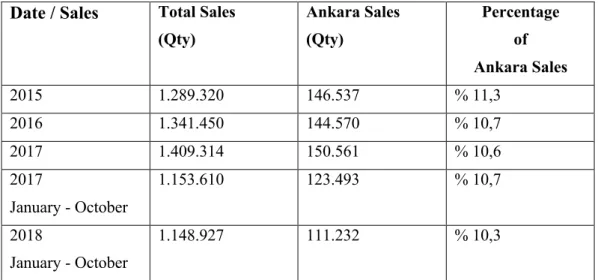
Table 4. Percentage of Turkey and Ankara Home Sales (Source: TSI)
Date / Sales Total Sales (Qty) Ankara Sales (Qty) Percentage of Ankara Sales 2015 1.289.320 146.537 % 11,3 2016 1.341.450 144.570 % 10,7 2017 1.409.314 150.561 % 10,6 2017 January - October 1.153.610 123.493 % 10,7 2018 January - October 1.148.927 111.232 % 10,3
Ankara's share in total sales in the last three years continues at a stable level between 11% and 10%. Ankara in terms of numbers 5.4 million people are living according to TSI data, is Turkey's second largest city.
In terms of foreign investors, sales in Ankara have increased as seen in all of our major cities. In January-October period of 2017, there were 663 residential units, while in the same period of 2018, the number reached 1,604.
Unit prices in Ankara increased by 9.2 percent in nominal terms on average in 2016 and increased by 8.2 percent in nominal terms in 2017.
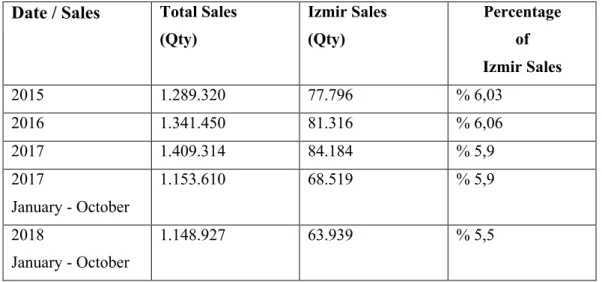
In the last few years, the immovables of İzmir have started to see a very high demand. Demographics as an intensive migration to another great that provinces with is implemented infrastructure investments to ensure the ease of transportation, it is seen that branded residential manufacturer of interest has created a structure of live market of Izmir annual shareholders as we look at the rate for the whole of Turkey are sold subject floating in the 6 range from 5.5%.
According to TSI data, there are seasonal real estate movements in the city where 4.3 million people live. Especially in the summer, there is a more intense period in terms of both sales and pricing.
Table 5. Percentage of Turkey and Izmir Home Sales (Source: TSI)
Date / Sales Total Sales (Qty) Izmir Sales (Qty) Percentage of Izmir Sales 2015 1.289.320 77.796 % 6,03 2016 1.341.450 81.316 % 6,06 2017 1.409.314 84.184 % 5,9 2017 January - October 1.153.610 68.519 % 5,9 2018 January - October 1.148.927 63.939 % 5,5
Since Izmir's urban and surrounding district settlements are easier to access than other major cities, they see similar demand in the central and non-central regions. Unit prices increased by 15.3 percent in 2016 and increased by 18.6 percent in 2017. In the real estate sector, three major cities (Istanbul, Ankara, Izmir) are indicative of both the course of the market and the behavior of decision makers. Therefore, the numbers measured in these cities are important in terms of analysis. Istanbul's supremacy is remarkable in three major cities in the types of building permits.
17
Accordingly, the 2000 nominal with in Turkey has more housing in most of the provinces, this result does not mean that there is housing problem in Turkey shows that it is met with unlicensed housing production needs on the contrary it. When the housing stock with a surplus is licensed, it is seen that there is a deficit of licensed housing stock in many provinces and the surplus of housing is caused by unlicensed housing stock.
In addition, due to the fact that the housing stock contains considerably low quality housing, it is seen that there is a problem of quality along with the problem of quantity in the housing problem. In addition, it can be seen that unlicensed housing problem has become an investment area rather than a solution against the need that cannot be met in the legal framework.
The financial crisis and Turkey in the period after the increase or decrease in housing prices is seen that the impact of macroeconomic variables. Changes in interest rates, inflation and especially the exchange rate are the determining factors in the increase or decrease in housing prices.
The most important factor that forces the real estate market in macroeconomic terms is the increase in cost inflation and interest rates. This situation created both demand and supply imbalance. On the other hand, the fact that the contractors do not reflect their costs to the sales prices and the credit limits obtained from the banks have a negative effect on the cash flows of the firms.
The annual rate of increase in housing prices in Turkey in general is declining in real terms since the beginning of 2016. The said slowdown increased slightly in 2018. On the other hand, the demand for foreigners' housing remains quite lively. The increase in the exchange rate made it cheaper than the real estate market in Turkey for foreigners.
In the first quarter of 2019, housing sales declined by approximately 1% compared to the same period of the previous year and closed at 256,433 units. In the second
There is a period when housing loan interest rates are high. Sales in the sector need to be sustainable according to purchasing power.
Today there are about 6 million risky structures to be addressed in the process of urban transformation. At the same time, 650 thousand pieces per year is needed in the band. In this respect, the housing sector is open and needs to be focused on in the coming years. The sales to foreigners contribute much more to our country in terms of multiplier effect compared to normal exports . Foreign sales transactions should be considered as export items and some incentives should be given to open the sector .demand side of the real estate market as a cyclical low in Turkey, even though, again viability requirement for vast profits, the sector in the next half-year period.
21 CHAPTER 2
LITERATURE REVIEW
There are vast of academic work in literature. For this reason, the major goal is to find out the relationship between exchange rate, interest rate, foreign direct investment (FDI) and real estate price so many academicians has been comprehending relevant academic topics which is available below:
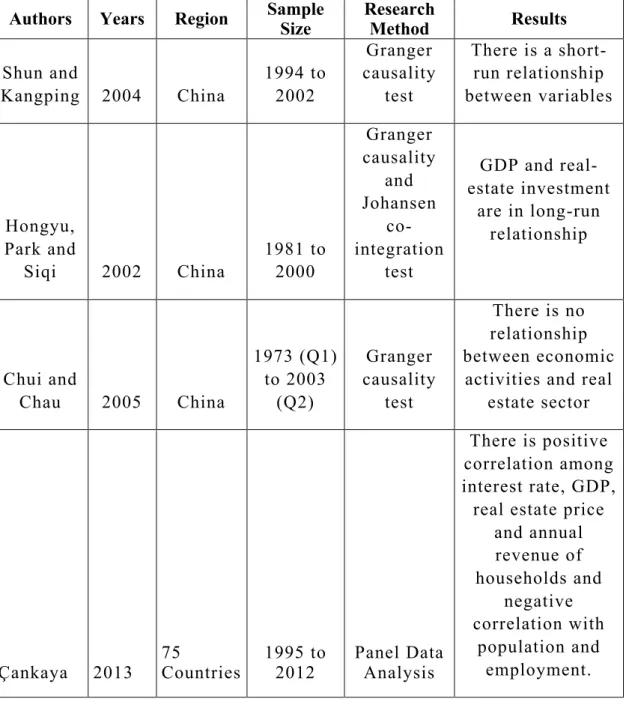
Shun and Kangping (2004) investigate the relationship between real estate market development and economic growth for China from 1994 to 2002 by using Granger causality test and according to their results there is a short-run relationship between variables.
Shuping, Yunfang and Tiemei (2006) reveal the correlation between the emerging real estate industry and economic development for China by implementing vector auto regression model. On the other hand, the real estate equilibrium price and the fluctuation in real estate prices have been taken into account by considering the co-integration theory and H-P filter. According to their results the real estate price deviation exists in some district of China. Therefore, it can be considered that the bubble is regional. In addition, the relationship among the economic growth and the real estate market is determined by using time-varying model.
Hongyu, Park and Siqi (2002) find out the relationship between GDP and housing investment in terms of short-run and long-run relationship by using Granger causality and Johansen co-integration test from 1981 to 2000 in order to perform time-series analysis for China. According to their research findings there is a long-run relationship between relevant variables which is consistent with the thesis research results.
Chui and Chau (2005) conceives the relationship between economic activities in the real estate sector for China and try to reveal the linkage from 1973 (Q1) to 2003
(Q2) by implementing Granger causality test and indicating no relationship between variables which is overlapped with the thesis research results.
Çankaya (2013) examines the relationship between real estate price and macroeconomic variables from 1995 to 2012 for 75 countries including the Turkey in his work. The countries divided as group in order to make panel data analysis and according to results of empirical findings, there is positive correlation among interest rate, GDP, real estate price and annual revenue of households and negative correlation with population and employment. However, the results differ from region to region.
Ewing and Payne (2005) uses a technique of generalized impulse response from January 1980 to September 2000 in United States. This study shows the correlation between housing investment, real output growth and the default risk premium. Monetary policy is very influential at low real estate returns if there is a shock in the market. If there is a monetary tightening policy, usually interest rates are affected in the short run and real estate prices are impacted in the long run.
Cecchetti and Kharroubi (2005) investigated the relation between the economic growth and financial sector out of a data analysis for 20 countries for a period of 30 years. Eventually he found a negative correlation. If it has to be a positive correlation, it is the expansion of the financial sector and growth of the real economy at slower pace. Afterwards, they establish a model regarding the investment projects. As a result, they choose to invest in more pledge able/less productive projects, reducing total factor productivity growth.
23
Table 7. The Relationship Between Real Estate, Economic Growth, Exchange Rate and Interest Rate in the Academic Literature.
Authors Years Region Sample Size Research Method Results
Shun and Kangping 2004 China 1994 to 2002 Granger causality test There is a short-run relationship between variables Hongyu, Park and Siqi 2002 China 1981 to 2000 Granger causality and Johansen co-integration test GDP and real-estate investment are in long-run relationship Chui and Chau 2005 China 1973 (Q1) to 2003 (Q2) Granger causality test There is no relationship between economic
activities and real estate sector
Çankaya 2013 75 Countries 1995 to 2012 Panel Data Analysis
There is positive correlation among interest rate, GDP,
real estate price and annual revenue of households and negative correlation with population and employment.
Ewing and Payne 2005 US January 1980 to September 2000 (monthly data) Generalized impulse response analysis When there is a monetary shock, housing investment return proves to be lower. Basically, sudden monetary tightening increases interest rates and as a result real estate market becomes less attractive, eventually shrinks. Cecchetti and Kharroubi 2015 20 countries Over 30 Years Panel Data Analysis When financial sector grows in a fast speed, real economy usually grows slower. This is a constant cause-effect relationship. Leba and Akbas 2014 Turkey 1970-2011 Co-integration and vector error correction model There is a positive correlation
between per capita income, marital status and industrialization of Turkey. There is a negative correlation between housing prices, interest rates and employment in Turkey.
25 J.S. Wabe 1971 Londra First three months of 1968 Regression analysis
The location of the house and the rate of population living in the area are effective on the determination of housing prices.
Öztürk
and Fitöz 2009 Turkey
1994-2008 Regression Analysis There is a positive relationship between housing supply and per capita income and the general level of housing supply and prices was found to increase the housing supply in Turkey. Kayral 2017 Turkey (Istanbul, Ankara and İzmir) January 2010 to August 2016 Regression Analysis In Ankara and İzmir, we see a minimum influence of macroeconomic indicators on housing prices. Whereas in Istanbul, macroeconomic indicators have positive effect on housing prices.
Darici 2018 Turkey
2010 – 2016 (monthly
data) ARDL Model
Expansionary monetary policy causes a pressure to boost housing prices. This findings indicate that lending
opportunities of banks of the expansionary
monetary policy has a positive effect on aggregate demand in Turkey. Simons vd. 1998 Ohio 1992-94 Hedonic Price Model Supply to new housing is a factor in the increase in prices for existing houses positively.
Leba and Akbas (2014) examines the effects of short and long term in terms of housing demand in Turkey. Co-integration and vector error correction model were applied by using the period of data 1970-2011. The causality relationship between explanatory variables and housing demand was examined with Granger causality and bootstrap Granger causality tests based on VECM. According to the results of the study, there is a positive correlation between per capita income, marital status and industrialization of Turkey. On the other hand, there is a negative correlation between housing prices, interest rates and employment in Turkey.
Housing supply and demand in the housing market was determined as variables for regression analysis. National income, housing prices and the increase in the monetary value of M2 are the factors included in the analysis as well. As a result of the study, there is a positive relationship between housing supply and per capita income and the general level of housing supply and prices was found to increase the housing supply in Turkey (Öztürk and Fitöz, 2009).
27
The impact of monetary policy on housing prices are being demonstrated by using monthly data from 2010 to 2016. In order to make the analysis ARDL model is implemented as well. According to research results, expansionary monetary policy causes a pressure to boost housing prices. This findings indicate that lending opportunities of banks of the expansionary monetary policy has a positive effect on aggregate demand in Turkey (Darici, 2018).
Akkaş, Sayılgan the causality between housing prices and mortgage interest rates is analyzed. The study covers the period 2010: 01 - 2015: 04 as the data. In this study, Toda-Yamamoto (1995) causality test, impulse-response tests and variance decomposition methods were applied. According to the results of the MWALD test, one-way Granger causality phenomenon was observed from the interest rate to the housing price index, and Granger causality was not observed in the other direction. The same results were obtained for the new housing price index. According to the results of the impact. Response analysis, housing loan interest shocks have a lagged and significant negative effect on house prices and new house prices. According to the results of the variance decomposition, both the housing price index and the new housing price index are explained by their own lagged values as well as the mortgage interest rate.
Since housing prices will be affected by the cost of financing, the change in interest rates causes households to change housing demand and the financing power, which is decisive in housing purchases. As the increase in interest rates will increase the borrowing costs, it leads to a decrease in the total housing demand and eventually the housing prices decrease. Hence, there is a negative correlation between interest rate and housing prices, mainly due to decreasing demand (Hoffman, 2004). Kayral (2017) finds out the changes in housing prices of Ankara and Izmir have been affected by changes in housing prices of main cities and other cities in the region. Within the scope of his study, it has been concluded that the real estate price in the three big cities are mostly affected by the other major cities, which are the dependent variable of each model. Consequently, there is no impact of
macroeconomic variables on real estate price of Ankara and Izmir. However, there is positive impact of macroeconomic variables on Istanbul’s real estate price. Ünlükara, T. (2008) studied on housing price criteria on luxury residential projects. This worked on Istanbul. The results of the study revealed the hypothesis of the accuracy of the hypotheses and the factors affecting the price of luxury houses. In this study; hedonic price model was used. Regression analysis revealed that the factors affecting the price of housing differ according to the characteristics and the importance of them.
The main aim of this study shows that the impact of macroeconomic factors on housing prices in Turkey between 2007-2010 years by using Let's look at what VAR analysis is composed of. It brings together impulse-response functions, variance decomposition and Granger casualty tests. As a result, we can see that real-estate pricing can be wide explained by macroeconomic conditions. It also shows that the direction of the relationship is from macroeconomic variables to housing prices. In terms of economic policies, it is seen that the housing price channel plays an important role in the monetary transmission mechanism through the interest rate (Odabaş, D. , 2011).
Zhang et al. (2016) has a peculiar classification on Chinese cities. He classifies based on basic features such as economic progress, transportation network, infrastructure and culture. Obviously, researches prove there is a strong effect of interest rates on real estate prices. But this effect is diminishes downward from 1st tier to 3rd tier cities. As for inflation, the impact is positive in 1st period whereas it is negative later on. As we move from 1st to 3rd tier the impact is more positive. Real-estate prices contribute to inflation at a more positive trend from 1st to 3rd tier. On the other hand, GDP growth has a positive effect on real-estate prices, 1st tier cities having the strongest impact. As the 1st tier cities have the strongest growth the more and more contribute to inflationary prices in housing and are a drive for the rise of housing prices continuously.
29
Gökler (2017) examined 14 variables using the regression analysis, which were thought to affect the prices of 8942 houses in 343 neighborhoods of Ankara's eight districts. As a result of the study, the square meter of the house, the number of bathrooms in the residence, the number of rooms in the house, the type of heating, the age of the house, and the housing in the Çankaya, Gölbaşı, Keçiören and Etimesgut districts have been found to have a positive effect on the housing prices (Gökler A. L., 2017).
Çankaya, S. (2013) examines the relationship between the Housing Price Index (HPI) and selected macroeconomic variables among the 75 countries in different geographies between 1995 and 2012 by using the method of panel data analysis. As a result of the analysis, a statistically significant positive correlation was found between the Housing Price Index and annual loan interest rate, annual personal disposable income and gross domestic product, while a negative relationship was found between employment and population. However, when five subgroups are formed according to the geographical location of the countries included in the analysis, the results obtained vary according to the regions.
Kotseva and Yanchev (2017) analyzed the main economic factors affecting the house prices in the period of 2000-2014 divided into two different periods in Bulgaria by VECM. According to their estimated models, they found that housing prices in the first stage of rapid growth were in parallel with the increase in income and lowering of interest rates. Among the two phases of the valuation of the housing prices, they explained that there is a decrease in house prices, which is the main factors in the model, that is household income and mortgage interest rates. Restrictive measures for credit growth, which limits the growth of mortgage loans, are another factor for impairment in 2006. Current housing prices come,interest rates and external demand dynamics.
Structural vector autoregressive approach explains why real-estate prices show ups and downs in Germany, France, Italy, Sweden and the UK by macroeconomic indicators. Quarterly data was used GDP, house prices, money, inflation and
interest rates are characterized by a multivariate process. Real house prices are falling into a decline because of tight money (Iacoviello, M. , 2002).
In the study, 22 factors which affect the value of 340 houses (the data used in the study were taken from valuation reports prepared for 340 housing units suitable for housing loans) in various districts were subjected to multiple regression analysis. The results of the study showed that the income group addressing the region, the number of rooms, the number of balconies, the views, the car park and the interest rates affected the house prices. This study results can be used housing investment decision, tax and expropriation transactions, mortgage-backed housing transaction and other housing valuation (Küçükdoğan, D. , 2011)
In this study to examine the determinants of housing market prices; The real housing price index and the industrial production index (GDP), the real rent price index, the weighted average interest rate on interest rates and the volume of housing loans were estimated by the ARDL model. According to the results obtained, the increase in industrial production index (GDP) has a negative and significant effect on house prices.
1990 - 2006 period in Turkey in a study that analyzed the impact on housing prices macroeconomic variables affecting the decision to purchase housing individuals of interest rate is a crucial variable and interest rate increase in households that reduce effective demand towards the purchase of housing, while a change in the opposite direction to the housing bets increase effective demand; As a result of various studies, for example, it is foreseen that the increase in interest rates on long-term housing loans for Greece will lead to a decrease in housing prices, negative for housing prices and short-term interest rates for Indonesia and Hong Kong and negative for China, Korea and Singapore. and finally the 1990 - 2006 period to include long-term interest rates and housing prices in Turkey are set out to be a negative relationship (Badurlar, 2008: 235)
31
Turkey was the first to investigate the factors that affect housing prices, although the study conducted in 1981 observed that work in this area means satisfactory. Many different criteria were determined in different countries around the world. However, Turkey has also begun to be popular this workspace.
CHAPTER 3
DATA ANALYSIS AND METHODOLOGY
3.1. Research Model - 1
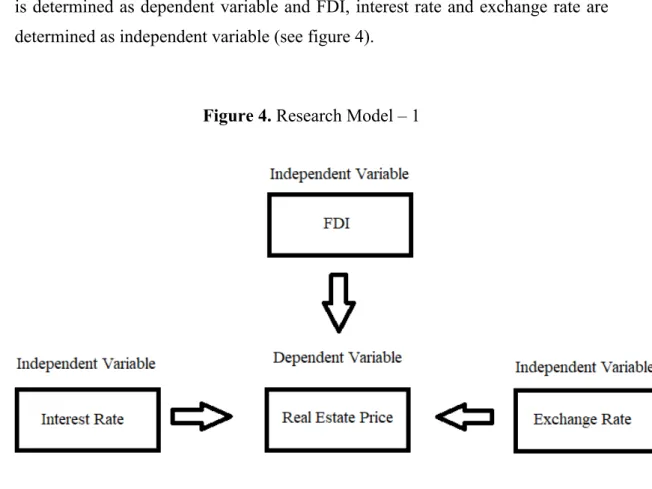
The main objective of this model is to find out the effect of FDI, interest rate and exchange rate on real estate price from 2010 to 2018 (monthly data). The real estate is determined as dependent variable and FDI, interest rate and exchange rate are determined as independent variable (see figure 4).
Figure 4. Research Model – 1
The data is derived from (CBRT) Central Bank of the Republic of Turkey (2019). Graphical explanation of the data that is worked on for İstanbul, Ankara and İzmir. (see figure 5,6,7).
35
First of all, in order to start Johansen co-integration test the series should be non-stationary. So continue with ADF Unit Root test to check variables are stationary or not.
In air transportation, CO2 emissions, energy consumption and GDP variables; the ADF unit root test is implemented. This test explains for the Akaike Information Criterion (AIC) and it testes the stability. As (Serena and Perron, 2001) recommended the maximum leg length to be 2.
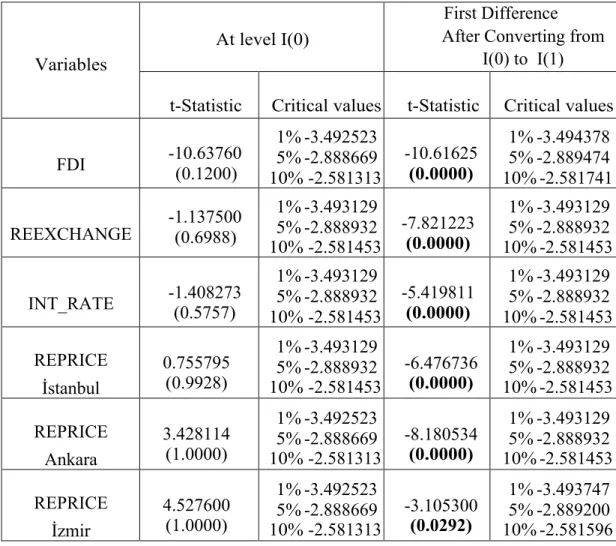
Table 8. ADF Unit Root Test Results at I(0) and I(1) for Istanbul & Ankara & İzmir
.
The major goal of ADF unit root test is determining the series’ structure in terms of its stationary or not.
Variables
At level I(0)
First Difference After Converting from
I(0) to I(1) t-Statistic Critical values t-Statistic Critical values FDI -10.63760 (0.1200) 1% -3.492523 5% -2.888669 10% -2.581313 -10.61625 (0.0000) 1% -3.494378 5% -2.889474 10% -2.581741 REEXCHANGE -1.137500 (0.6988) 1% -3.493129 5% -2.888932 10% -2.581453 -7.821223 (0.0000) 1% -3.493129 5% -2.888932 10% -2.581453 INT_RATE -1.408273 (0.5757) 1% -3.493129 5% -2.888932 10% -2.581453 -5.419811 (0.0000) 1% -3.493129 5% -2.888932 10% -2.581453 REPRICE İstanbul 0.755795 (0.9928) 1% -3.493129 5% -2.888932 10% -2.581453 -6.476736 (0.0000) 1% -3.493129 5% -2.888932 10% -2.581453 REPRICE Ankara 3.428114 (1.0000) 1% -3.492523 5% -2.888669 10% -2.581313 -8.180534 (0.0000) 1% -3.493129 5% -2.888932 10% -2.581453 REPRICE İzmir 4.527600 (1.0000) 1% -3.492523 5% -2.888669 10% -2.581313 -3.105300 (0.0292) 1% -3.493747 5% -2.889200 10% -2.581596
According to test result of ADF unit root test, FDI, exchange rate, interest rate and real estate price are not stationary at I(0) (see Table 8) for İstanbul, Ankara and İzmir. Thus we can continue with Johansen Co-integration test for İstanbul, Ankara and İzmir separately.
Research Hypothesis of Johansen Co-Integration test;
H1 There is a long-run relationship between real estate price and interest rate. H2 There is a long-run relationship between real estate price and FDI.
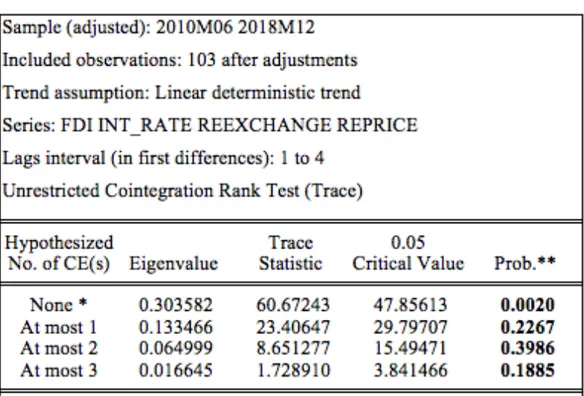
H3 There is a long-run relationship between real estate price and exchange rate. Table 9. Johansen Co-Integration Test Results for Istanbul
37
Table 10. Johansen Co-Integration Test Results for Ankara
According to results of Johansen co-integration test there is no a stable long-run relationship between exchange rate, interest rate, and real estate price and FDI for İstanbul (see Table 9). The p-value are 0.0090, 0.4497, 0.7988 and 0.4930 for Istanbul. Thus H1, H2 and H3 hypothesis are rejected as well. All econometrical procedures for Similarly results Johansen co-integration test for Ankara and Izmir as well (see table 10,11). There is no a stable long-run relationship between data. 3.1.2 VAR Analysis
Dynamic relationships between internal variables are estimated in VAR analysis. Therefore, in this approach, it is a great convenience for practitioners not to adhere to the strict economic theory in which the variable, which variable is internal variable, is not obligatory, and the strict economic theory in making the analysis (Charezma and Deadman, 1993: 181-182). The VAR model treats all selected economic quantities as a whole. In other words, variables or magnitudes in econometric studies conducted with the help of this model are examined simultaneously. Here, as in the theoretical models, there is no definite distinction between internal and external variables.
For testing VAR, variables should stationary. When the probability of variables are less than 0.05 (Table 2) cannot be analyzing VAR model. For that reason, the codes are used as “genr X1=X-X(-1)” to convert them from I(0) to I(1). The formula of codes are written as following below;
fdi1=fdi-fdi(-1),
genr reexchange1=reexchange-reexchange(-1) genr int_rate1=int_rate-int_rate(-1)
genr reprice1=reprice-reprice(-1)
After converting from I(0) to I(1) all series are performed as stationary (see Table 2). According to results of ADF unit root test at I(1), all series’ p-value is less than 0.05 and t-statistics are more than % 1, %5, and % 10 critical value at absolute
39
value. Thus, the VAR model test can be done with I(I) data on İstanbul, Ankara and İzmir Separetly. According to results of ADF unit root test at I(1), all series are converted as stationary (see Table 8) which is compulsory to perform VAR Analysis. Thus, continue to begin both impulse response and variance de-composition analysis.
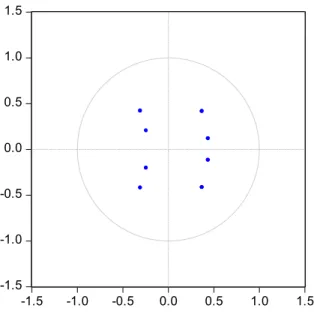
Figure 8. VAR Analysis of Istanbul
Figure 9. VAR Analysis of Ankara
-1.5 -1.0 -0.5 0.0 0.5 1.0 1.5 -1.5 -1.0 -0.5 0.0 0.5 1.0 1.5
Inverse Roots of AR Characteristic Polynomial
-1.5 -1.0 -0.5 0.0 0.5 1.0 1.5 -1.5 -1.0 -0.5 0.0 0.5 1.0 1.5
Figure 10. VAR Analysis of Izmir
The VAR model is implemented to make detailed analysis for the trends of four variables for İstanbul, Ankara and İzmir (see Figures 8,9,10). The FDI, interest rate, exchange rate and real estate price were selected as endogenous variables, which indicates the VAR. Moreover, after using the inverse roots of characteristic polynomial, all the features of root mean seems within the circle therewith for all cities.
Three ways can be obtained from the VAR analysis. “Granger causality”, “Variance De-Composition that shows the interaction between variables” and “impulse-response functions” are the ways used to obtain results in VAR (Özgen and Güloğlu, 2004: 6). Impulse response functions and variance de-composition of ways will be implemented.
The models are stationary VAR at Figures. 8,9,10 which gives an opportunity in order to implementing the impulse response analysis and variance decomposition.
-1.5 -1.0 -0.5 0.0 0.5 1.0 1.5 -1.5 -1.0 -0.5 0.0 0.5 1.0 1.5
41 3.1.2.1 Variance De-Composition Analysis
The variance de-composition gives information about the degree of causality relations between variables and expresses the sources of the shocks occurring in the variables themselves and in one of the other variables (Enders, 2010, pp. 305-309). Generally, it is a preferred analysis to determine the most effective variable above a macroeconomic sizes (Lutkepohl, 2005, p. 281).
Subsequently, variance decomposition model is performed to analyze the tenor of the linkage between relevant variables.
The results demonstrate that the impact of exchange rate is relatively more than interest rate on real estate price for Istanbul (see Table 12)
Table 12. Variance De-Composition of Real Estate Price - İstanbul
Period S.E. FDI1 INT_RATE1 REEXCHANGE1 REPRICE1 1 20.13815 0.069458 0.204509 5.292302 94.43373 2 22.01040 0.989097 0.994115 4.463274 93.55351 3 22.97451 2.043984 1.191279 7.925332 88.83940 4 23.23121 2.173323 1.255784 9.127302 87.44359 5 23.27495 2.209598 1.334484 9.109611 87.34631 6 23.32589 2.222794 1.567827 9.146803 87.06258 7 23.35760 2.216774 1.688486 9.221347 86.87339 8 23.36725 2.220600 1.715743 9.248049 86.81561 9 23.36788 2.220815 1.717640 9.249407 86.81214 10 23.36792 2.220863 1.717754 9.249587 86.81180
The results demonstrate that the impact of interest rate and exchange rate are relatively equal on real estate price for Ankara (see Table 13).
Table 13. Variance De-Composition of Real Estate Price – Ankara
Period S.E. FDI1 INT_RATE1 REEXCHANGE1 REPRICE1 1 6.864940 0.230483 0.438115 3.009651 96.32175 2 7.269934 0.516353 5.020157 5.025016 89.43847 3 7.342882 0.524518 6.066020 5.739082 87.67038 4 7.392347 0.582292 6.719964 6.131950 86.56579 5 7.405399 0.601117 6.833176 6.300272 86.26544 6 7.407209 0.602854 6.832247 6.322207 86.24269 7 7.408935 0.602585 6.851297 6.320936 86.22518 8 7.410067 0.603295 6.866451 6.325597 86.20466 9 7.410230 0.603355 6.868013 6.327742 86.20089 10 7.410263 0.603351 6.868265 6.327770 86.20061
The results demonstrate that the impact of interest rate is relatively more than exchange rate on real estate price for Izmir (see Table 14).
Table 14. Variance De-Composition of Real Estate Price - İzmir
Period S.E. FDI1 INT_RATE1 REEXCHANGE1 REPRICE1 1 13.38060 1.872678 3.212146 1.278962 93.63621 2 14.06948 3.312401 6.132525 1.869489 88.68558 3 16.32105 2.593329 15.59755 4.387977 77.42115 4 16.84058 2.708751 16.32073 4.613920 76.35660 5 17.68799 2.547927 21.22816 4.846369 71.37755 6 18.11869 2.428422 23.45637 5.511844 68.60337 7 18.33621 2.374215 24.79229 5.811557 67.02194 8 18.42481 2.357447 25.28324 5.968955 66.39036 9 18.45850 2.357410 25.35880 6.041299 66.24249 10 18.47424 2.360170 25.32802 6.055059 66.25676
3.1.2.2 Impulse Response Analysis
Variance De-Composition and the effect-response functions are the 2 analysis that help us find out the live interaction between variables in consideration and the symmetrical
43
relations. Impulse-response functions show the impact of standard deviation on random errors on the present and future internal variables.
The most effective variable above a macroeconomic size is the effect-response functions, whether or not this variable, which is found effective by the variance decomposition, can be used as a policy tool. (Var, Uğur, 2005.75).
Impulse response analysis is implemented for Istanbul, Ankara and İzmir (see Figures 11,12,13)
Figure 11. Impulse Response Analysis - İstanbul
-5 0 5 10 15 20 1 2 3 4 5 6 7 8 9 10 FDI1 INT_RATE1 REEXCHANGE1 REPRICE1
Response of REPRICE1 to Cholesky One S.D. Innovations
The results shows that the impact of exchange rate is relatively more than interest rate and FDI on real estate price for Istanbul (see Figure 11)
Figure 12. Impulse Response Analysis - Ankara
The results shows that the impact of interest rate is relatively more than exchange rate and FDI on real estate price for Ankara (see Figure 12)
-2 -1 0 1 2 3 4 5 6 7 1 2 3 4 5 6 7 8 9 10 FDI1 INT_RATE1 REEXCHANGE1 REPRICE1
Response of REPRICE1 to Cholesky One S.D. Innovations
45
Figure 13. Impulse Response Analysis – İzmir
The results shows that the impact of interest rate is relatively more than exchange rate and FDI on real estate price for İzmir (see Figure 10)
The results of variance decomposition is consistent with the impulse response as well for İstanbul, Ankara and İzmir.
3.2. Research Model – 2
The first study was not evaluated as a whole. Panel Analysis method was chosen for both cross-section and time-section analysis.
As a result of the first analysis, FDI 's effect proved to be very low. So it was removed and replaced by "oil price" as it is one of the most important indicators of the economy. -8 -4 0 4 8 12 16 1 2 3 4 5 6 7 8 9 10 FDI1 INT_RATE1 REEXCHANGE1 REPRICE1
Response of REPRICE1 to Cholesky One S.D. Innovations
The time series data used in this model were collected from the period of 2010 – 2018 (monthly data). From 2010 to 2018 includes 108 months. Datas of this panal analysis is to find out the effect of interest rate, exchange rate of dolar and oil price on real estate price index. The data is derived from (CBRT) Central Bank of the Republic of Turkey on April. The real estate price index is determined as dependent variable and interest rate, exchange rate of dolar and oil price are determined as independent variable .
3.2.1 Panel Data Specification
Panel data analysis, cross-sectional and time-series data is an analysis that is evaluated together. The cross-sectional data shows the values of many units in a single time period, while the time series data shows the values of a single unit at various times. If the data set contains the values of several units at various times, it is best to use panel data.
𝑌#$ =b&+b(𝑋#$+ 𝑢#$ (3.1)
Where
– β0 is the constant parameter
– Yit is the dependent variable (DV) where i = entity and t = time.
– Xit represents one independent variable (IV),
– β1 is the coefficient for that IV,
47 3.2.2. Unit and Time Effect Testing
In this study İzmir , Ankara and İstanbul are using a Cross sectional data. From 2010 to 2018 (monthly data) is using for Time Series data testing.
Table 15. Test of Unit Effect
Random-effects Parameters Estimate Std. Err. [95% Conf. Interval] _all: Identity
sd(R.id) 19.34005 7.996824 8.600002 43.49274 sd(Residual) 22.76388 . 8984186 21.06939 24.59464 LR test vs. linear model: chibar2(01) = 162.95 Prob >= chibar2 = 0.0000
Table 16. Test of Time Effect
Random-effects Parameters Estimate Std. Err. [95% Conf. Interval] _all: Identity
sd(R.t) 14.71034 2.100452 11.11941 19.46093 sd(Residual) 28.42893 1.141893 26.27669 30.75745 LR test vs. linear model: chibar2(01) = 0.00 Prob >= chibar2 = 1.0000.
𝑌#$ = b&#+ +, b, 𝑋,#$+ 𝑢#$
,-( (3.2)
Since the constant parameter is heterogeneous (b0i ¹b0j) according to time, it has
been determined that the model is a one-way unit effective model. µt is included in
the model to represent the unit effect. The expression as (b&+µ$) in model (3.3) can also be expressed as number (b&$) as in model 3.4.
𝑌#$ =b&+µ$+ b(𝑋#$+ 𝑢#$ (3.3)