Optimization of the Magnetic Anomaly Signals from a New Land Mine
Detection Device
SALIH SÖYLER
1,3, EROL KURT
2, OBEN DAĞ
31,3
Directorate of Inspection and Assessment Branch,
Commandership of Schools, 10100, Balıkesir, Turkey
[email protected]
2
Department of Electrical & Electronics Engineering, Faculty of Technology
Gazi University, 06500 Teknikokullar, Ankara, Turkey
[email protected]
3
Department of Electrical & Electronics Engineering
Yeditepe University
26th August Campus, 34755, Istanbul, Turkey
[email protected]
Abstract: - Magnetic optimization studies have been carried out for a new magnetic anomaly (MA) device in order to detect the land mines. This device will use an artificial neural network algorithm for the classification of magnetic materials to diminish the mines from other magnetically detectable bodies. Therefore an efficient planar sensor network has been constructed in order to detect the field anomalies. The device operates fast and requires some preliminary tests to increase the measurement accuracy and reliability. In this manner, the magnetic responses of different materials should be ascertained for different distances to MA device. It operates under 24 ACV and includes a square looped Helmholtz coil system and plenary arranged 20 small field detection coils. Preliminary optimization studies have proven that the MA device can diminish the magnetic materials and its reliability can be enhanced further by measuring different material types in order to produce a solid operation achieve for diminishing the mines according to the neural network learning.
Key-Words: - Magnetic anomaly, Helmholtz coil, Mine detection, land mine detector
1 Introduction
Magnetic anolmaly (MA) technique has been used for many different applications for some decades. The most recent study compares the range prediction models of radar, infrared, sonobuoy and magnetic anomaly detector in the ocean environment [1]. Zhi-zhong and Ri-jie have proven that these methods for submarine searches provide effective solutions. MA technique has also been used in order to have essential information about parking occupancy and traffic flow [2]. There, magnetic sensors have magnetoresistive characters and operate with 3V. Sheinker and colleagues have used MA to detect the ferromagnetic objects, particularly hidden targets [3]. The detection of a moving ferromagnetic target has been realized by a static three-axis referenced magnetometer, succesfully. Nazlibilek and colleagues have proposed a new sensor network using the MA technique in order to detect the antitank and antipersonnel mines [4]. They have used a new algorithm called the back-most object detection and
identification in order to eliminate false alarms. Another recent study has dealt with detection of both dielectric and magnetic characteristics of the targets, starting from GPR data collected at the interface air/soil [5]. MA technique was also considered together with the adjustable weight functions in order to make detection in the corresponding systems [6]. For instance, the detection of vehicles under the depth water was realized by using a superconducting gradiometer where MA technique stands [7]. Moreover, high Tc SQUID Gradiometers were used for the first time in 2001 for mobile MA measurements [8]. Later on, the 3D mapping features in MA measurements were introduced in the air media including a digital magnetometer [9,10]. On the other hand, in 2006, the first neural classification of MA was realized in a magnetic movement [11]. In the following years, MA measurements have been especially intensified on the eddy currents and three-axial magnetometer was also used in order to detect MA [12,13].
MA which states that any magnetic material being in a magnetic field changes the natural pattern of the field is used in order to detect the land mines. Strictly speaking, MA technique has been rarely applied for such kind of problem to our knowledge. For instance, an interesting study, the paper of Nazlibilek et al [4] can be given as an MA application on mine detection. In fact, ground-penetrating radar (GPR) and sonar imaging techniques are widely used [14,15]. However these techniques are relatively expensive and include a high rate of fault outputs due to the natural magnetic materials or wastes. Our proposed device will apply that technique with an artificial neural network classification. The first principle for this network classification is to determine the field anomalies of different materials having various shapes for the neural network databank in order to make a comparison process later on when the real practice on the ground is realized. Therefore, the anomaly values recorded on a 2D plane depending on the material type and shape are explored, experimentally in order to construct the initial step for the artificial neural network (ANN) study. The enhancement of the classification in any ANN scheme becomes successful if the MA data of more materials are measured by the detector. In fact, the reliability of this method depends on receiving the 2D anomaly pattern of different materials. Thus one can separate the land mines from the other metallic wastes and natural objects easily [16]. We believe that after the compilation of the required anomaly database of different materials, this detection mechanism can be a strong candidate to detect the land mines by using the MA technique.
The paper consists of three sections: Initially some background on the magnetic anomaly procedure is given in Section 2. The experimental setup, main results and discussions are given in Section 3. The last section presents the concluding remarks and future ideas on the proposed system.
2 Magnetic Anomaly
Helmholtz coils are frequently used to generate homogeneous magnetic field along the centre of coils [11,12,13].In this study, the magnetic field is also generated by a set of Helmholtz coils. In any magnetic media, the anomalies produced by the external materials will be determined by a number of anomaly-sensitive sensors.
The optimal numbers of the sensor coils and their positions can be determined by the help of the power usage and the achievement of detection. An anomaly operation can be stated as follows: Initially a homogeneous magnetic field is generated via a
Helmholtz coil. Then the material is put inside the field. After that procedure, the eddy currents induce on the testing material being in the magnetic media. Then these currents can be read out by the field detection coils and the signals are digitalized for individual coils in order to get an anomaly pattern of the material on a 2D plane. At the last step, these characteristic signals can be processed in the computer system.
As will be shown later in the experimental, a number of different units have been designed for the magnetic anomaly measurements. Our MA system consists of a set of Helmholtz coil, an AC signal generator, planery positioned detectation coils, a signal amplifier which amplifies the signal coming from the sensors, an analog-digital convertor (ADC), an artificial neural network (ANN) unit and a power source unit, which operates at 24 V and 1 A and feeds the monitoring part. According to the results of different materials, different anomaly patterns are observed with respect to the response of eddy currents (i.e. the amplitude of anomaly signals change w.r.t the material type and shape).
3 Experimental and Results
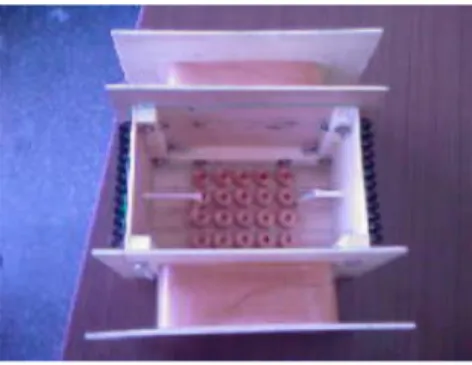
A photo of the MA device is shown in Fig. 1. The measurement part of the experimental setup includes a power card which supplies the required power for the operation, two a set of Helmholtz coils which generate the field pattern, 20 small anomaly detecting coils, an amplifying circuit, an analog-to-digital converter and an ANN unit.
In the experiments, the operating voltage and the frequency of field generating Helmholtz coils are used as 10-24 V and 50-500 Hz, respectively. These coils are made by 1mm diameter Copper wire with 500 turns. The optimal amplitude and frequency are found as 24 V and 50 Hz for their optimal operation since one needs a homogeneous field pattern between these coils. Between the field-generating Helmholtz coils, a two-dimensional spatial sensor is
constructed. This sensor system has 20 detection coils having 1 cm thickness, 2 cm length, 1000 turns and made by 0.15 mm diameter Cu wire have been positioned. The detecting sensors are positioned to the plane parallel to the axial direction of Helmholtz coils. 3 mm distance between the successive sensor coils is applied in order to eliminate the self sustained magnetic effects of the coils. The block diagram of the overall system can be given in Fig. 2.
An integrated circuit card includes the input and output circuitries for both the detecting sensors and the field-generating coils. Thus this prototype device has already a portable circuit design which has the magnetic field generator and detector units. Initially, we have started with the field pattern without any material around the device. Thus we aim to measure the 2D anomaly pattern of the device itself. That is required due to the fact that the positions of coils and other physical parameters such as the directions of coils and length of the sensor coils may slightly differ from the others in the real device. The anomaly pattern will then be easily used in order to compare the different anomaly patterns when different magnetic materials are put around the device. In other words, field measurements at the lack of magnetic materials will be used as a comparison pattern for other measurements when a magnetic material is put around the device. Another reason for this first step is to determine the appropriate voltage V, current I and frequency f regime as well as the amplification rates of the sensor signals. Strictly speaking, the best operation condition can be catched by the appropriate adjustment of the parameters of field coils and detector coils.
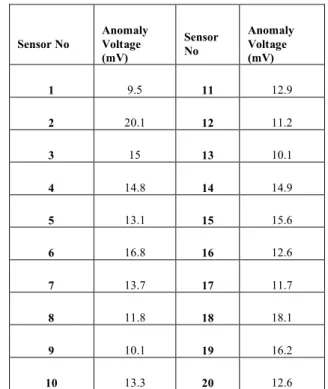
3.1 Field Measurements at the lack of body After a long testing process with magnetic-material-free device, it has been found that the device optimally operates under 12 Volt and 50 Hz feeding signal for Helmholtz coils. It should be underlined that these tests have been carried out for the determination of the anomaly pattern when nothing sits near the device. A detailed list of the anomaly voltages on the sensor coils shown in Fig. 3 are given in Table 1.
Table 1. Anomaly voltages on sensors without material. Sensor No Anomaly Voltage (mV) Sensor No Anomaly Voltage (mV) 1 9.5 11 12.9 2 20.1 12 11.2 3 15 13 10.1 4 14.8 14 14.9 5 13.1 15 15.6 6 16.8 16 12.6 7 13.7 17 11.7 8 11.8 18 18.1 9 10.1 19 16.2 10 13.3 20 12.6
A much clear method of visualizing the anomaly voltages is to found a 2D pattern on a plane. Thereby one can see the overall values of sensors as in Fig. 3. The field coils aligned at the direction of y axis. It is seen that the field is larger at the
HELMHOLTZ COIL HELMHOLTZ COIL SENSORS POWER SUPPLY ANALOG AMPL. CIRCUIT ANALOG TO DIGITAL CONVERTER ARTIFICIAL NEURAL
NETWORKS AND THE PROCESSING UNIT VIEWS
Figure 2. The block diagram of the planned mechanism.
Figure 3. Anomaly pattern. Note that the Helmhotz coils align parallel to y axis.
peripherical regions along x axis. However the field creates a valley along the x-axis. In addition, the field has minima at the sensor no 1 and maxima at the sensor 2. This anomaly pattern will be used in the comparison process of other patterns taken from different materials.
3.2 Field Measurements for iron body
In order to determine the anomaly pattern in the existence of a iron body with the dimensions of 3.5x3.5x30 cm3, we have put an iron profile positioned 1 cm below the sensor group (Fig. 4).
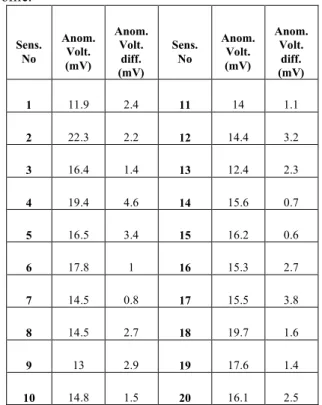
Table 2. The magnetic anomalies in the case of an iron profile. Sens. No Anom. Volt. (mV) Anom. Volt. diff. (mV) Sens. No Anom. Volt. (mV) Anom. Volt. diff. (mV) 1 11.9 2.4 11 14 1.1 2 22.3 2.2 12 14.4 3.2 3 16.4 1.4 13 12.4 2.3 4 19.4 4.6 14 15.6 0.7 5 16.5 3.4 15 16.2 0.6 6 17.8 1 16 15.3 2.7 7 14.5 0.8 17 15.5 3.8 8 14.5 2.7 18 19.7 1.6 9 13 2.9 19 17.6 1.4 10 14.8 1.5 20 16.1 2.5
After this orientation, the voltages on the sensors have been measured as in Table 2. In addition, the anomaly differences w.r.t the first case are also given in the same table. Since the anomaly difference gives a better view with the earlier case,
the pattern of voltage differences are shown in Fig. 5. It is obvious that the anomaly difference is maximal at the middle of pattern. Whereas the peripherical region does not show too much difference w.r.t the initial pattern. The reason for that is that the iron material has been put closed to the sensors located at the middle of the detector. The detailed analyses have proven that the the difference also moves on the pattern, when the material is moved further.
3.3 Circular Mine-production Steel
This subsection includes the test with the special steel which is used to make mines. The material has a disc shape with 13 cm diameter and 1 cm thickness. This disc is frequently used for the production of circular-shaped land mines. The measurements were taken after the material was put 4 cm below the sensors (Fig. 6).
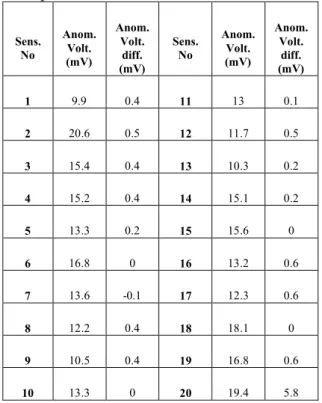
By using the same methodology, the anomaly voltages as well as the anomaly voltage differences have been measured as in Table 3. Note that the differences have been taken with respect to the initial case, in which there is no material. According to Table 3, while the minimal anomaly difference is
Figure 6. The device measuring the anomaly of a disc-shaped part of a land mine.
Figure 4. Flat iron the material when the Helmholtz coils and the sensor group
Figure 5. The anomaly difference of iron profile w.r.t the initial case
-0.1mV at the sensor 7, the maximal one is 5.8mV at sensor 20.
Table 3. The magnetic anomalies in the case of a disc-shaped mine steel.
Sens. No Anom. Volt. (mV) Anom. Volt. diff. (mV) Sens. No Anom. Volt. (mV) Anom. Volt. diff. (mV) 1 9.9 0.4 11 13 0.1 2 20.6 0.5 12 11.7 0.5 3 15.4 0.4 13 10.3 0.2 4 15.2 0.4 14 15.1 0.2 5 13.3 0.2 15 15.6 0 6 16.8 0 16 13.2 0.6 7 13.6 -0.1 17 12.3 0.6 8 12.2 0.4 18 18.1 0 9 10.5 0.4 19 16.8 0.6 10 13.3 0 20 19.4 5.8
The overall appearance of the anomaly pattern is shown in Fig. 7. The anomaly at sensor 20 gives a hill at the corner which is different from the case where the iron profile was used. When the averaged values of Table 2 and Table 3 are compared, the values at Table 2 are larger since the distance between the test material and sensor is twice of the earlier case. This feature also underlines the importance of the distance between the object and the device.
3.4 Square-shaped mine-production Steel The fourth test has been realized by a square-shaped mine-production steel, which has the
dimensions of 10x10x1cm3. The material has been put 4.5 cm behind the sensors (Fig. 8). The complete list of the anomaly values have been indicated in Table 4.
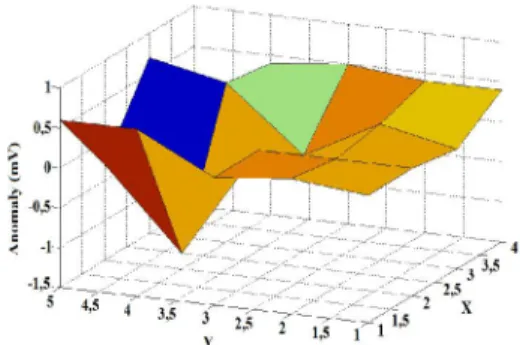
Table 4. Anomaly values in the case of a square-shaped mine-production steel Sens. No Anom. Volt. (mV) Anom. Volt. diff. (mV) Sens. No Anom. Volt. (mV) Anom. Volt. diff. (mV) 1 9.6 0.1 11 12.6 -0.3 2 20.2 0.1 12 11.7 0.5 3 15 0 13 10.5 0.4 4 15.2 0.4 14 15.4 0.5 5 13.5 0.4 15 15.3 -0.3 6 17 0.2 16 13.2 0.6 7 13.8 0.1 17 12.3 0.6 8 12 0.2 18 17.8 -0.3 9 10.2 0.1 19 16.9 0.7 10 13.4 0.1 20 13.3 -0.3
In a detailed analysis, the minimal and maximal values are read as -0.3mV from sensors 11, 15, 18, 20 and 0.7mV from sensor 19, respectively. In this test, the anomaly differences have a much changeable character compared to the earlier cases. Strictly speaking, there exist a few hills and deep points on the anomaly pattern shown in Fig. 9. The anomaly changes point out the effect of the magnetic material. The sensors near the test material give higher anomaly values.
Figure 8. A square-shaped mine-production steel is measured.
Figure 7. The magnetic anomaly differences of the disc-shaped mine steel w.r.t. the initial case.
4
Conclusion
The results of four different tests have been presented to optimize the the land mine detector for the formation of the artificial neural network (ANN) database. The fast responses of the sensors make this device a good candidate for the future detection solutions. In terms of ANN, the characteristic anomalies of four different materials have been recorded for the future detection to distinguish the magnetic bodies from the environment. The results prove that one needs to make further measurements at different distances in order to increase the reliability of the proposed device. The anomaly values show strong dependence to the position of the test material, thus it should be stated that the device should be moved in a certain velocity on the ground in order to detect the anomaly signals. For further research, we will improve the ANN database for different materials and try to diminish the mine structures form other magnetic materials.
References:
[1]J. Zhi-zhong, Y. Ri-jie., “Research on Modeling
for Real Time Range Prediction of Airborne Submarine Search Sensors Eng.”, 19-20 Dec. 2010,
vol: 1 pp 41 – 44, 22 Feb 2011.
[2]E. Sifuentes, O. Casas, R. Pallas-Areny, E. Sifuentes., “Wireless Magnetic Sensor Node for Vehicle Detection with Optical Wake-up”, IEEE
Sensors Journal, vol:99, pp: 1 – 1, 2011.
[3]A. Sheinker, L. Frumkis, B. Ginzburg, N. Salomonski, B.-Z. Kaplan,,”Magnetic Anomaly Detection Using a Three-Axis Magnetometer”,
IEEE Transactions on Magnetics, Vol: 45, pp: 160 –
167, 2009.
[4]S. Nazlibilek, O. Kalender, Y. Ege, “Mine Identification and Classification by Mobile Sensor Network Using Magnetic Anomaly”, IEEE Transactions on Instrumentation and Measurement, vol: 60, pp: 1028 – 1036, 2011.
[5]R. Persico, S. Negri, F. Soldovieri, E. Pettinelli, “Dielectric and magnetic anomaly imaging from GPR data”, 13. International Conference on Ground
Penetrating Radar (GPR), pp: 1 – 5, 16 Agus 2010.
[6]K. Mori, “Detection of Magnetic Anomaly Signal by Applying Adjustable Weight-Functions”,
IEEE Transactıons on Magnetics, vol: 26,
pp.1083-1087, Mar 1990.
[7]T.R. Clem, D.J. Overway, J.W. Purpura, “Enhanced magnetic anomaly detection using a nitrogen-cooled superconducting gradiometer”, Proc. The Society of Photo-Optical Instrumentation Engineers (SPIE) vol: 4039, pp.70-84, 2000. [8]Overway DJ, Purpura JW, High-T-c SQUID gradiometer for mobile magnetic anomaly detection, IEEE Vol: 11, pp. 871-875 Mar 2001.
[9]T.E. Tobelyl, A.Salem, “Position Detection of Unexploded Ordnance from Airborne Magnetic Anomaly Data Using 3-D Self Organized Feature Map”, IEEE International Symposium on Signal
Processing and Information Technology (ISSPIT),
vol. 1&2, pp.322-327, 2005.
[10]J.J. Braithwaite, “Using Digital Magnetometry to Quantify Anomalous Magnetic Fields Associated with Spontaneous Strange Experiences: The Magnetic Anomaly Detection System (MADS)”, J.
Parapsychology., vol: 69, pp.151-171, 2005.
[11]I. Miller, S. McGlinchey, “A Neural Classifier for Anomaly Detection in Magnetic Motion Capture“, 5. International Conference on Entertainment Computing – ICEC, vol: 4161, pp.141-146, 2006.
[12] Sheinker A, Frumkis L, Ginzburg B, Magnetic Anomaly Detection Using a Three-Axis
Magnetometer,IEEE Transactions On
Magnetics, Vol. 45, pp, 160-167, Jan 2009
[13] Kosmas K, Hristoforou E, The effect of magnetic anomaly detection technique in eddy current non-destructive testing, International Journal Of Applied Electromagnetics And Mechanics, vol.:
25,pp. 319-324 2007
[14]O. Missaoui, H. Frigui, P. Gader, ” Land-Mine Detection With Ground-Penetrating Radar Using Multistream Discrete Hidden Markov Models”,
IEEE Transactions on Geoscience and Remote Sensing, vol:99, pp: 1 – 20, 2010.
[15]Guo WM, Szymczak WG, Multiresolution neural networks for mine detection in side scan sonar images, Proceedings of The Society of Photo-Optical Instrumentation Engineers (SPIE), vol. 3392, pp. 297-305, 1998.
[16]S. Haykin, 1999, Neural Networks: A
Comprehensive Foundation, Prentice Hall International. Inc., New Jersey.
Figure 9. Anomaly pattern in the case of a square-shaped mine-production steel