144
Chapter 9
DOI: 10.4018/978-1-5225-5757-9.ch009
ABSTRACT
This chapter aims to analyze the financial and economic effects on green supply chain management of the food and beverages industry. For the research purpose, the fuzzy DEMATEL and fuzzy MOORA methods are used for the integrated model construction. The main stages of the green supply chain are considered as the dimensions and the selected performance measures are listed as a set of criteria for each dimension. Accordingly, 21 food and beverage companies listed in Istanbul Stock Exchange (BIST) are employed to measure the performance of green supply chain processes. It is concluded that low pol-lution is the most important criterion whereas alternatives has the least weight. Reverse logistic is also second most significant criterion which means that these companies give importance to reduce their costs. It is also found out that there is not a certain correlation between green supply chain management performances with the profitability of the firms. However, it can be seen that bigger firms have higher green supply chain management performance than the smaller firms.
Evaluation of Financial and
Economic Effects on Green
Supply Chain Management
With Multi-Criteria
Decision-Making Approach:
Evidence From Companies Listed in BIST
Hasan Dinçer
İstanbul Medipol University, Turkey
Serhat Yuksel
Istanbul Medipol University, Turkey
Tuba Bozaykut-Buk
Evaluation of Financial and Economic Effects on Green Supply Chain Management
INTRODUCTION
The interconnectedness of customer satisfaction and firm performance make green supply chain manage-ment (GSCM) as one of the most discussed and analyzed topics during the last decade. The foremost reasons behind the popularity of GSCM are the increase in the environmental awareness (Sari, 2017), the share of logistic costs in the finished products (Nikbakhsh, 2009), meeting stakeholder needs (Sriv-astava, 2007) and social sustainability (Fahimnia et. al., 2015). Also, these motives refer to the driving forces to adopt GSCM practices for competitive superiority. Moreover for firms, institutional pressures like ISO4001 certification indicate environmental management as a strategic issue for both economic and environmental performance (Diabat and Govindan, 2011). Thereby, greening through environmental standards is a factor of market success (Min and Galle, 1997) by enhancing competitiveness, resource productivity and innovation (Porter and van der Linde, 1995).
Through globalization, firms’ coordination in the supply chains turns out to be the most critical business success factor (Lambert et. al., 1998). As a consequence, the management philosophy that starts with logistics management evolving to GSCM is an outcome of global markets and “globalization of supply” (Mentzer et. al., 2001:2). Besides globalization of supply, GSCM develops for predicting, minimizing and preventing environmental harms given by supply chain operations (Beamon, 1999; Sari, 2017). Thereby as an attempt to form an ecological nature for an organization, green supply chains (GSC) refers to “developed and advanced form of traditional supply chains with a special aim of reducing the environmental harm given during a product’s life cycle” (Mishra et.al, 2017:86). Parallel to these, GSCM comprises elements of both corporate environmental management and supply chain management (Srivastava, 2007; Laari et. al., 2017). In line with this thinking, GSCM consists of numerous R activities (e.g. reduce, re-use, and recycle) (Sirvastara, 2007). These R activities provide firms to coordinate their purchasing, production and distribution processes in an environmentally-friendly manner for a better economic, ecological, operational, and social performance (Geng et. al., 2017).
Therefore, it is of paramount importance to determine the key factors of GSCM and measure GSCM performance in terms of these components. Concordantly, the current study aims (1) to present a literature review of determinants of GSCM, (2) to examine key components of green supply chain management and develop a multidimensional model for GSCM performance (3) to test the model through fuzzy-based decision making methodology, (4) to show which dimensions and criteria are more critical for a sustainable GSCM performance (5) help decision makers and researchers develop appropriate guidelines for GSCM success.
In line with these given aims, the paper continues with relevant literature on GSCM, its dimensions and its effects on firm performance. Following literature, the research methodology and the application of this methodology on 21 Food and Beverage companies listed in Istanbul Stock Exchange is discussed. Finally, the findings together with future implications are given.
THEORETICAL BACKGROUND
Supply Chain Management
As a management philosophy, supply chain management (SCM) has evolved from logistics management with a claim to enlarge the boundaries of the traditional understanding of logistics. Standing from this stance, SCM is defined by the Council of Logistics Management in 1986 as “the process of planning,
Evaluation of Financial and Economic Effects on Green Supply Chain Management
implementing, and controlling the efficient, cost-effective flow and storage of raw materials, in-process inventory, finished goods, and related information flow from point-of-origin to point-of-consumption for the purpose of conforming to customer requirements” (Lambert and Cooper, 2000:67). The definition of the Council of Logistics Management directs two important points. The first is to incorporate business operations with the support of external firms in the supply chain and the second is to involve customers to these operations for an understanding of customer needs (Cooper et. al., 1997).
Besides being a management philosophy, the supply chain is also evaluated as a process through which the flow of information starts from suppliers and ends with customers. Parallel to this approach, a supply chain is the dynamic network of firms that exchanges information, money or materials for production (Jain et. al., 2009) and as a network of firms, a supply chain generally includes suppliers, manufacturers, distributors, retailers and customers. Thereby, the main objective of supply chain management (SCM) “is to provide right product to the right customers at the right cost, right time, right quality, right form and right quantity” (Chin et. al., 2015). Also managing the supply chain includes integrating “key business processes from end-user through original suppliers that provide products, services, and information that add value for customers and other stakeholders” (Lambert et. al., 1998).
Similarly to successfully implement SCM, all firms in the chain are to be interconnected by embrac-ing a process approach and organizembrac-ing functions as key processes for their operations (Lambert et. al., 1998). More to that, SCM that designs each key process to meet customer requirements aims to minimize costs, enhance customer satisfaction and have a competitive advantage (Mentzer et. al., 2001). To reach these objectives, the perspective of being “green” has recently added to the activities of SCM. Therefore, procurement, manufacturing, distribution and logistics activities are reorganized and extended with an environmentally-conscious attitude.
Green Supply Chain Management
GSCM can be defined as “the sum of green purchasing, green manufacturing and material management, green distribution and marketing, and reverse logistics” (Mishra et. al. 2017: 86). As the definition clearly points out GSCM combines economic, social and environmental goals within its scope (Kafa et. al. 2013). One of the critical key terms for GSCM success is sustainability (Dubey et. al., 2015) and hence, being green is mostly associated with being “sustainable” (Baines et. al., 2012). The business sustainability covers meeting current and future economic, social and environmental demands in a proactive manner for future success. That’s to say, being sustainable means that operations are conducted regarding cur-rent and future needs of people and nature. Concordantly, the sustainability vision is mentioned within Triple Bottom Line (3BL) framework that determines “organizational and societal success through the three Ps of people, planet and profit” (Baines et. al., 2012:60).
Generally, firms adopt GSCM practices in three manners (Agi and Nishant, 2017). The first one is related with market based pressures and includes adopting voluntary proactive strategies to improve corporate brand, meet environmental regulations, influence customers and hence to have a competi-tive superiority over others in the market (Agi and Nishant, 2017). The second is associated with legal, governmental regulations set for environment. And the third manner emerges as a result of customer or supply chain partners’ needs for environment sensitive products or processes.
For being sustainable, GSCM covers all business partners and GSCM efficiency can’t be attained only to the lead company. In line with this, GSCM is to form the synergetic bond between partners and has to assure all partners’ success together with increased environmental/economic performance and
Evaluation of Financial and Economic Effects on Green Supply Chain Management
competitiveness (Rao and Holt, 2005). Therefore, to keep their business operations green, each partner in the chain has to be aware that GSCM practices would enhance their economic performance. The re-ducing costs, increasing profits and the synergetic cooperation of suppliers in decision making processes are the main drivers for adopting GSCM practices in the chain (Rao and Holt, 2005).
Additionally, numerous studies point out that adopting GSCM practices positively influences per-formance of companies. For instance, better environmental and operational perper-formance is achieved if green perspective is carried on from production to recycling (Jabbour et. al., 2015). Environmental performance is an outcome of environmental management (Albertini, 2015), while operational perfor-mance is the degree to meet customer needs. Current consumers are becoming more environmentally conscious and more inclined to buy environmentally-friendly products. Within this framework, GSCM practices influence consumers’ approach to the firm and its products; and in return increase the firm’s competitiveness and economic performance (Andiç et. al., 2012). Consequently, making the supply chain “green” reduces the harms given to the environment, and affirms the environmentally-friendly image that can respond to the needs of today’s environmentally concerned consumers.
Determinants of Green Supply Chain Management
Researchers have given remarkable attention to determine the main elements of GSCM. The first thing to be noticed in the related literature is that much of the studies categorize determinants of GSCM as internal and external factors (Sarkis, 2003). Internal GSCM practices refer to firm’s environmentally- friendly activities (Azevedo et. al., 2011). On the other hand, external elements take a strategic stance because organizations act based on actors and changes in their environment (Mintzberg, 1994). From the perspective of GSCM, partners in the supply chain and the level of greenness in their operations come to the fore as critical factors of GSCM success. External GSCM activities also include environmental monitoring and environmental collaboration (Vachon and Klassen, 2006). Environmental monitoring is related with supplier and material selection; whereas environmental collaboration is associated with helping suppliers’ to develop their environmental qualifications (Vachon and Klassen, 2006). More to that, institutional norms (Zhu et. al. 2007; Sarkis et. al. 2011) like governmental regulations and customer requirements (Laosirihongthong et. al., 2013) can be regarded as other significant external elements for adopting GSCM practices. To the numerous studies, influence of institutional pressures is closely related with market dynamics and governmental regulations (Srivastava, 2007; Laosirihongthong et. al., 2013). A proper example can be the widely adoption of ISO 14001 because of customer pressure (Vachon 2007).
To prove these forces empirically, numerous studies are conducted. For instance, Laosirihongthong et. al. (2013) proved that legislation and regulation is the most important driving force for GSCM imple-mentation by Thai manufacturers. On the other hand besides government regulations, Kafa et. al. (2013) determine stakeholder pressures, economic interests, and ecological interests of firms as important forces of GSCM practices. Among the studies on GSCM performance factors, Sarkis (2003) takes product life cycle, operational life cycle, performance measures, and environmentally influential organizational policy elements for GSCM achievement. Moreover, Sarkis (2003) also highlights the importance of combining organizational processes like reduce or reuse both with all the supply chain activities and the product life cycle. Similarly, Zhu and Sarkis (2004) determine internal environmental management, external GSCM, investment recovery, and eco-design as critical GSCM practices to have a sustainable environmental and economic performance. Following that studies, Zhu et. al. (2008) analyze variables to measure GSCM practices as internal environmental management, green purchasing, eco-design, cooperation with customers and investment recovery.
Evaluation of Financial and Economic Effects on Green Supply Chain Management
In their study on the critical factors influencing the adoption of GSC practices in Chinese firms, Lin and Ho (2011) classify the determinants of GSCM as technological, organizational and environmental. The technological factors include “relative advantage, compatibility, complexity”, organizational fac-tors are “organizational supports, quality human resources, company size” and “customer pressures, regulatory pressures, government supports, environmental uncertainty” are the environmental factors (2011:69). Following Lin and Ho (2011), Kuei et. al. (2015) also show evidence that relative advantage, quality of human resources, and customer pressure are positively related to the green practice adoption for focal firms; on the other hand, customer demands, and regulation are significant factors for sustain-ability for upstream firms.
A recent study by Dubey et. al. (2015:74-5) lists these factors as enablers of GSCM: a. total qual-ity management implementations, b. a strong supplier relationship management with a focus on being ‘cleaner’ and ‘greener” c. green technology adoption for efficiency in GSCM processes, d. institutional pressures such as ISO 14001 certification, e. top management commitment and practices for green sup-ply chain, f. reduction in carbon emissions (RCE) for a better environmental performance, g. customer relationship management managing for sustainability, h. increase in market share as a symbol for customer loyalty and i. increase in profitability as a result of “focus on R’s as reduction, reuse, reselling, repair, recycling, and reverse logistics”.
Along with these studies, Wu and Chang (2015) focus on dimensions of supplier management, product recycling, organization involvement and life cycle management through a case study conducted on electrical and electronic industries in Taiwan. The study results show that organization involvement dimension that includes factors as green design, top management support, environmental policy, cross-function integration, manpower involvement, effective communication platform within companies and with suppliers, establishing an environmental risk management system for GSCM, supplier evaluation and selection is the most critical dimension in GSCM. Among these factors, top management support and environmental policy for GSCM are found out to be the two critical factors in organization involvement.
Questioning the factors for implementing GSCM practices, Agi and Nashart (2017) specify 19 fac-tors and categorize these 19 facfac-tors into two groups as organizational facfac-tors and inter-organizational factors. Organizational factors refer to structural features, organizational processes and activities (e.g. use of information technology, capabilities of purchasing department, size of the company, functional integration, top management commitment, employees’ education and training), while inter-organizational factors represent the relationships, activities and processes in the supply chain (e.g. cooperation and sup-port from SC partners, information and knowledge sharing with SC partners, assessing and monitoring supplier performance and practicing supplier selection, trustful relationships with SC partners).
Besides these studies, it can be stated that GSCM covers many operational dimensions extending traditional supply chain management with an environmental perspective through material selection, manufacturing processes, delivery of the products including reverse logistics, and the recovery of the product by recycling or res-using after it concludes its life cycle (Srivastava, 2007). All these processes are interrelated and work in accordance for improved GSCM performance. For instance, selection process is closely related with recovery process as selection of an environmentally-friendly material would also refer that this material would easily be recycled (Mishra et. al., 2012). Following previous studies, the current research’s dimensions and criteria based on GSCM functions can be seen at Table 1.
The details of the dimensions will be explained in the following sections together with a discussion on the application of Turkish food and beverages firms listed in Istanbul Stock Exchange.
Evaluation of Financial and Economic Effects on Green Supply Chain Management
DECISION MAKING IN GSCM
Material Selection
Ecologically responsive material selection, also called as sustainable material selection (Zhang et. al., 2017), aims to select suitable materials for a product to reduce environmental damages given in operations (Tao et. al. 2016). GSCM literature points out product design and product life-cycle as two significant factors related with the material selection and production process (Srivastava, 2007). The use of resources, production style, transportation and distribution of products can differ through their life cycles. From the GSCM point of view, life-cycle evaluation is critical as it includes the decision-making process related with which materials to be used at the beginning of the production process to the disposal or recycle processes (Almeida, 2017; Srivastava, 2007; Akkucuk, 2016).
Business sustainability refers to administrating business operations with the concern for well-being of society, economy and environment (Hassini et. al., 2012). From the perspective of sustainability, purchas-ing green material would enhance the reduction of waste material (Rao and Holt, 2005) and hence firms are developing environment oriented purchasing strategies to supply their materials from partners that would produce environmentally-friendly materials (Min and Galle, 1997). Therefore, through adopting a proactive approach at the product design by design environmentally-friendly products would inhibit most of the harm a product can give to the environment (Büyüközkan and Çifci, 2012). Moreover at the beginning of purchasing, firms should consider the disposal of given materials for minimizing waste and hazardous material (Walker et. al., 2008). For instance, firms like Coca-Cola, PepsiCo adopted green packaging programs by introducing recyclable and reusable packages (Min and Galle, 1997). Thereby, it is of paramount importance for firms to take environment into consideration when buying materials and designing packaging (Min and Galle, 1997). More to these, selecting the appropriate material would help to take precautions against climate change and pollution. For instance, especially for the construc-tion firms, selecting green materials would minimize the indoor polluconstruc-tion which can influence the life quality to a highest degree (Franzoni, 2011; Khoshnava et. al., 2016; Sun et. al., 2017).
Table 1. Proposed dimensions and criteria of green supply chain management
Dimensions Criteria Supported Literature
Material Selection Sustainability
Almeida et. al. (2017), Zhu and He (2017), Min and Galle (1997), Rao and Holt (2005), Zhang et. al. (2017)
Low Pollution Franzoni (2011), Khoshnava et. al. (2016), Sun et. al. (2017) Manufacturing
Reduced Energy Bhattacharya et. al. (2015), Tao et. al. (2016), Kucukvar et. al. (2016), Hsu et. al. (2013) Clean Technology Klassen and Whybark, (1999), Vachon (2007), Baines et. al. (2012)
Reduce Waste Harveni et. al. (2005), Deif (2011), Islam et. al. (2017) Distribution
Combined Transport Bukold (1993), Jensen et. al. (2001), Jensen (2008), Martinsen and Björklund (2012) Alternatives Onat et. al. (2015), Mierlo et. al. (2017), Doll et. al. (2017)
Reverse Logistics Sarkis (2003), New and Westbrook (2004), Wells and Seitz, (2005), Mishra et. al. (2012), Ayvaz et. al. (2015)
Recovery Recycling Johnson and Wang (1995), Mishra et. al. (2012), Misni and Lee (2017)
Evaluation of Financial and Economic Effects on Green Supply Chain Management
Manufacturing
The main reasons behind adopting environmentally sensitive manufacturing are to enhance production efficiency, to reduce pollution or carbon footprint through advanced technologies and to conform to national or international legislations (Bhattacharya et. al., 2015). In line with these targets, the clean (sometimes called as lean) manufacturing can be described as “a modern manufacturing mode that takes into consideration resource consumption and the environmental impact” (He et. al. 2007). Manufacturing, itself, is a waste generation process and hereby greening the manufacturing is to minimize or to eliminate every kind of waste (Hervani et. al. 2005; Akkucuk, 2015). Moreover, energy consumption is one of the biggest concerns for production processes and sustainable manufacturing refers to low-carbon and efficient use of energy (Kucukvar et. al., 201&). Using renewable energy like biomass or hydropower power instead of fossil fuels can be an example in this context to increase the sustainability, reduce the energy and carbon emissions and thereby reduce the total costs.
The main purpose of a cleaner production is to have sustainable development by minimizing the haz-ardous effects on the environment. From this perspective, the classical perspective to green manufacturing was to minimize pollution through pollution control technologies through 70s (Baines et. al., 2012). In the following decade, a more proactive approach was adopted through clean technologies that focus on efficient use of energy through resource control at the source (Vachon, 2007). Therefore, to minimize the use of energy and other resource consumption through using clean technologies requires a proactive manufacturing approach. Thereby, this approach consists of production processes with little or no waste or pollution through less resource consumption and less cost (Deif, 2011). Environmentally- friendly manufacturing also includes re-manufacturing and lean manufacturing with a target of minimizing wastes and environmental pollution through using clean technologies and not using hazardous materials during manufacturing (Islam et. al., 2017).
Distribution
Distribution refers to packaging, transportation and logistics activities (Rao and Holt, 2005). For greening distribution, firms can redesign their logistic network and plan the network for ecological development (Wu and Dunn, 1995). The main concerns for green distribution is to “reduce transportation costs and the amount of CO2 emissions, product distribution time from manufacturers to retailers of products and to increase the levels of delivery rate” for customer satisfaction and sustainable development (Moham-med and Wang, 2017).Thereby, environmentally-responsible logistics refers to “fewer movements, less material handling, shorter travel distances, more direct deliveries and better space utilization” (Kim and Min, 2011). Also, route planning, fuel reduction (Mishra et. al., 2012), fewer transports, better space utilization (Sarkis, 1999) are among the factors for planning transportation, storage and inventory or material handling with decreased costs.
Transportation in the supply chain has been the process with the highest impacts on the environment (Wu and Dunn, 1995; Pazirandeh and Jafari, 2013) as it is accountable for up to 30% of global greenhouse gases due to excessive use of fossil fuels (Doll et. al., 2017). From the perspective of GSCM, logistics managers can plan transportation routes and modes in order to have fewer trips and use less fossil fuels from a variety of distribution options. For instance, to minimize the carbon emissions released alterna-tive transportation modes are being used (e.g. using rail and shipping inland waterway transport (IWT) and short sear shipping (SSS) instead of road (Doll et. al., 2017). Further, using bio fuels and
renew-Evaluation of Financial and Economic Effects on Green Supply Chain Management
able energy, modern vehicles with less emission, more direct transports with well-planned routines are the main tools for sustainable distribution (Martinsen and Björklund, 2012). Additionally, combined transport, using more than one transport mode, has attracted the attention to prevent truck emissions (Bukold, 1993) and it becomes a noteworthy distribution method overlapping society’s environmental sensibilities with firms’ environmental strategies (Jensen, 2008).
Another dimension of distribution is reverse logistics referring to transporting used products back to the firm for re-manufacturing. Hence, reverse logistics is mainly related with recovery processes together with waste management and it is critical for creating value for products used or harmed (Afshari et. al., 2014; Gencer and Akkucuk, 2016). The reverse logistics is also closely related with the closed loop supply chain as the main idea in the loop is to return all the scrap, returns or unusable materials back to the traditional production process including both reverse and forward supply chains so as to minimize the use of natural resources and eliminate the waste (Wells and Seitz, 2005).
Recovery
Green manufacturing differs from the classical production thinking in its approach to the post-delivery of the goods and the green recovery process of goods delivered both in the market and the environ-ment (Srinivas, 2014). Similarly, organizations adopting green manufacturing have already selected environmentally-friendly materials and used clean technologies for manufacturing processes but they also consider recovery or reuse of their products that would benefit planet, people and profit.
As the final step in the supply chain, recovery process can be defined as a combination of remanu-facture, re-use and recycle (Johnson and Wang, 1995). Re-use can have various forms as direct re-use, repair, recycling, and remanufacturing (Thierry et. al., 1995). Moreover, re-use can be applied to as-semblies, components and materials (Ferrer 1997; Krikke et. al. 1999; Kriwet et. al. 1995). Another important recovery operation is re-cycling and it is the process of producing new raw material from wastes (Misni and Lee, 2017). Further, if the returned product has no option of remanufactured then it is recycled. Similar to re-use, recycling process works with two principles of maximizing the resource use and minimizing the costs of the process (Mishra et. al., 2012). Consequently, recycling not only reduces costs and greenhouse gas emissions, but it also helps to minimize the use of environmental and organizational resources.
Turkish Green Supply Chain Management Practices
In 2016 Environmental Performance Index (EPI) that ranks countries on protection of human health and protection of ecosystems, Finland with its carbon-neutral society claim is ranked at the top of the list followed by Sweden, Denmark, and Slovenia. On the other side of the list, Somalia appears as the last country in the list (180th) and before Somalia comes Eritrea, Madagascar, Niger, and Afghanistan. In the list, Turkey is ranked 99 among 180 countries and its place in EPI indicates that Turkey has a mediocre performance and has to improve its ecological performance to reach its European counterparts. Addi-tionally, another report, “Trends in Global CO2 emissions: 2016 Report” (Oliver et. al. 2016), indicates that Turkey’s greenhouse gas (GHG) emissions as CO2 equivalent were 360 million tons in 2015 where China and United States had 10,720 and 5,180 million tons, respectively.
Though having a large emerging market, Turkey has been recently got engaged in environmental issues, and lately become ecologically responsive to these issues’ criticality for sustainability of organizations
Evaluation of Financial and Economic Effects on Green Supply Chain Management
and society. Parallel to European Union candidacy and compliance to the union’s environmental acquis, Turkey has introduced new legislations and institutional practices as National Environmental Action Plan (NEAP) (European Environment Agency, 2016). For instance, Turkey is required to implement the EU waste electric and electronic equipment directive for EU candidacy (WEEE Directive’, 2002/96/EC). However, in the case of electric waste, authorities (e.g. World Bank) suggest that Turkey has to form its own national standards and regulations that would support international standards for green operations.
When regionally examined, it is recorded that Turkish regional manufacturing is responsible for ap-proximately 40–60% of total Turkey’s carbon emissions (Kucukvar et. al., 2016). In the country scope, 99.8% of Turkish business environment consists of small and medium-sized Enterprises (SMEs) and these SMEs are accountable for nearly 70 percent of all industrial pollution (Agan et. al., 2013). Some industries are determined as more polluting sectors as food and beverages, textiles and metal products based on water and energy consumption, the amount of hazardous waste generated, and greenhouse gases (GHGs) emissions (Aksoy and Gonel,2015).
To both business environments and academic circles in Turkey, GSCM refers to a new management approach that becomes recently salient (Büyüközkan and Vardaroğlu, 2008; Camgöz-Akdağ and Aksoy, 2014). Therefore, the academic interest in GSCM practices in Turkey is limited with a dearth of stud-ies and is still in the preliminary stage. These few studstud-ies are worth mentioning for understanding the motives and barriers of GSCM practices developing in the country. For example, a study conducted by Andiç et. al. (2012) on the forces affecting GSCM practices in Turkey, find out customer demand as the most influential driver for GSCM practices. Confirming Andiç et. al. (2012), Tatoglu et. al. (2015) find out that stakeholder pressures as the most important dimension of corporate environmental poli-cies followed by environmental management practices, and the dimension of sources of greenhouse gas emissions is found out to be less influential factor. Agan et. al. (2013) within a sample of 500 SMEs, examined SMEs’ environmental processes (disposal, reduction, recycling, design) on firm performance. The study findings prove that the most influential driver for GSCM practices for Turkish SMEs is ex-pected benefits and soft performance expectations like image, reputation, and brand. Also, SMEs with ISO 14001 certification are found out to have better performance related with environmental processes, while disposal, design. Further, SMEs with environmental management systems are also found to have better performances. Based on their findings, Agan et. al. (2013) offer cooperation between firms in the supply chain as a critical factor to cope with pollution besides the government forced regulations. Similar to Agan et. al.’s study (2013), Sabegh et. al. (2016) on their research on inter-organizational relations and their influences on GSCM practices show that manufacturing and logistics firms have dif-ferent perceptions related with GSCM and hence they need cooperation and some experiences to fully adopt GSCM premises (Sabegh et. al., 2016).
Besides all these factors related with the newly adopted GSCM, studies point some barriers for Turkish firms. The awareness and knowledge of environmental issues is still lacking both in the society and industry basis that foster the thinking that GSCM is a cost center rather than a profitability source (Andiç et. al., 2012; Saridoğan, 2012). In line with this thinking, firms also don’t indulge in research and development activities that would enhance their environmental performance. Together with these, the inefficiency of governmental penalties and control on waste management and related operations or on the recording of carbon footprint of operations are the other factors that result in misguided actions.
Therefore inferred from the previous studies, it is suggested that GSCM practices in Turkish food and beverages industry, one of the most polluting sectors, requires attention and as to the knowledge of authors there is no study analyzing the GSCM performance determinants for the industry.
Evaluation of Financial and Economic Effects on Green Supply Chain Management
Turkish Food and Beverages Industry
According to the information given at the website of The Republic of Turkey Prime Ministry Investment Support and Promotion Agency (ISPAT), Turkey is the world’s 7th largest agricultural producer and 6.1 percent of the country’s GDP in 2016 is created by agriculture and food industry. Also, the overall GDP provided by agriculture and food industry “increased 40 percent from 2002 to 2016 and will be predicted as USD 52.3 billion in 2016. Globally, Turkey exported 1,781 kinds of agricultural products to more than 190 countries in 2016, accounting for an export volume of USD 16.9 billion” (http://www.invest. gov.tr/en-US/theagency/Pages/OurServices.aspx: 06.08.2017).
According to Business Monitor International’s Turkey Food and Beverages Report (2017), Turkey has a promising long-term consumer market and the largest firm is Nestlé whereas PepsiCo, Mondelez, The Coca-Cola Company, Mars, and AB InBev are among the top 10 food and beverage companies in the country. Besides these firms, Anadolu Efes, Danone, Çaykur, Pınar Su are the top beverage firms. More to that, trends of processed foods and growing health consciousness are started to be felt in the sector. The report (2017:15) signals that growth is expected in the industry especially due to “youthful demographics, rising incomes and increased participation of women in the labor force”. On the opposite side of the coin, inflation rates, the depreciation in the national monetary unit, geographical location and international relations in terms of exporting (e.g. Russia) appear as negative factors for the development of food industry, and increasing taxes with falling tourism arrivals are hindrances for beverages.
Parallel to these, according to “National Greenhouse Gas Inventory Report:1990-2014” prepared by Turkish statistical institute, food processing, beverages and tobacco were evaluated together and as a category’s share of GHG emissions as CO2 eq.in the Turkish manufacturing industry is 7.2% in 2014 while it was at its peak with 8.3% in 1990. Also to the report, the changes of emissions in the industry is attained to emissions in this sector is due to increasing electricity produced by auto producer together with increasing consumption in solid and liquid fuels.
Food and beverages industry covers use of fertilizers, herbicides and pesticides in farming techniques as well as water pollution, packaging types as factors that cam impede or enhance the hazards given by the industry to the environment (Jackson and Singh, 2015). According to the studies, the environmental hazards by food and beverages can be categorized into three groups (Davies and Konisky, 2000; Wang et. al., 2013). The first group addresses the “environmental impacts of the services given by restaurants including energy consumption, solid waste generation, air emissions, water emissions, food safety-foodborne diseases, and refrigerants” (Wang et. al., 2013:86). The second group implies the impacts caused by downstream actors in the chain as suppliers, manufacturers and farms. Lastly, the downstream harms caused by other businesses and consumers (e.g. using too much napkins). Therefore, excessive use of energy, water, food, and detergents is among the main causes of pollution and a hindrance to sustainability in food and beverages industry (Wang et. al., 2013). However, as mentioned before, Turk-ish agriculture and food industry generally consists of SMEs (Seyfettinoğlu, 2016; BIM, 2007) that don’t have the required budget and motivation to invest highly in research and development activities to increase the value created through their supply chains. Consequently, all these make GSCM practices and environmental management in food and beverages industry critical.
Evaluation of Financial and Economic Effects on Green Supply Chain Management
METHODOLOGY
Experts are appointed and annual reports and related news are considered to provide the linguistic assess-ment regarding the companies. Proposed dimensions and criteria are illustrated in the following table.
Fuzzy DEMATEL
DEMATEL method refers to the first letters of “The Decision-Making Trial and Evaluation Labora-tory”. This method was developed by Geneva Research Institute within the scope of Science and Human Relations Program. This program was performed for the periods between 1972 and 1976. DEMATEL method is mainly used to give decisions in a very complex situation (Shieh et. al., 2010). In other words, this method aims to rank the alternatives according to their importance. In addition to this situation, it is also very beneficial to identify cause and effect relationship among the criteria. In this situation, the criteria, which influence others very much, belong to cause criteria group. On the other side, the criteria are included in effect criteria group if they are affected by others. The main reason is that these criteria have lower importance in comparison with others. When the opinions of the experts are linguistic, in such a case, fuzzy DEMATEL method is taken into the consideration. The steps of this method are detailed as following (Tseng, 2009).
Step 1: The goal of the situation is identified. In other words, the purpose of the decision to solve the
problem is determined.
Step 2: The criteria is defined for evaluation. These criteria aim to analyze causal relationship. In
addi-tion to this situaaddi-tion, fuzzy linguistic scale is also determined. This scale helps to solve uncertainty conditions by considering following aspects.
◦ No ◦ Low ◦ Medium ◦ High ◦ Very High
Step 3: Decision makers evaluate the criteria. In this situation, the number of the experts who share
their opinions is referred to “p”. Furthermore, “Ž” shows fuzzy matrixes obtained according to the views of these experts. The details of average fuzzy matrix are given below. In this matrix, Žij = (lij, mij, uij) refers to the triangular fuzzy numbers (Dinçer et. al., 2017).
= 1⊕ ⊕ … ⊕2 p p . = 0 0 1 1 n n .
Step 4: The direct relation fuzzy matrix is normalized. The details of this matrix and equations used in
Evaluation of Financial and Economic Effects on Green Supply Chain Management X X X X X = 11 1 1 n n nn . Xij l m u ij ij ij ij r r r r = , , .r max i n u j i n ij = ≤ ≤ =
∑
1 .Step 5: Total relation fuzzy matrix is calculated as below.
d = t t t t 11 1 1 n n nn .t̆ij = (l’’ ij, m’’ij, u’’ij) lij'' =Xl× −
(
1 Xl)
−1.m X X ij m m '' = × −(
1)
−1.u X X ij u u '' = × −(
1)
−1.In this calculation, following matrixes are used.
Xl X n n m n = = 0 0 0 1 1 1 l' l' m' m' nn u n n X 1 1 1 0 0 0 = u’ u’ . Step 6: D Ri i def Ø Ø + .and Di Ri def Ø Ø −
.re calculated. In this process, fuzzy numbers become defuzzied and the following matrix is obtained.
ddef def n def n def nn def = t t t t 11 1 1 .
Some studies in which DEMATEL method is used are detailed on Table 2.
As it can be seen from Table 2, most of the studies, which considers MOORA method, are related to selecting the best alternative. For example, Mirmousa and Dehnavi (2016) made a study to select the best supplier in Iranian market. They reached the conclusion that the financial stability index is the most important criterion for this purpose. Similar to this study, Su et. al. (2016) also made an analysis for Taiwan and identified that recycling and reusing are the most significant factors for supplier selection. In addition, Büyüközkan et. al. (2017) proposed a model that makes an evaluation to select the best CRM partners. Moreover, Büyüközkan and Güleryüz (2016) developed a model for Turkey to select the most efficient renewable energy resources.
Furthermore, it can also be seen that some studies focused on the evaluation of the performance. For instance, Supeeket et. al. (2016) made a study to evaluate the supply chain performance for hospital in Thailand. According to the results of this analysis, it is defined that completeness of treatment is the
Evaluation of Financial and Economic Effects on Green Supply Chain Management
most important aspect for this situation. Additionally, Psndey and Kumar (2017) tried to make evalu-ation for human resource management. Similar to this study, Tooranloo et. al. (2017) also focused on human resource management and identified that environmental factors are the most significant issues for this situation.
Moreover, it is understood that some other studies aimed to determine the influencing factors of some issues. For example, George-Ufot et. al. (2017) made an analysis for Nigeria to identify the determinants of electricity consumption. They reached a conclusion that corruption, theft and inadequate planning are the most critical factors. In addition to this study, Luthra et. al. (2017) tried to understand the fac-tors affect production and consumption system in India. They defined that government regulations play an essential role. Tsai (2018) also focused on the determinants of job satisfaction of R&D personnel in China. It was identified that compensation, promotion and supervisors are significant influencing fac-tors for this aspect.
Fuzzy MOORA
MOORA method refers to the Multi-Objective Optimization on the basis of Ratio Analysis. It was developed by Brauers and Zavadskas in 2006. It is a decision making technique which depends on the ratio analysis. In other words, it makes an optimization to solve the complex problems by considering some limitations (Brauers and Zavadskas, 2006). MOORA method has many advantages in comparison
Table 2. Featured studies with DEMATEL approach
Authors Scope Results
Mirmousa and Dehnavi
(2016) Iran The financial stability index is the most significant criterion to select the best supplier.
Büyüközkan and Güleryüz
(2016) Turkey They created a model which is very helpful to select the most efficient renewable energy resources.
Supeeket et. al. (2016) Thailand It is understood that completeness of treatment is the most important aspect to evaluate hospital supply chain performance.
Su et. al. (2016) Taiwan Recycling and reusing are important factors for selecting the suppliers.
Gigovic et. al. (2016) Serbia They developed a model which can evaluate the sites for ecotourism development in Serbia.
Psndey and Kumar (2017) Literature Review They updated the model of Chou and others that was developed in 2012 which is related to the evaluation of criteria for human resource management.
Song and Cao (2017) Case Study They proposed a product and service model which can identify the weights of each requirement.
Sharma et. al. (2017) Literature Review They created a system for flying aerial vehicles which decreases the delays about 25%.
Büyüközkan et. al. (2017) Turkey They developed a model which makes an evaluation to select the best CRM partners.
George-Ufot et. al. (2017) Nigeria Corruption, theft and inadequate planning are the critical factors that affect electricity consumption.
Luthra et. al. (2017) India Government regulations play a very critical role for sustainable production and consumption system.
Tooranloo et. al. (2017) Iran Environmental factors are the most significant issues for the success of sustainable human resource management.
Evaluation of Financial and Economic Effects on Green Supply Chain Management
with other approaches. First of all, it takes shorter time to make analysis by using MOORA method. In addition to this situation, it is very simple to implement MOORA method. The steps of this method are explained below (Dinçer, 2015).
Step 1: Fuzzy decision matrix is created. Within this framework, various alternatives are considered
in this matrix which is shown below. In this matrix, “Xij” refers to the value of the criterion i for alternative j. Additionally, “Xijl”, “X
ijm”, “Xijn” represent lower, middle and upper values.
X X X X X X X X X X ij l m n n l n m n n m l m m m n = ( , , ) ( , , ) ( , , ) ( 11 11 11 1 1 1 1 1 1 XXmnl X X mn m mn n , , ) .
Step 2: The matrix is normalized. In order to achieve this objective, following matrix is taken into the
consideration. In this equation, Xij shows the normalized value of criterion i for alternative j. On the other side, all alternatives are stated on the denominator (Karande and Chakraborty, 2012).
r
X
X
X
X
ij l ij l j m ij l ij m ij n=
+
+
=∑
1 2 2 2(
)
(
)
(
)
. r X X X X ij m ij m j m ij l ij m ij n = + + =∑
1 2 2 2 ( ) ( ) ( ) .r X X X X ij n ij n j m ij l ij m ij n = + + =∑
1 2 2 2 ( ) ( ) ( ) .Step 3: Weighted results of the alternatives are identified by considering the importance of them. This
process is detailed below.
vijl W r j ij l = .vijm W r j ij m = .vijn W r j ij n = .
Step 4: Ratings of beneficial and non-beneficial criteria are determined. On the following 6 equations,
first three represent beneficial criteria whereas the last three show non-beneficial criteria.
Si l v j n ij l + = =
∑
1 .Si m v j n ij m + = =∑
1 .Si n v j n ij n + = =∑
1 .Si l v j n ij l − = =∑
1 .Si m v j n ij m − = =∑
1 .Si n v j n ij n − = =∑
1 .Evaluation of Financial and Economic Effects on Green Supply Chain Management S S Si i i Si l S S S S S i l i m i m i n i n + − + − + − + −
(
)
= (
−)
+(
−)
+(
−)
, 1 3 2 2 2 .Step 6: Alternatives are listed as according to their performance results.
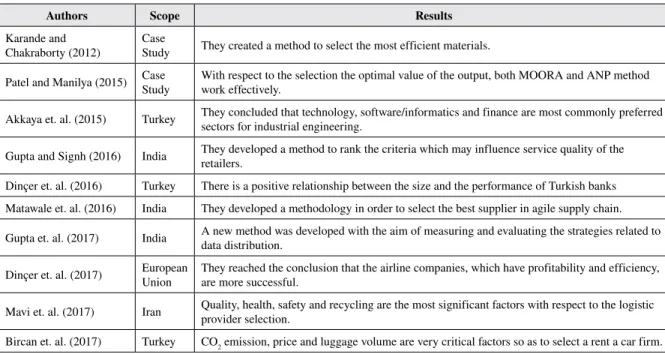
MOORA is so popular in the literature that many researchers used this method in their analysis. Some of these works are demonstrated in Table 3.
Table 3 shows that MOORA method is mainly used to select the best alternative. For example, Dinçer et. al. (2016) tried to evaluate the performance of deposit banks in Turkey. They reached a conclusion that there is a positive relationship between the size and the performance of Turkish banks. In addition to this study, Matawale et. al. (2016) proposed a method in order to select the best supplier in India. Moreover, Mavi et. al. (2017) focused on the best logistic provider selection in Iran. They identified that quality, health, safety and recycling are the most significant factors.
Furthermore, Bircan et. al. (2017) tried to select the best rent a car firm in Turkey. They reached a conclusion that CO2 emission, price and luggage volume are very critical factors for this aspect. Dinçer et. al. (2017) also aimed to evaluate the performance of European airline companies. They determined that the airline companies, which have profitability and efficiency, are more successful in comparison with others. Gupta et. al. (2017) also focused on developing a new method in order to measure and evaluate the strategies related to data distribution. Akkaya et. al. (2015) also used MOORA method to select the best sectors for industrial engineering and concluded that technology, software/informatics and finance are most commonly preferred sectors.
Table 3. Featured studies with MOORA approach
Authors Scope Results
Karande and
Chakraborty (2012) Case Study They created a method to select the most efficient materials.
Patel and Manilya (2015) Case Study With respect to the selection the optimal value of the output, both MOORA and ANP method work effectively.
Akkaya et. al. (2015) Turkey They concluded that technology, software/informatics and finance are most commonly preferred sectors for industrial engineering.
Gupta and Signh (2016) India They developed a method to rank the criteria which may influence service quality of the retailers.
Dinçer et. al. (2016) Turkey There is a positive relationship between the size and the performance of Turkish banks
Matawale et. al. (2016) India They developed a methodology in order to select the best supplier in agile supply chain.
Gupta et. al. (2017) India A new method was developed with the aim of measuring and evaluating the strategies related to data distribution.
Dinçer et. al. (2017) European Union They reached the conclusion that the airline companies, which have profitability and efficiency, are more successful.
Mavi et. al. (2017) Iran Quality, health, safety and recycling are the most significant factors with respect to the logistic provider selection.
Evaluation of Financial and Economic Effects on Green Supply Chain Management
AN APPLICATION ON BIST
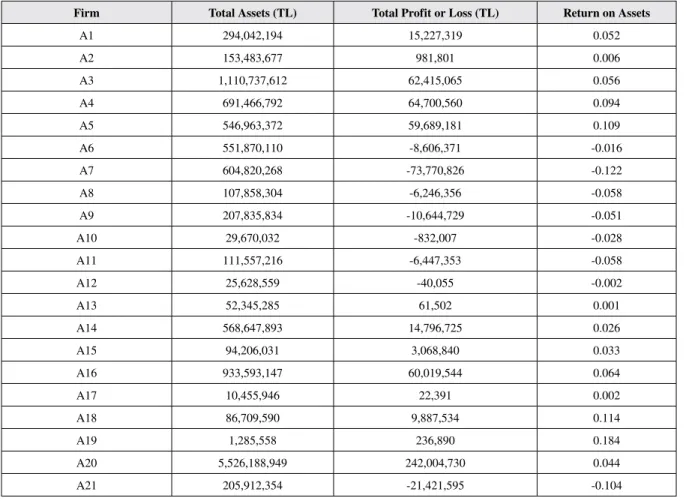
The purpose of the study is to analyze the multidimensional points of the green supply chain manage-ment using a fuzzy-based decision making methodology. For this purpose, the fuzzy DEMATEL and fuzzy MOORA methods have been used for the integrated model construction. The main stages of the green supply chain have been considered as the dimensions and the selected performance measures have been listed a set of criteria for each dimension. Accordingly, 21 Food and Beverage companies listed in Istanbul Stock Exchange have been employed to measure the performance of green supply chain processes. Experts have been appointed and annual reports and related news have been considered to provide the linguistic assessment regarding the companies. The financial situation of these 21 firms as of 2016 is shared on table 4.
The application initiates by defining the multi-criteria decision-making problem to construct the dimen-sions and criteria of green supply chain management for the companies listed in the BIST food beverage index as seen in table 1. Decision makers have been appointed to determine the linguistic evaluations for each criterion and the firm. The proposed model has been defined for ranking the alternative firms.
Accordingly, the Fuzzy DEMATEL and Fuzzy MOORA methods have been integrated for the novel hybrid decision making approach. The methodology begins by constructing the direct fuzzy relation
Table 4. Basic financial information of selected firms
Firm Total Assets (TL) Total Profit or Loss (TL) Return on Assets
A1 294,042,194 15,227,319 0.052 A2 153,483,677 981,801 0.006 A3 1,110,737,612 62,415,065 0.056 A4 691,466,792 64,700,560 0.094 A5 546,963,372 59,689,181 0.109 A6 551,870,110 -8,606,371 -0.016 A7 604,820,268 -73,770,826 -0.122 A8 107,858,304 -6,246,356 -0.058 A9 207,835,834 -10,644,729 -0.051 A10 29,670,032 -832,007 -0.028 A11 111,557,216 -6,447,353 -0.058 A12 25,628,559 -40,055 -0.002 A13 52,345,285 61,502 0.001 A14 568,647,893 14,796,725 0.026 A15 94,206,031 3,068,840 0.033 A16 933,593,147 60,019,544 0.064 A17 10,455,946 22,391 0.002 A18 86,709,590 9,887,534 0.114 A19 1,285,558 236,890 0.184 A20 5,526,188,949 242,004,730 0.044 A21 205,912,354 -21,421,595 -0.104
Evaluation of Financial and Economic Effects on Green Supply Chain Management
Table 5. The initial dir
ect-r
elation fuzzy matr
ix Cr iter ia C1 C2 C3 C4 C5 C6 C7 C8 C9 C10 C1 0,0 0,0 0,0 0,0 0,3 0,5 0,5 0,8 1,0 0,0 0,3 0,5 0,0 0,3 0,5 0,3 0,5 0,8 0,3 0,5 0,8 0,3 0,5 0,8 0,0 0,3 0,5 0,3 0,5 0,8 C2 0,3 0,5 0,8 0,0 0,0 0,0 0,5 0,8 1,0 0,5 0,8 1,0 0,5 0,8 1,0 0,3 0,5 0,8 0,3 0,5 0,8 0,3 0,5 0,8 0,5 0,8 1,0 0,3 0,5 0,8 C3 0,5 0,8 1,0 0,3 0,5 0,8 0,0 0,0 0,0 0,3 0,5 0,8 0,3 0,5 0,8 0,0 0,3 0,5 0,0 0,3 0,5 0,0 0,3 0,5 0,0 0,3 0,5 0,0 0,3 0,5 C4 0,5 0,8 1,0 0,3 0,5 0,8 0,3 0,5 0,8 0,0 0,0 0,0 0,3 0,5 0,8 0,0 0,3 0,5 0,0 0,3 0,5 0,0 0,3 0,5 0,0 0,3 0,5 0,0 0,3 0,5 C5 0,5 0,8 1,0 0,3 0,5 0,8 0,3 0,5 0,8 0,3 0,5 0,8 0,0 0,0 0,0 0,0 0,3 0,5 0,0 0,3 0,5 0,0 0,3 0,5 0,0 0,3 0,5 0,0 0,3 0,5 C6 0,0 0,3 0,5 0,3 0,5 0,8 0,3 0,5 0,8 0,3 0,5 0,8 0,3 0,5 0,8 0,0 0,0 0,0 0,5 0,8 1,0 0,5 0,8 1,0 0,0 0,3 0,5 0,5 0,8 1,0 C7 0,0 0,3 0,5 0,0 0,0 0,3 0,0 0,0 0,3 0,0 0,0 0,3 0,0 0,0 0,3 0,5 0,8 1,0 0,0 0,0 0,0 0,0 0,3 0,5 0,0 0,3 0,5 0,0 0,3 0,5 C8 0,5 0,8 1,0 0,5 0,8 1,0 0,5 0,8 1,0 0,5 0,8 1,0 0,5 0,8 1,0 0,3 0,5 0,8 0,3 0,5 0,8 0,0 0,0 0,0 0,3 0,5 0,8 0,3 0,5 0,8 C9 0,5 0,8 1,0 0,3 0,5 0,8 0,3 0,5 0,8 0,3 0,5 0,8 0,3 0,5 0,8 0,5 0,8 1,0 0,5 0,8 1,0 0,5 0,8 1,0 0,0 0,0 0,0 0,3 0,5 0,8 C10 0,5 0,8 1,0 0,3 0,5 0,8 0,3 0,5 0,8 0,3 0,5 0,8 0,3 0,5 0,8 0,5 0,8 1,0 0,5 0,8 1,0 0,5 0,8 1,0 0,3 0,5 0,8 0,0 0,0 0,0
Evaluation of Financial and Economic Effects on Green Supply Chain Management
Table 6. N
or
malized dir
ect-r
elation fuzzy matr
ix Cr iter ia C1 C2 C3 C4 C5 C6 C7 C8 C9 C10 C1 0,0 0,0 0,0 0,0 0,0 0,1 0,1 0,1 0,1 0,0 0,0 0,1 0,0 0,0 0,1 0,0 0,1 0,1 0,0 0,1 0,1 0,0 0,1 0,1 0,0 0,0 0,1 0,0 0,1 0,1 C2 0,0 0,1 0,1 0,0 0,0 0,0 0,1 0,1 0,1 0,1 0,1 0,1 0,1 0,1 0,1 0,0 0,1 0,1 0,0 0,1 0,1 0,0 0,1 0,1 0,1 0,1 0,1 0,0 0,1 0,1 C3 0,1 0,1 0,1 0,0 0,1 0,1 0,0 0,0 0,0 0,0 0,1 0,1 0,0 0,1 0,1 0,0 0,0 0,1 0,0 0,0 0,1 0,0 0,0 0,1 0,0 0,0 0,1 0,0 0,0 0,1 C4 0,1 0,1 0,1 0,0 0,1 0,1 0,0 0,1 0,1 0,0 0,0 0,0 0,0 0,1 0,1 0,0 0,0 0,1 0,0 0,0 0,1 0,0 0,0 0,1 0,0 0,0 0,1 0,0 0,0 0,1 C5 0,1 0,1 0,1 0,0 0,1 0,1 0,0 0,1 0,1 0,0 0,1 0,1 0,0 0,0 0,0 0,0 0,0 0,1 0,0 0,0 0,1 0,0 0,0 0,1 0,0 0,0 0,1 0,0 0,0 0,1 C6 0,0 0,0 0,1 0,0 0,1 0,1 0,0 0,1 0,1 0,0 0,1 0,1 0,0 0,1 0,1 0,0 0,0 0,0 0,1 0,1 0,1 0,1 0,1 0,1 0,0 0,0 0,1 0,1 0,1 0,1 C7 0,0 0,0 0,1 0,0 0,0 0,0 0,0 0,0 0,0 0,0 0,0 0,0 0,0 0,0 0,0 0,1 0,1 0,1 0,0 0,0 0,0 0,0 0,0 0,1 0,0 0,0 0,1 0,0 0,0 0,1 C8 0,1 0,1 0,1 0,1 0,1 0,1 0,1 0,1 0,1 0,1 0,1 0,1 0,1 0,1 0,1 0,0 0,1 0,1 0,0 0,1 0,1 0,0 0,0 0,0 0,0 0,1 0,1 0,0 0,1 0,1 C9 0,1 0,1 0,1 0,0 0,1 0,1 0,0 0,1 0,1 0,0 0,1 0,1 0,0 0,1 0,1 0,1 0,1 0,1 0,1 0,1 0,1 0,1 0,1 0,1 0,0 0,0 0,0 0,0 0,1 0,1 C10 0,1 0,1 0,1 0,0 0,1 0,1 0,0 0,1 0,1 0,0 0,1 0,1 0,0 0,1 0,1 0,1 0,1 0,1 0,1 0,1 0,1 0,1 0,1 0,1 0,0 0,1 0,1 0,0 0,0 0,0
Evaluation of Financial and Economic Effects on Green Supply Chain Management
Table 7. The t
ot
al-r
elation fuzzy matr
ix Cr iter ia C1 C2 C3 C4 C5 C6 C7 C8 C9 C10 C1 0,0 0,1 0,4 0,0 0,1 0,4 0,1 0,1 0,5 0,0 0,1 0,4 0,0 0,1 0,4 0,0 0,1 0,4 0,0 0,1 0,4 0,0 0,1 0,4 0,0 0,1 0,3 0,0 0,1 0,4 C2 0,1 0,2 0,6 0,0 0,1 0,4 0,1 0,2 0,6 0,1 0,2 0,5 0,1 0,2 0,5 0,0 0,1 0,5 0,0 0,1 0,5 0,0 0,1 0,5 0,1 0,1 0,5 0,0 0,1 0,5 C3 0,1 0,2 0,5 0,0 0,1 0,4 0,0 0,1 0,3 0,0 0,1 0,4 0,0 0,1 0,4 0,0 0,1 0,4 0,0 0,1 0,4 0,0 0,1 0,4 0,0 0,1 0,3 0,0 0,1 0,4 C4 0,1 0,2 0,5 0,0 0,1 0,4 0,0 0,1 0,4 0,0 0,1 0,3 0,0 0,1 0,4 0,0 0,1 0,4 0,0 0,1 0,4 0,0 0,1 0,4 0,0 0,1 0,3 0,0 0,1 0,4 C5 0,1 0,2 0,5 0,0 0,1 0,4 0,0 0,1 0,4 0,0 0,1 0,4 0,0 0,1 0,3 0,0 0,1 0,4 0,0 0,1 0,4 0,0 0,1 0,4 0,0 0,1 0,3 0,0 0,1 0,4 C6 0,0 0,1 0,5 0,0 0,1 0,5 0,0 0,1 0,5 0,0 0,1 0,5 0,0 0,1 0,5 0,0 0,1 0,4 0,1 0,2 0,5 0,1 0,2 0,5 0,0 0,1 0,4 0,1 0,1 0,5 C7 0,0 0,1 0,3 0,0 0,0 0,3 0,0 0,0 0,3 0,0 0,0 0,3 0,0 0,0 0,3 0,1 0,1 0,4 0,0 0,0 0,2 0,0 0,1 0,3 0,0 0,1 0,3 0,0 0,1 0,3 C8 0,1 0,2 0,6 0,1 0,2 0,5 0,1 0,2 0,6 0,1 0,2 0,5 0,1 0,2 0,5 0,0 0,1 0,5 0,0 0,1 0,5 0,0 0,1 0,4 0,0 0,1 0,5 0,0 0,1 0,5 C9 0,1 0,2 0,6 0,0 0,1 0,5 0,1 0,1 0,5 0,0 0,1 0,5 0,0 0,1 0,5 0,1 0,2 0,5 0,1 0,2 0,5 0,1 0,2 0,5 0,0 0,1 0,4 0,0 0,1 0,5 C10 0,1 0,2 0,6 0,0 0,1 0,5 0,1 0,1 0,5 0,0 0,1 0,5 0,0 0,1 0,5 0,1 0,2 0,5 0,1 0,2 0,5 0,1 0,2 0,5 0,0 0,1 0,4 0,0 0,1 0,4
Evaluation of Financial and Economic Effects on Green Supply Chain Management
matrix provided from the decision-making group. The second step continues by the initial and normal-ized direct-relation fuzzy matrix respectively. At the following stage of the Fuzzy DEMATEL, the total influence matrix and the total-relation fuzzy matrix have been employed to attain the crisp values. The final step of the fuzzy DEMATEL has been defined by the defuzzied total-relation matrix to determine the weights of the key components of green supply chain management. The results have been presented in table 5-8.
Linguistic scales have been appointed for each criterion by using No influence (N), Low influence (L), Medium influence (M), High influence (H), Very high influence (VH) and the scales have been converted to the triangular fuzzy numbers to evaluate the relative importance of the criteria (Uygun et.al.2015). The evaluation results can be seen in table 5.
Initial direct-relation fuzzy matrix has been normalized in table 5. Table 7 represents the total influence matrix using the crisp matrices.
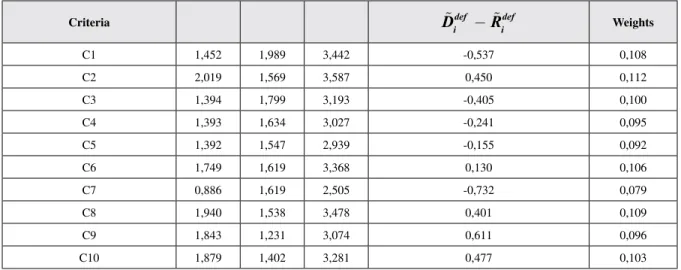
Table 8 illustrates the total cause and effects of the criteria between each other with the defuzzied values. The results show that C2 is the most important factor in the green supply chain management while C7 has the least weight in the criteria. However, C9 influences the other criteria most dominantly as C7 is the most influenced factor among the criteria.
The second phase of the integrated model continues with the Fuzzy MOORA method. Firstly, the linguistic scales have been appointed for each firm and the fuzzy decision matrix has been provided in table 9. And then, the weighted normalized values have been calculated to attain the overall ratings of beneficial and non-beneficial criteria for each firm.
The final ranking results are presented in table 10.
Table 10 demonstrates that A21 is the best firm while A2 has the worst performance in BIST food beverage index according to the key components of the green supply chain management.
Table 8. Total impact-relationship degrees and the weights for the criteria
Criteria D idef −R idef Weights
C1 1,452 1,989 3,442 -0,537 0,108 C2 2,019 1,569 3,587 0,450 0,112 C3 1,394 1,799 3,193 -0,405 0,100 C4 1,393 1,634 3,027 -0,241 0,095 C5 1,392 1,547 2,939 -0,155 0,092 C6 1,749 1,619 3,368 0,130 0,106 C7 0,886 1,619 2,505 -0,732 0,079 C8 1,940 1,538 3,478 0,401 0,109 C9 1,843 1,231 3,074 0,611 0,096 C10 1,879 1,402 3,281 0,477 0,103
Evaluation of Financial and Economic Effects on Green Supply Chain Management
Table 9. F
uzzy decision matr
ix Fir ms C1 C2 C3 C4 C5 C6 C7 C8 C9 C10 A1 0,5 0,75 1 0,75 1 1 0,5 0,75 1 0,75 1 1 0,25 0,5 0,75 0,75 1 1 0,75 1 1 0,5 0,75 1 0,75 1 1 0,5 0,75 1 A2 0,25 0,5 0,75 0,5 0,75 1 0,5 0,75 1 0,5 0,75 1 0,5 0,75 1 0,25 0,5 0,75 0,75 1 1 0,25 0,5 0,75 0,5 0,75 1 0,25 0,5 0, 75 A3 0,75 1 1 0,5 0,75 1 0,5 0,75 1 0,5 0,75 1 0,25 0,5 0,75 0,75 1 1 0,75 1 1 0,5 0,75 1 0,5 0,75 1 0,25 0,5 0, 75 A4 0,75 1 1 0,75 1 1 0,5 0,75 1 0,75 1 1 0,5 0,75 1 0,75 1 1 0,75 1 1 0,5 0,75 1 0,75 1 1 0,25 0,5 0, 75 A5 0,75 1 1 0,75 1 1 0,5 0,75 1 0,75 1 1 0,5 0,75 1 0,75 1 1 0,75 1 1 0,5 0,75 1 0,75 1 1 0,25 0,5 0, 75 A6 0,5 0,75 1 0,5 0,75 1 0,5 0,75 1 0,5 0,75 1 0,5 0,75 1 0,5 0,75 1 0,75 1 1 0,25 0,5 0,75 0,5 0,75 1 0,25 0,5 0, 75 A7 0,5 0,75 1 0,5 0,75 1 0,5 0,75 1 0,5 0,75 1 0,25 0,5 0,75 0,5 0,75 1 0,5 0,75 1 0,25 0,5 0,75 0,75 1 1 0,25 0,5 0, 75 A8 0,25 0,5 0,75 0,5 0,75 1 0,25 0,5 0,75 0,5 0,75 1 0,25 0,5 0,75 0,25 0,5 0,75 0,5 0,75 1 0,25 0,5 0,75 0,5 0,75 1 0,5 0,75 1 A9 0,25 0,5 0,75 0,5 0,75 1 0,5 0,75 1 0,5 0,75 1 0,25 0,5 0,75 0,75 1 1 0,75 1 1 0,5 0,75 1 0,75 1 1 0,5 0,75 1 A10 0,25 0,5 0,75 0,25 0,5 0,75 0,25 0,5 0,75 0,25 0,5 0,75 0,5 0,75 1 0,25 0,5 0,75 0,5 0,75 1 0,25 0,5 0,75 0,5 0,75 1 0,25 0,5 0, 75 A11 0,25 0,5 0,75 0,25 0,5 0,75 0,25 0,5 0,75 0,25 0,5 0,75 0,25 0,5 0,75 0,5 0,75 1 0,5 0,75 1 0,25 0,5 0,75 0,5 0,75 1 0,5 0,75 1 A12 0,25 0,5 0,75 0,5 0,75 1 0,5 0,75 1 0,5 0,75 1 0,25 0,5 0,75 0,75 1 1 0,25 0,5 0,75 0,25 0,5 0,75 0,75 1 1 0,5 0,75 1 A13 0,25 0,5 0,75 0,5 0,75 1 0,25 0,5 0,75 0,5 0,75 1 0,5 0,75 1 0,25 0,5 0,75 0,5 0,75 1 0,25 0,5 0,75 0,75 1 1 0,5 0,75 1 A14 0,25 0,5 0,75 0,5 0,75 1 0,25 0,5 0,75 0,5 0,75 1 0,5 0,75 1 0,5 0,75 1 0,5 0,75 1 0,25 0,5 0,75 0,5 0,75 1 0,5 0,75 1 A15 0,25 0,5 0,75 0,25 0,5 0,75 0,25 0,5 0,75 0,5 0,75 1 0,25 0,5 0,75 0,5 0,75 1 0,25 0,5 0,75 0,25 0,5 0,75 0,75 1 1 0,25 0,5 0, 75 A16 0,5 0,75 1 0,75 1 1 0,5 0,75 1 0,75 1 1 0,5 0,75 1 0,75 1 1 0,5 0,75 1 0,5 0,75 1 0,75 1 1 0,5 0,75 1 A17 0,75 1 1 0,75 1 1 0,5 0,75 1 0,75 1 1 0,5 0,75 1 0,75 1 1 0,25 0,5 0,75 0,25 0,5 0,75 0,75 1 1 0,25 0,5 0, 75 A18 0,25 0,5 0,75 0,5 0,75 1 0,25 0,5 0,75 0,5 0,75 1 0,25 0,5 0,75 0,25 0,5 0,75 0,5 0,75 1 0,25 0,5 0,75 0,75 1 1 0,5 0,75 1 A19 0,5 0,75 1 0,75 1 1 0,5 0,75 1 0,75 1 1 0,5 0,75 1 0,75 1 1 0,25 0,5 0,75 0,25 0,5 0,75 0,75 1 1 0,25 0,5 0, 75 A20 0,75 1 1 0,75 1 1 0,5 0,75 1 0,75 1 1 0,5 0,75 1 0,75 1 1 0,75 1 1 0,5 0,75 1 0,75 1 1 0,5 0,75 1 A21 0,75 1 1 0,75 1 1 0,25 0,5 0,75 0,75 1 1 0,5 0,75 1 0,75 1 1 0,5 0,75 1 0,5 0,75 1 0,75 1 1 0,5 0,75 1
Evaluation of Financial and Economic Effects on Green Supply Chain Management
DISCUSSION AND CONCLUSION
Environmental pollution is a crucial concept in the world especially in the last years. Within this scope, it can be said that some companies increase this pollution because of their operations. On the other side, there are also some groups which announce the importance of environmental pollution. Nowadays, it can be observed that consciousness of most of the companies regarding the pollution increased. They focus on green supply chain management activities to contribute to the solution of this problem.
Indeed, green supply chain management activities have many economic and the financial advantages to these companies. First of all, by applying the activities, such as recycling, reuse and reverse logistic, they can have a chance to reduce their costs. In addition to this advantage, companies can also increase the image in the eyes of the customers by adopting some green supply chain management activities like low pollution, clean technology and reduce waste. Since customers prefer these companies due to these factors, they can increase their revenues.
This study aims to evaluate financial and economic effects on green supply chain management. Within this framework, 21 different companies listed in BIST food beverage index are taken into the consideration. In addition to this situation, the fuzzy DEMATEL and fuzzy MOORA methods are used
Table 10. The ranking of alternatives
Alternatives The Values of Si Ranking
A1 0,0596 2 A2 0,0333 21 A3 0,0560 4 A4 0,0535 7 A5 0,0535 7 A6 0,0416 18 A7 0,0459 12 A8 0,0446 14 A9 0,0554 5 A10 0,0367 20 A11 0,0492 9 A12 0,0453 13 A13 0,0423 17 A14 0,0445 15 A15 0,0470 10 A16 0,0536 6 A17 0,0433 16 A18 0,0464 11 A19 0,0407 19 A20 0,0583 3 A21 0,0608 1
Evaluation of Financial and Economic Effects on Green Supply Chain Management
to achieve this objective. Moreover, by analyzing similar studies in the literature, 10 different criteria are identified which may show the performance of green supply chain management.
In the analysis process, first of all, the importance of these 10 criteria is determined with the help of fuzzy DEMATEL method. As a result of this analysis, it is identified that “low pollution” is the most important criterion for these companies. On the other side, the criterion of “alternatives” has the least weight. This condition gives information that food and beverage companies mainly focus on saving their image in the public eye. The main reason behind this situation is that they can be more preferred by the customers while having an image that does not pollute the environment.
According to the results of fuzzy MOORA analysis, it is defined that there is not a strict correlation between the profitability of the companies and green supply chain management performance. For ex-ample, A21 has the highest performance with respect to the green supply chain management. However, it has a significant loss in 2016. On the other side, it can also be said that bigger firms have higher green supply chain management performance than the smaller firms. For instance, the companies, which have the highest total assets value, are ranked as the third, fourth and sixth position. Nevertheless, A10 and A19 are the companies that have low green supply chain management performance and lower size in comparison with other firms.
REFERENCES
Agan, Y., Acar, M. F., & Borodin, A. (2013). Drivers of environmental processes and their impact on performance: A study of Turkish SMEs. Journal of Cleaner Production, 51, 23–33. doi:10.1016/j. jclepro.2012.12.043
Agi, M. A., & Nishant, R. (2017). Understanding influential factors on implementing green supply chain management practices: An interpretive structural modelling analysis. Journal of Environmental
Management, 188, 351–363. doi:10.1016/j.jenvman.2016.11.081 PMID:28006744
Akkaya, G., Turanoğlu, B., & Öztaş, S. (2015). An integrated fuzzy AHP and fuzzy MOORA approach to the problem of industrial engineering sector choosing. Expert Systems with Applications, 42(24), 9565–9573. doi:10.1016/j.eswa.2015.07.061
Albertini, E. (2017). What we know about environmental policy: An inductive typology of the research.
Business Strategy and the Environment, 26(3), 277–287. doi:10.1002/bse.1913
Almeida, C. M. V. B., Rodrigues, A. J. M., Agostinho, F., & Giannetti, B. F. (2017). Material selection for environmental responsibility: The case of soft drinks packaging in Brazil. Journal of Cleaner
Pro-duction, 142, 173–179. doi:10.1016/j.jclepro.2016.04.130
Afshari, H., Sharafi, M., ElMekkawy, T., & Peng, Q. (2014). Optimizing multi-objective dynamic facility location decisions within green distribution network design. Procedia Cirp, 17, 675–679. doi:10.1016/j. procir.2014.01.147
Akkucuk, U. (Ed.). (2015). Handbook of Research on Waste Management Techniques for Sustainability. IGI Global.