THE ABILITY TO GENERATE DIFFERENTIATED AND
SENECESENT PROGENY IS A MAJOR DETERMINANT OF
BREAST CANCER HETEROGENEITY
A THESIS SUBMITTED TO
THE DEPARTMENT OF MOLECULAR BIOLOGY AND GENETICS AND THE INSTITUTE OF ENGINEERING AND SCIENCE OF
BILKENT UNIVERSITY
IN PARTIAL FULFILLMENT OF THE REQUIREMENTS FOR THE DEGREE OF DOCTOR OF PHILOSOPHY
BY
MİNE MUMCUOĞLU AUGUST 2009
ii
I certify that I have read this thesis and that in my opinion it is fully adequate, in scope and in quality, as a thesis for the degree of Doctor of Philosophy.
Prof. Mehmet Öztürk I certify that I have read this thesis and that in my opinion it is fully adequate, in scope and in quality, as a thesis for the degree of Doctor of Philosophy.
Prof. Dr. Ediz Demirpence
I certify that I have read this thesis and that in my opinion it is fully adequate, in scope and in quality, as a thesis for the degree of Doctor of Philosophy.
Assoc. Prof. Işik Yuluğ
I certify that I have read this thesis and that in my opinion it is fully adequate, in scope and in quality, as a thesis for the degree of Doctor of Philosophy.
Assoc. Prof. Rengül Çetin-Atalay
I certify that I have read this thesis and that in my opinion it is fully adequate, in scope and in quality, as a thesis for the degree of Doctor of Philosophy.
Assoc. Prof. Esra Erdal Approved for the Institute of Engineering and Science
Director of Institute of Engineering and Science Prof. Mehmet Baray
iii
ABSTRACT
THE ABILITY TO GENERATE DIFFERENTIATED AND
SENECESENT PROGENY IS A MAJOR DETERMINANT OF
BREAST CANCER HETEROGENEITY
Mine Mumcuoğlu
Ph.D. in Molecular Biology and Genetics Supervisor: Dr. Mehmet Öztürk
August 2009, 124 Pages
Breast cancer displays distinct subtypes, such as luminal A, luminal B, and basal-like. The prognosis and therapeutic response of each subtype is different. The mechanisms involved in the generation of these tumor types are poorly understood. Our aim was to test whether the ability to generate senescent progeny contributes to breast cancer heterogeneity. A panel of 12 breast cancer cell lines, 31 isogenic clones, and 12 breast tumors were used. We classified breast cancer cell lines into senescent cell progenitor (SCP) and immortal cell progenitor (ICP) subtypes. All ER+ cell lines tested and some ER-positive (ER+) breast tumors displayed senescence. Acute loss and tamoxifen-mediated inactivation of ER triggered a robust senescence response in SCP type T47D cell line. In contrast, ER-overexpression, estrogen treatment and p21Cip1 knockdown inhibited senescence. Neutralization of reactive oxygen species also abolished senescence. Breast cancer cell subtypes displayed divergent ability to produce differentiated progeny. The SCP subtype cells produced CD24+ or ER+ luminal-like and ASMA+ myoepithelial-like progeny, in addition to CD44+ stem/progenitor-like cells. In contrast, ICP cell lines acted as differentiation-defective stem/progenitor cells. Some cell lines generated only CD44+/CD24-/ ER-/ASMA- progenitor/stem-like cells, and others only CD24+/ER- luminal-like, but not ASMA+ myoepithelial-like cells. SCP cell lines were less tumorigenic, and they clustered with luminal A/normal like tumors. In contrast, ICP subtypes were more tumorigenic, and they clustered together with basal/luminal B tumors. Our results show that breast cancer cell lines clustering with luminal A/normal-like and basal/luminal B tumors respectively, differ from each other by the ability to generate differentiated and senescence-arrested progeny.
iv
ÖZET
FARKLILAŞMIŞ VE SENESANT PROJENİTÖR OLUŞTURMA
POTANSİYELİ MEME KANSERİNİN HETEROJEN YAPISININ
BAŞLICA BELİRLEYİCİLERİNDENDİR
Mine Mumcuoğlu
Moleküler Biyoloji ve Genetik Doktorasi Tez Yöneticisi: Dr. Mehmet Öztürk
Agostos 2009, 124 Sayfa
Meme kanseri luminal A, lüminal B ve basal-benzeri gibi farklı alttürlerden oluşmaktadır. Her alt türün prognozu ve tedaviye yanıtı farklıdır. Söz konusu alt türlerin oluşumunde yer alan mekanizmalar iyi bilinmemektedir. Bu çalışmanın amacı, hücre yaşlanması ya da senesansın meme kanerinin heterojen yapısına herhangi bir katkıda bulunup bulunmadığını araştırmaktı. Bu amaçla 12 meme kanseri hücre hattı, 31 izogenik hücre klonu ve 12 meme tümörü incelendi. Meme kanseri hücre hatlarını senesant hücre (SCP) ve ölümsüz hücre (ICP) projenitörleri olarak iki türde sınıflandırdık. Test edilen tüm östrojen almaç-pozitif (ER+) hücre hatları ve bazı ER+ meme tümörleri senesans gösterdi. Estrojen almacının akut kaybı ve tamoksifenle etkisizleştirilmesi SCP türü T47D hücre hattında güçlü bir senesans yanıtına yol açtı. Buna karşılık, östrojenle muamele, estrojen almacının aşırı ifadesi ve p21Cip1 geninin “knock-down” yöntemi ile etkisizleştirilmesi senesensı baskıladı. Ayrıca, reaktif oksijen türlerinin N-asetil sistein ile nötralize edilmesi de senesens yanıtını engelledi. Meme kanseri alt türleri farklılaşmış projeni oluşturma potansiyeli açısından farklılık gösterdi. SCP alttürü hücreler, CD44+ kök/projenitör hücrelere ek olarak, CD24+ veya ER+ lüminal-benzeri, ve ASMA+ miyoepitel-benzeri hücreler ürettiler. Buna karşılk, ICP hücre hatları farklılaşmada kusurlu olan kök/projenitör hücreler olarak davrandılar. Bazı hücre hatları sadece CD44+/CD24-/ ER-/ASMA- projenitör/kök-benzeri hücreler üretirken, diğerleri CD24+/ER- lüminal-benzeri hücreler ürettiler. Ancak ASMA+ miyoepitel-benzeri hücre üretemediler. SCP hücre hatları daha az tümörijenik olup luminal A/normal-benzeri tümörlerle kümeleştiler. Buna karşılık ICP alttürü hücreler daha fazla tümörijenik olup bazal/lüminal B tümörlerle kümeleştiler. Sonuçlarımız lüminal A/normal-benzeri ve bazal/lüminal B tümörlerle kümeleşen meme kanseri hücre hatlarının farklılaşma ve senesensa girebilme özellikleri açısından birbirlerinden ayrıldıklarını göstermiştir.
v
vi
ACKNOWLEDGEMENTS
First and foremost, I would like to express my sincere gratitude to my supervisor, Prof. Dr. Mehmet Öztürk, who has always been helpful, understanding and patient, and has offered guidance generously throughout my Ph.D. studies. It is a great honor having a chance to work with him. He has always been my best teacher and mentor in helping me gaining skills in every aspect of scientific research. I will always treasure them.
Thanks to all MBG faculties and especially Assoc. Prof. Rengül Çetin-Atalay, Assoc. Prof. Işik Yuluğ, Assist. Prof. Can Akçali and Assist. Prof. Özlen Konu for their valuable advice, helps and supports during my PhD study.
I am very thankful to Dr. Hani Alotaibi, Sevgi Bağışlar and Haluk Yüzügüllü for their contributions to the critical experiments related with my thesis.
My special thanks go to group members: Ayça Arslan-Ergül, Şerif Şentürk, Nilgün Taşdemir, Sevgi Bağışlar, Haluk Yüzügüllü, Pelin Gülay and Dr. Hani Alotaibi for their friendship and experimental support during my most desperate times. We also shared many good memories together. In addition, I will never forget our former group members, Dr. Esra Erdal and Dr. Nuri Öztürk, for patiently teaching me lab techniques and helping me to pick up speed in my early years.
Special thanks to all my graduate friends, especially Ceyhan Ceran for their friendship and moral support.
I am thankful to all MBG family, especially Sevim Baran, Füsun Elvan, Abdullah Ünnü, Tülay Arayıcı, Bilge Özbayoğlu and Bilge Kılıç for willingly running for help whenever I needed, even during weekends.
The last but not the least, I want to thank to my family. Without their support and patience, this study would have never been finished.
vii
TABLE OF CONTENTS
ABSTRACT ... III ÖZET ... IV ACKNOWLEDGEMENTS ... VI TABLE OF CONTENTS ... VII LIST OF TABLES ... X LIST OF FIGURES ... XI ABBREVIATIONS ...XV CHAPTER 1. INTRODUCTION ... 18 1.1 Breast Cancer ... 18 1.1.1 Epidemiology ... 19 1.1.2 Molecular pathogenesis ... 20 1.1.3 Molecular subtypes ... 26
1.1.4 Breast cancer stem cells ... 27
1.1.5 Experimental creation of breast cancer ... 28
1.2 Cellular senescence ... 29
1.2.1 Replicative senescence ... 29
1.2.2 Oncogene-induced senescence ... 32
1.2.3-Oxidative stress and senescence ... 33
1.2.4 Mechanisms of senescence as a DNA damage response ... 35
1.3 Senescence and immortality in breast epithelial cells ... 36
1.3.1 In vitro senescence mechanisms ... 36
1.3.2 Experimental creation of breast cancer cells ... 39
CHAPTER 2. OBJECTIVES AND RATIONALE ... 42
CHAPTER 3. MATERIALS AND METHODS ... 44
viii
3.2.2. Tissue culture solutions ... 46
3.2.3. SDS-PAGE Solutions ... 47
3.2.4. Immunoblotting solutions ... 48
3.2.5. RNA Study Solutions ... 49
3.2.6. Immunofluorescence solutions ... 49
3.2.7. Oxidative Stress Reagents ... 50
3.2.8. Estradiol, Tamoxifen and Retinoic acid Solutions ... 50
3.3. Equipment ... 50
3.4. METHODS ... 51
3.4.1. Tissue Culture Studies ... 51
3.4.2. Protein studies ... 53
3.4.3. RNA studies ... 55
3.4.4. Low-density clonogenic assay ... 56
3.4.5. SABG (Senescence associated β-galactosidase) assay ... 57
3.4.6. SABG and BrDU (Bromo deoxyuridine) incorporation assay co-staining ... 57
3.4.7. Retinoic Acid treatment of breast cancer cell lines ... 57
3.4.8. NAC (N-acetyl-L-cysteine) treatment ... 57
3.4.9. Co-staining with DCFH-DA (2′-7′-dichlorodihydrofluorescein diacetate) and MitoTracker ... 58
3.4.10. NBT (Nitro Blue Tetrazolium) assay ... 58
3.4.11. Low density clonogenic assays and immunohistochemistry ... 58
3.4.12. Estrogen and tamoxifen treatment ... 59
3.4.13. Generation of estrogen receptor-overexpressing clones ... 59
3.4.15. Lentiviral infection and generation of p21Cip1 knock-down clones ... 60
3.4.16. Clinical Samples ... 60
3.4.17. Nude mice tumorigenicity assays ... 60
3.4.18. Statistical analyses ... 61
3.4.19. Cluster analysis ... 61
ix
4.1. Spontaneous senescence in breast cancer cells ... 63
4.1.1. Classification of breast cancer cell lines as senescent cell progenitor (SCP) and immortal cell progenitor (ICP) subtypes ... 64
4.2. Role of oxidative stress in breast cancer cell senescence ... 69
4.2.1. ROS accumulation is related with senescence ... 69
4.2.2. Relationship between ROS accumulation and senescence ... 73
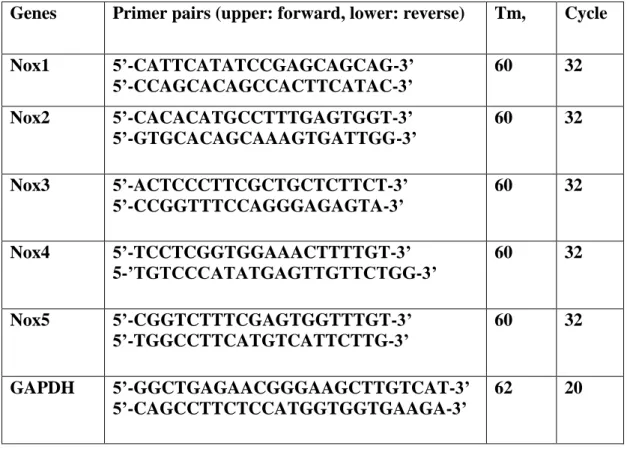
4.2.3. Differential expression of NOX genes in breast cancer cell lines ... 75
4.3. Role of P16INK4a and p21WAF1/Cip1 in breast cancer senescence ... 77
4.3.1. P16INK4a: No significant correlation between P16INK4a expression and SCP phenotype. ... 77
4.3.2. p21Cip1 expression correlates with SCP subgroup ... 78
4.3.3. p21Cip1 is partially responsible for senescent cell progenitor phenotype ... 80
4.4. Role of ER in breast cancer senescence ... 82
4.4.1. ER expression and senescence ... 82
4.4.2. Effect of Estrogen and Tamoxifen treatment ... 83
4.4.3. Effect of ER overexpression ... 86
4.4.4. Senescence in ER+ tumors ... 89
4.5. Senescence as a major determinant of breast cancer molecular heterogeneity... 90
4.5.1. Role of differentiation ability in SCP and ICP subtypes ... 90
4.5.2. Correlation of SCP and ICP subtypes with different breast tumor molecular subtypes ... 96
4.5.3. Differential tumorigenicity of SCP and ICP subtypes... 98
4.6. Effect of Retinoic acid in breast cancer cell senescence ... 101
CHAPTER 5. DISCUSSION AND FUTURE PERSPECTIVES ... 106
x
LIST OF TABLES
Table 1: Antibodies used in this study ... 59 Table 2: List of gene-specific primers used for expression analysis of Nox genes ... 62 Table 2: ER status, main pathological features of senescence staining (SABG) of
breast tumors used in this study ... 90 Table 3: Gene clusters, genetic mutations and epigenetic changes of breast cancer
xi
LIST OF FIGURES
Figure 1: Mammary gland, terminal ductal-lobular unit. (Dimri et al., 2005) ... 19 Figure 2: A subcellular model of estradiol (E2) action in target tissue. (Morrow and
Jordan, 1999) ... 22 Figure 3: A variety of intrinsic and extrinsic signals lead to the onset of senescence
(Ben-Porath and Weinberg, 2004). ... 30 Figure 4: The DNA-damage response (Campisi and d’Adda di Fagagna, 2007). ... 32 Figure 5: Activation of the senescence program (Ben-Porath and Weinberg, 2005). 36 Figure 7: HMF (human mammary fibroblast) and HMEC (human mammary
epithelial cells) growth curves (Romanov et al., 2001). ... 38 Figure 8: Model for steps in immortalization of cultured HMEC. (Stampfer and
Yaswen, 2003)... 39 Figure 8: Transformation of HMEC (Dimri et al., 2005). ... 41 Figure 9: Analysis of senescence phenotype in HCC and breast cancer cell lines. ... 63 Figure 10: Representative pictures of SABG staining in breast cancer cell line panel.
... 65 Figure 11: SABG staining results of breast cancer cell lines used in this study. ... 65 Figure 12: SABG index (% SABG positive cells/ colony) of breast cancer cell line
panel. ... 66 Figure 13: SABG index of T47D and BT-474 isogenic clones. ... 67 Figure 14: SABG and BrdU co-staining in Cama1, T47D, T47D-iso23 (isogenic
xii
Figure 15: Co-staining with DCFH and Mitotracker in Cama1 and MDA-MB-468 cell lines at Day 10. No significant ROS accumulation was observed in Cama1 cells. ... 70 Figure 16: Co-staining with DCFH and Mitotracker in Cama1 and MDA-MB-468
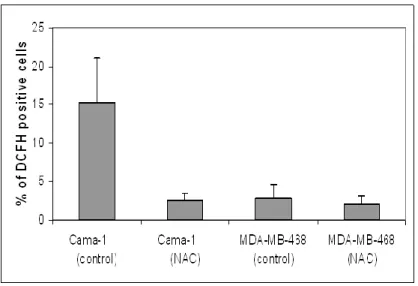
cell lines at Day 13. ... 71 Figure 17: Percentage of DCFH positive cells before and after NAC treatment in
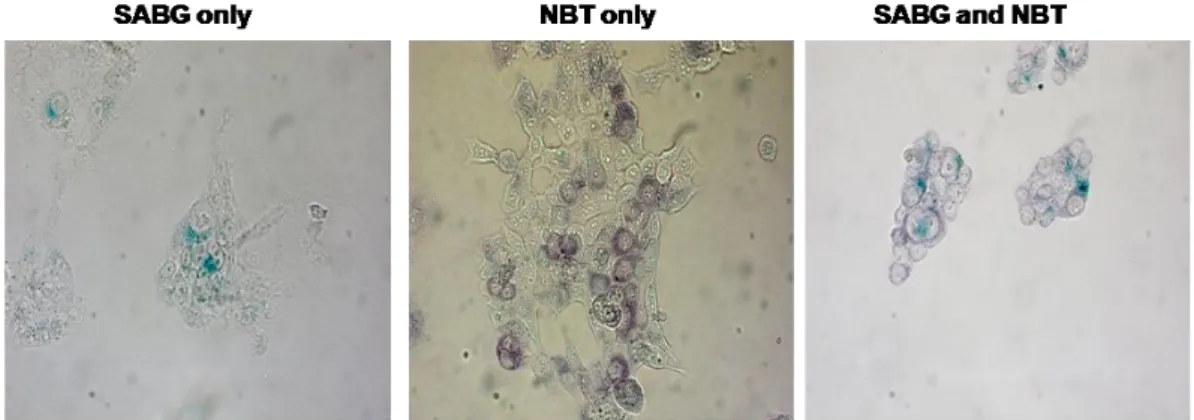
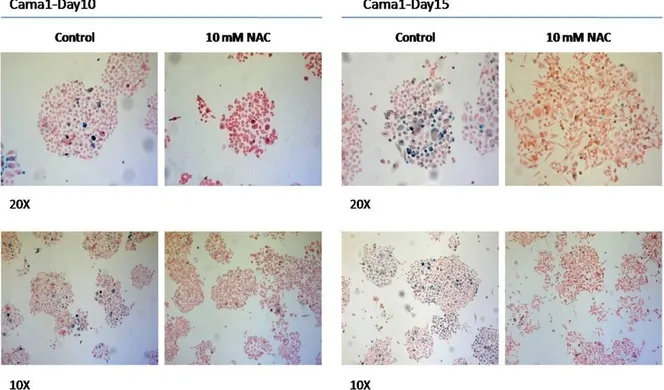
Cama1 and MDA-MB-468 plates at Day13... 72 Figure 18: Co-staining of BT474 cells with NBT and SABG. ... 73 Figure 19: SABG staining of Cama1 cells after treatment of NAC. ... 74 Figure 20: Quantification of SABG-positive cells in colonies from NAC treated and
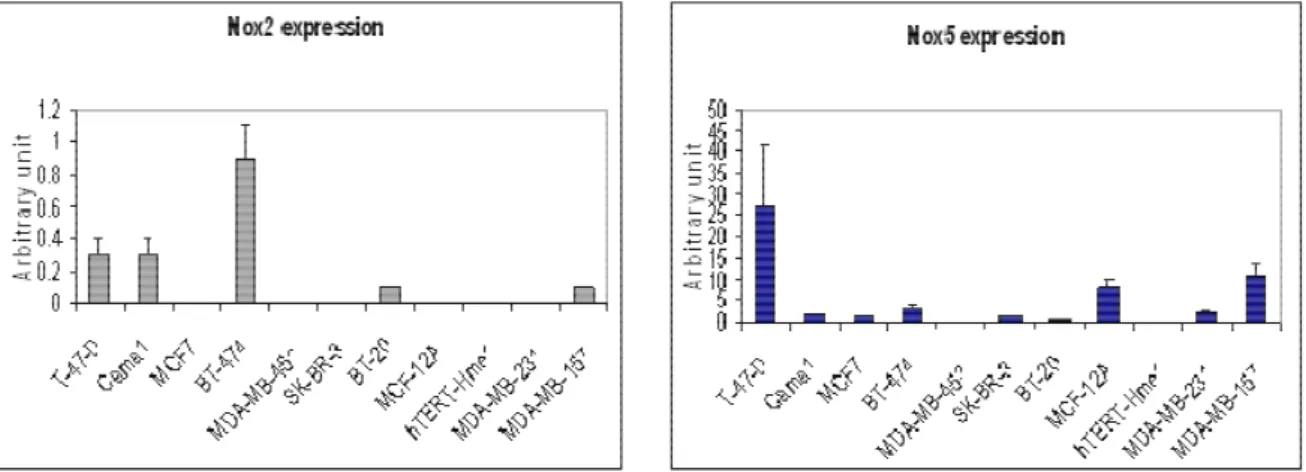
untreated Cama1 cell line. ... 75 Figure 21: Expression analysis of Nox genes in breast cancer cell line panel by
RT-PCR. ... 76 Figure 22: Real time PCR analysis of Nox2 and Nox5 expression in breast cancer
cell lines. ... 76 Figure 23: No significant correlation between P16INK4a expression and SCP
phenotype. ... 78 Figure 24: p21Cip1 correlate with SCP subgroup. p21Cip1 immunoperoxidase staining
in breast cancer cell lines panel. ... 79 Figure 25: Co-staining of SABG and p21Cip1 in T47D and MDA-MB-231 cell lines. ... 80 Figure 26: p21Cip1 is partially responsible from senescence arrest in T47D cell line 81 Figure 27: ER lost related with senescence phenotype in T47D cells. ... 83
xiii
Figure 28: Estrogen treatment decreased generations of senescent progeny whereas Tamoxifen (4OHT) treatment increased ... 85 Figure 29: ER overexpression caused increased BrdU incorporation in T47D clones.
... 87 Figure 30: ER overexpression inhibits generation of senescent progeny in T47D cells
... 88 Figure 31: Detection of SABG+ senescent cells in estrogen receptor-positive breast
tumors. ... 89 Figure 32: High density seeded MCF7 and T47D cells show more ASMA+
expression. ... 92 Figure 33: Representative pictures from marker studies A) Senescent Cell Progenitor subtype cell lines B) Immortal Cell Progenitor subtype cell lines ... 94 Figure 34: Summary of marker study results in breast cancer cell lines ... 95 Figure 35: Unsupervised hierarchical clustering of breast tumor and cell line gene
expression data from Sorlie et al. (2003) and Charafe-Jauffret et al. (2006). ... 97 Figure 36: SCP subtype and ICP subtype shows differential tumorigenicity in nude
mice. ... 99 Figure 37: Unsupervised hierarchical clustering of breast tumor and cell line gene
expression data. ... 101 Figure 38: SABG index and colony size after tRA treatment in MCF7 and Cama1
cell lines for treated and untreated groups. ... 103 Figure 39: SABG index and colony size after tRA treatment in BT474 and BT20 cell lines for treated and untreated groups. ... 104
xiv
Figure 40: SABG index and colony size in Cama1 cells after different dose of tRA treatment. ... 105
xv
ABBREVIATIONS
APS Ammonium Persulfate
ASMA Alpha smooth muscle actin
bp Base pair
BrdU 5-bromo-2-deoxyuridine
cDNA Complementary DNA
Ct Cycle threshold
Ck Cytokeratin
DCFH-DA 2’-7’ dichloro dihydro fluorescein
diacetate
DCIS Ductal carcinoma in situ
ddH2O Double distilled water
DES Diethyl stilbesterol
DEPC Diethlypyro carbonate
DMEM Dulbecco’s Modified Eagle’s Medium
DMSO Dimethyl sulfoxide
ER Estrogen receptor
E2 17-β-estradiol
xvi
FCS Fetal calf serum
HCC Hepatocellular carcinoma
ICP Immortal cell progenitor
µg Microgram mg Miligram min Minute µl Microliter ml Mililiter µM Micromolar mM Milimolar
mRNA Messenger RNA
nM Nanomolar
NAC N-acetyl-L-cystein
NBT Nitroblue tetrazolium
nM nanomolar
Nox NADPH oxidases
NP-40 Nonidet P-40
pmol picomol
PBS Phosphate Buffered Saline
xvii
PR Progesterone receptor
RA Retinoic Acid
RT-PCR Reverse transcription PCR
TAE Tris-Acetate-EDTA Buffer
TBS-T TBS tween
tRA All-trans-retinoic acid
Temed Tetramethyl ethylene diamide
TERT Telomerase reverse transcriptase
18
CHAPTER 1. INTRODUCTION
1.1 Breast Cancer
Development of breast starts during embryonic period. Ductal morphogenesis begins by a bud-like structure with branching, and then continues with elongation and canalization. Both smooth muscle actin and cytokeratin expressing basal cells appear at the end of the second trimester. Adult breast is composed of two types of cells: Myoepithelial cells and secretory luminal cells. It is possible to categorize different steps clinically and histopathologically during progression to malignancy. Ductal hyperplasia is accepted as a very early step of the malignancy. In this stage, cells are cytologically benign. Transformation from hyperplasia to atypical hyperplasia presents increased risk for breast cancer. The following step is ductal or lobular carcinoma in situ. Cells in this step show cytological characteristics of malignancy, but without stromal invasion across the basement membrane. Tumor becomes invasive when the cells detach from basement and invade the stroma. When the cells reach the blood and lymph vessels, it can easily metastasize distant organs and locoregional lymph nodes (Kenemans et al., 2004).
19
Figure 1: Mammary gland, terminal ductal-lobular unit. (Dimri et al., 2005)
Breast cancer appears as multistep process where accumulation of various genetic alterations can cause transformation of normal cells via steps of hyperplasia, premalignant change and in situ carcinoma (Beckmann et al, 1997). In recent years, it has been suggested that besides intrinsic malignant properties of tumor epithelial cells, other factors such as microenvironmental changes may play role in tumorigenesis (Hu and Polyak, 2008)
1.1.1 Epidemiology
Breast cancer is the most common malignancy and the second leading cause of cancer deaths in women (after lung cancer). Breast cancer comprises 15% of all female cancers. During 2009, over 190,000 new cases of invasive breast cancer are expected to occur among women in the US; about 1,900 for men. (Source: American cancer society).
Age is one of the most important risk factors for breast cancer, beside gender. Breast cancer incidence increases with age. Until menopause, disease incidence doubles every 10 years then slows down significantly.
20
Geographical variations also affect incidence and mortality. The difference between Western and Far East countries is fivefold, but it is declining.
Reproductive history could affect the incidence such as long menstrual history (early menarche and/or late menopause), recent use of oral contraceptives, nulliparity or having a first child after age 30.
In Western countries, 10% of breast cancer is due to genetic predisposition. Breast cancer susceptibility genes, BRCA1 and BRCA2, have been identified as a substantial proportion of high-risk families. In some populations, certain mutations occur at high frequency. For example, 2% of Ashkenazi Jewish women carry either BRCA1 185 del AG (deletion of two base pairs at position 185), BRCA1 5382 ins C (insertion of an extra base pair at position 5382) or BRCA 6174 del T (deletion of a single base pair at position 6174), while BRCA2 999 del 5 (deletion of five base pairs at position 999) accounts for about half of all familial breast cancer in Iceland. Li-Fraumeni and Cowden’s syndromes, associated with inherited mutations in p53 and PTEN respectively, carry high risk of breast cancer but both are rare (McPherson
et al., 2000).
Other risk factors of breast cancer include high-dose radiation to the chest, being overweight or obese after menopause, use of hormone replacement therapy (especially combined estrogen and progestin therapy), physical inactivity, and consumption of one or more alcoholic beverages per day.
1.1.2 Molecular pathogenesis
Hereditary breast cancer is characterized by an inherited susceptibility to breast cancer on the basis of an identified germline mutation in one allele of a high penetrance susceptibility gene (such as BRCA1, BRCA2, CHEK2, TP53 or PTEN). Inactivation of the second allele of these tumor suppressor genes would be an early event in this oncogenic pathway (Knudson’s “two-hit” model).
Sporadic breast cancers result from a serial stepwise accumulation of acquired and uncorrected mutations in somatic genes, without any germline mutation playing a
21
role. Mutational activation of oncogenes, often coupled with non-mutational inactivation of tumor suppressor genes, is probably an early event in sporadic tumors, followed by more, independent mutations in at least four or five other genes (the chronological order is not important). Oncogenes that have been reported to play an early role in sporadic breast cancer are MYC, CCND1 (Cyclin D1) and ERBB2 (HER2/neu). In sporadic breast cancer, mutational inactivation of BRCA1/2 is rare, as inactivation requires both gene copies to be mutated or totally be deleted. However, non-mutational functional suppression could result from various mechanisms, such as hypermethylation of the BRCA1 promoter or binding of BRCA2 by EMSY (Kenemans et al., 2004).
Until recently, breast cancer tumorigenesis has been described by a multi-step progression model. One or more distinct mutations in regulatory genes are associated with each of these steps (Beckmann et al, 1997). But recently, Melchor and Benítez proposed integrative hypothesis about origin and development of hereditary and sporadic breast cancer subtypes. In their approach they try to explain breast cancer tumorigenesis by combination of the cancer stem cell hypothesis (for the carcinogenesis processes) and the clonal selection model (in terms of tumor development). (Melchor and Benitez, 2008)
ER and breast cancer:
Estrogens are steroid hormones that play significant role in mammary gland development and physiology. They are produced mainly by developing follicles in the ovary which are operative only during menstrual life in women. Other endogenous source of estrogen is peripheral conversion of adrenal derived-androgens to estrogen in fat cells. Estrogen can also be supplied by exogenous sources such as oral contraceptives during reproductive years or hormone replacement therapies. Until 1970’s the use of DES (Diethyl Stilbestrol) during pregnancy was another exogenous source for estradiol. Later, it was shown that women who use DES have an increasing risk for development of breast cancer (Henderson et al., 1988).
22
Despite its role in normal mammary gland physiology, estrogen is implicated in development and progression of breast cancer based on the data both from clinical and animal studies (Henderson and Feigelson, 2000). Estrogen mediates its proliferative effect through an intracellular receptor, the estrogen receptor (ER). Steroid hormones are lipophilic and they enter the cell by diffusing through the plasma and nuclear membranes. Once estrogen enters the nucleus, it binds to ER. Estrogen binding to ER transforms the receptor to an active transcription factor, allowing it to bind estrogen response element (ERE) regulatory sequences in target genes, and regulate the transcription of target genes in the nucleus.
Figure 2: A subcellular model of estradiol (E2) action in target tissue. (Morrow and Jordan, 1999)
There are two receptors for estradiol, ERα and ERβ, which have distinct tissue expression patterns (Couse JF et al., 1999). Both ER receptors are members of the steroid/thyroid hormone nuclear receptor superfamily and are homologous in their DNA-binding and steroid binding domains. But ERβ gene is smaller, encoding a smaller protein and is located in a different chromosomal location. (Kumar V et al., 1987; Enmark E et al., 1997)
23
Since ER mediates estrogen activity, researchers have heavily studied the role of ER in breast cancer. Increased ER expression is probably one of the earliest changes occurring during breast cancer tumorigenesis. Increased ER expression has been shown in benign breast epithelium of women diagnosed to have breast cancer (Khan SA et al., 1994) and in the very early stages of ductal hyperplasia (Allred DC et al., 2001, Shoker BS et al., 1999). Another study also showed that breast tissue of Japanese women from a population with high risk of breast cancer expresses higher percentage of ERα compared to those who have a low risk of the disease (Lawson JS
et al., 1999). These and many other studies have indicated that ER receptor status is a
very important factor for evaluation of breast cancer patients. For example ER– (ER negative) breast tumor patients have early recurrence and poor survival compared to ER+ (ER positive) breast tumor patients. In addition, ER+ patients confer good response to endocrine therapy compared to ER- counterparts.
In clinics, several estrogen antagonists have been successfully used in breast cancer therapy. They target estrogen mediated proliferation pathways but their effectiveness change in different patients and their mechanism of action is not fully understood. There are two groups of antiestrogens: Steroidal and nonsteroidal. Antiestrogens such as ICI 164.384 and ICI 182.780 are steroidal compounds which have only antagonistic activities. Nonsteroidal antiestrogen agents such as tamoxifen and raloxifen have mixed agonist/antagonist action depending on the cell type. The antitumor effects of tamoxifen are thought to be mediated by competitive inhibition of estrogen due to its binding to estrogen receptors. As a result, tamoxifen inhibits the expression of estrogen-regulated genes. But recent data suggests that tamoxifen can cause conformational changes in the ER, change its interaction with specific accessory proteins and lead to its recruitment to the transcriptional machinery.
Epidermal Growth Factor (EGF) family of proteins:
Besides estrogen, other hormones perform essential roles in mammary gland development and also progression of mammary tumorigenesis. It has been shown that estrogen affects mammary epithelial cells both directly and indirectly by
24
modulating the expression of growth factors and their receptors. EGF-family of peptides is also involved in mammary gland regulation. EGF, Transforming growth factor- (TGFα) and Heregulin are implicated in breast cancer development. 83% of human breast tumors express EGF mRNA. 15-30% invasive tumors express EGF protein. EGF can promote anchorage dependent growth in mouse and human mammary gland. EGF mRNA level is found to be very high in estrogen receptor positive breast cancer cell line, T47D (Bowcock AM, 1999).
Transforming Growth Factor-β (TGFβ):
Most cells produce Transforming growth factor-β (TGFβ) and its growth receptor proteins. TGFβ signaling acts as a regulator in many cellular processes such as cell-growth regulation, development, morphogenesis, chemotaxis, connective tissue and extracellular matrix protein production. TGFβ is also a very important growth regulator for mammary gland development and this powerful growth inhibitory signal barrier is generally destroyed in cancer cells. Due to its pleiotropic and context-dependent effect, animal studies that target TGFβ signaling components gave different results about its action on breast cancer development. It is now mostly clear that elevated TGFβ plays tumor suppressive function at early stages of breast development, whereas it induces a malignant conversion and progression of cancer at later stages (Barcellos-Hoff and Akhurst, 2009).
Insulin-like Growth Factor (IGF):
It is shown that, there is an association between serum concentrations of insulin-like growth factor 1 (IGF1), IGF-binding protein 3 (IGFBP3), and increased risks of breast, prostate, colorectal, and lung cancers (Fürstenberger and Senn, 2002). Despite some controversies, meta-analysis results suggest correlation between circulating IGF1 level and cancer risk in pre-menopausel breast (Werner and Bruchim, 2009). IGFs and their binding proteins play role on cell proliferation, differentiation, and apoptosis. IGF1R signal transduction causes activation of several intracellular signaling pathways, including the Ras/Raf/MAP kinase and the phosphoinositide-3 kinase pathways. Moreover interaction between IGF receptors
25
and other cell surface receptors such as the estrogen, integrin, and cytokine receptors is important.
Oncogenes
Oncogene amplification is frequently found in breast cancer, but only a few of these amplified genes are important in breast cancer development, i.e. MYC, Int2, EMS1, BCL2, CCND1 and ERBB2. Oncogene amplification is not a very early event, but it can be found during DCIS (Ductal carcinoma In Situ) stage (Beckmann et al, 1997).
Tumor suppressor genes
The BRCA1 gene is located on chromosome 17q12-21 and participates in many transcriptional processes. It interacts with more than 15 different proteins that are involved in transcriptional activation or transcriptional repression. It also functions as a tumor suppressor and plays a role in apoptosis, DNA recognition and repair. Germline mutations in BRCA1 impose high risk to breast and ovarian cancer. In sporadic breast cancer, BRCA1 mutation is less frequently seen (Kenemans et al., 2004).
The BRCA2 gene which is located on chromosome 13q12-13, codes for a protein that play role in DNA repair, cell cycle control and transcription. It is also implicated in terminal differentiation of breast epithelial cells. BRCA1 and BRCA2 are high penetrance genes for breast cancer. Germ-line mutations of BRCA1 and BRCA2 are associated with 40-70% of familial breast cancers, including the hereditary breast and/or ovarian cancer sendrome (Beckmann et al, 1997).
p53 (TP53) is one of the most frequently mutated genes in sporadic human cancer, which is located on chromosome 17p13.1. Generally these mutations are point mutations that effect sequence-specific DNA binding and activation of p53-responsive genes. In sporadic breast carcinomas, TP53 mutation is a late event. Constitutional mutation of p53 is found in Li-Fraumeni sendrome but it is rare (Kenemans et al., 2004).
Other tumor supressors like Rb, PTEN, CHEK2 are also involved in breast cancer pathogenesis.
26
1.1.3 Molecular subtypes
Human breast tumors are very heterogenous in terms of their pathological and molecular profiles, and their clinical response to the therapy. In breast tumors, we could not observe one dominant pathway on the formation of tumorigenesis unlike colon cancer or pancreatic cancer. Also histological presentation of breast cancer is very diverse. Human breast tumors can be classified histologically into 18 subtypes at the time of diagnosis. Although this tumor classification helps physicians for prognostic evaluation of the patients, there is still quite variation in response to therapy (Stingl and Caldas, 2007).
Human breast tumors have been classified in terms of their gene expression profiling by microarray analysis (Perou et al., 2000). According to their gene expression patterns, breast tumors could be categorized into five molecular subtypes: Luminal A, Luminal B, ERBB2 (HER2), basal, and normal-like. These subtypes reflect the gene-expression patterns of the two principal epithelial-cell types in the normal adult breast: the luminal epithelial cells and myoepithelial cells. Luminal tumors are ER+ positive tumors. They express ER responsive genes and other genes that encode characteristic proteins of luminal epithelial cells like PR, GATA3, BCL-2, and the luminal cytokeratins CK8 and CK18. The HER2+, normal breast-like and basal-like subtypes are predominantly ER-negative. A subset of ER-positive and HER2-positive tumors cluster with the luminal B subtype. HER2+ tumors express high levels of genes located in the HER2 amplicon on chromosome 17q21, including HER2 and growth factor receptor-bound protein 7 (GRB7). Normal breast-like tumors express non-epithelial genes and genes in the basal cluster. Basal-like tumors are largely ER-, PR- and HER2-negative (triple negative) and express genes characteristic of basal epithelial cells and normal breast myoepithelial cells, including the basal cytokeratins CK5 and CK17. Importantly, later studies associated these breast-cancer subtypes with distinct clinical outcomes (Sorlie T et al., 2001; Sotiriou C et al., 2003). In Sorlie’s study, they found significant difference in overall and relapse- free survival between tumor subtypes. While ER+ Luminal A subtype has most favorable prognosis, ER-, HER2+ and basal-like subtypes are associated
27
with shortest and relapse-free survival. Sotiriou’s result provided supporting evidence for the previous studies. Moreover they found that ER status is a better discriminatory factor for tumor subtypes instead of other clinical features and tumor grade. These findings suggest that ER biology plays pivotal role in breast tumorigenesis and final configuration of breast cancer.
1.1.4 Breast cancer stem cells
Unlike other organs, human mammary gland undergoes many structural changes throughout adult life. In humans, before birth mammary fat pad is already invaded by branching network of ducts. Ducts are mainly composed of myoepitelial cells and specialized luminal layer of epithelial cells. During puberty, with hormonal stimulation ductal side branching occurs. Extensive proliferation and terminal differentiation is achieved during pregnancy and lactation by formation of lobulo-aciner structures which contain milk-secreting alveolar cells. After cessation of lactation, apoptosis and tissue remodeling convert mammary gland to pre-pregnancy state. In order to achieve this kind of great plasticity, mammary gland must contain stem cells or early progenitor cells that have ability to differentiate and proliferate. It has been proposed that stem cells may be potential targets for malignant transformation (Reya et al., 2001). It is hypothesized that normal stem cells and cancer cells share many similar characteristics like self renewal capacity and differentiation ability. When mutations are accumulated in cancer stem cells their functions could be distrupt and ultimately resulting with self-renewal deregulation, tumorigenesis and aberrant differentiation which generates cellular heterogeneity found in tumors. Cancer stem cells were first demonstrated in hematological malignancies (Bonnet and Dick, 1997) and later, in solid tumors of breast, brain, lung, colon, pancreas, prostate (Al-Hajj et al, 2003; Prince et al., 2007; Eramo et al., 2008; Dalerba et al., 2007; Li et al., 2007; Ceder et al., 2008). Al-Hajj and colleagues identified that a small population of breast cancer cells had ability to form tumor in NOD/SCID mice. These cells were identified by surface markers (CD44+/CD24-/lowLineage-). They also noticed that tumors formed in mice share same phenotypical heterogeneity with the initial tumor. Therefore CD44 + CD24–/low
28
lin– population shows cancer stem cell characteristics like self renewal, differentiation and tumorigenic potential. It appers that CD44 is a shared stem cell marker and common to different organs and pathologies. But probably CD44+CD24–
/low
Lin– phenotype is tissue-restricted. For example, in pancreatic tumors, a stem cell population with the CD44+CD24–/low Lin+ phenotype was isolated.
Human mammary tumor-initiating cells isolated from patients express EpCAM+CD44+CD24-/low phenotype. CD24 is expressed only by human luminal epithelial cells, like MUC1. No expression of CD24 in tumor initiating cells indicate that these cells are located in basal epithelium (Stingl et al., 2007)
1.1.5 Experimental creation of breast cancer
To understand molecular pathways involved in breast cancer development mouse models have been used in many studies. In early studies chemical carcinogens were used in these models to induce breast cancer. Different genes expressed under either the MMTV (mouse mammary tumor virus) or the WAP (whey acidic protein) promoter was preferred in later studies for the same purpose. These are viral proteins, such as SV40 large T, polyoma virus T antigen or cellular proteins such as c-Myc, ErbB2/neu, cyclin D1, cyclin E, ERs, mutant p53, c-Ha-ras, and Wnt-1. Current studies generally examine function of cell cycle proteins or tumor suppressors by knockout model. Recent findings indicate important role of cyclin D1 overexpression in a subset of human breast cancers. Altogether some oncogenes and pathways are described in mammary gland tumorigenesis, including p53, pRb, BRCA1/2, cyclins, CDKs, ErbB2, c-Myc, Wnt-1, ER, and progesterone receptor. Another important finding is that these proteins or pathways seem to target different cell types or progenitors during tumorigenesis. It has been reported that expression of Wnt1 proto-oncogene in transgenic mice generated tumor and this tumor expresses progenitor cell markers and contains both luminal and myoepithelial cells. On the other hand, mammary tumors from transgenic mice expressing Neu, H-Ras, or polyoma T antigen are lacking progenitor cell marker expression and contain only myoepithelial cells (Li et al., 2003; Dimri et al., 2005).
29
1.2 Cellular senescence 1.2.1 Replicative senescence
Most of the primary cells undergo a limited number of cell division and then they are arrested indefinitely in G1 phase of cell cycle. This state is known as replicative senescence. It was first demonstrated by Hayflick and Moorhead more than fifty years ago. They revealed that normal embryo fibroblasts have limited number of cell divisions and then they cease proliferation (Hayflick and Moorhead, 1961). Senescence is described as a defense program leading to irreversible cell cycle arrest that protects cell when it is exposed to internal and external stress signals (Schmitt et
al., 2007). Because of this characteristic of senescence, it is also described as a
tumor-suppressive mechanism or anti-carcinogenic program (Collado et al., 2007; Shay and Roninson, 2004). We now know that replicative senescence is due to three main reasons: erosion of telomeres in every round of cell division, accumulation of unrepaired DNA and activation of tumor-suppressive pathways, P53 and Rb (Harley
30
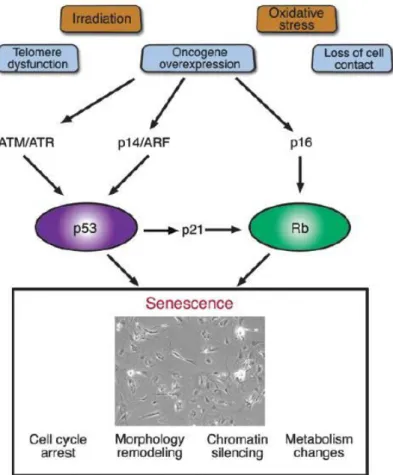
Figure 3: A variety of intrinsic and extrinsic signals lead to the onset of senescence (Ben-Porath and Weinberg, 2004).
Telomers are composed of stretches of repetitive DNA (tandem hexameric repeat units-5′-TTAGGG-3′ in vertebrates) and associated proteins that cap the ends of linear chromosomes. Telomeric cap protects chromosome from degradation or fusion by DNA-repair processes (d’Adda di Fagagna F, 2004). Telomeres are thought to end in a large circular structure, called T‑loop. During every S-phase, cells lose 50– 200 base pairs of telomeric DNA because DNA polymerase cannot totally replicate DNA ends, called end-replication problem. Human telomeres range from a few kb to 10–15 kb in length. So it is possible for cells to generate many cell divisions before their telomeres are shortened critically to trigger senescence. Cells do not proliferate indefinitely mainly because of end-replication problem.
31
Dysfunctional telomere is recognized as a double strand break that activates DNA damage response (DDR). DDR activation causes cell-cycle arrest (senescence). DNA-damage foci can be detected in senescent cells. These foci contain many DDR proteins, such as γ-H2AX, 53BP 1, MDC1, NBS1, MRE11 and RAD17. Also senescent cells express activated protein kinases, ATM, ATR and their downstream targets CHK1, CHK2 which propagate damage signal to effector molecules such as p53 (Herbig U et al.,2004; d’Adda di Fagagna, F. et al. 2003). Telomerase which consists of a catalytic protein component (telomerase reverse transcriptase; TERT) and a template RNA component can prevent end-replication problem by adding DNA repeats to chromosome ends. Normal cells do not express TERT whereas germ-line cells and many cancer cells do. In human cells, ectopic TERT expression hinder senescence and telomere shortening (Bodnar et al., 1998). But senescence triggered by non-telomeric DNA damage or other inducers cannot be prevented by telomerase (Chen QM et al., 2001).
32
Figure 4: The DNA-damage response (Campisi and d’Adda di Fagagna, 2007).
1.2.2 Oncogene-induced senescence
Besides telomere dysfunction, senescence can be induced by different types of stresses such as oncogene activation. It has been shown that normal cells in culture enter senescence in response to the overexpression of the RAS oncogene (Serrano et
al., 1997) or down-stream effectors RAF, activated MAP kinase and the PML
oncoprotein (Zhu et al., 1998; Pearson et al., 2000). Oncogene-induced senescence has been suggested as a tumor-suppressive mechanism of cells to prevent them from uncontrolled proliferation triggered by abnormal activation of proliferation-driving oncogenes (Weinberg and Ben-Porath, 2005). Recently Courtois-Cox et al. propose that oncogene-induced senescence might not be the result of hypermitogenic signaling, and instead of hyperactivation of RAS pathway, inactivation of it causes senescence (Courtois-Cox et al., 2006).
33
Some recent studies presented evidences that DDR might also contribute oncogene-induced senescence. It is shown that some oncogenes, such as RAS, CDC6, cyclin E, and STAT5, induce both senescence and DDR which is triggered by DNA hyper-replication (Di Micco et al., 2006; Malette et al., 2007).
Nevi, which are benign type of melanocytic tumors, carry activating mutation in the BRAF protein kinase. Michaloglou and collaborators showed that human nevi present all the characteristics of oncogene-induced senescence, like carrying an activated oncogene product (BRAFE600), expressing elevated levels of p16INK4a and SABG (Senescence associated β-Gal) activity. Additionally, they do not show telomere erosion. This and other evidences suggest that oncogene induced senescence in nevi present barrier to malignant transformation (Michaloglou et al., 2005).
In mouse, RAS activation induces senescence through p19ARF-p53-p21-Rb pathway but in human, mainly through p16ink4a-Rb pathway (Serrano et al., 1997). But recently Collado and colleagues presented new senescence markers related with oncogene-induced senescence by using mouse model (RASV12 knock-in mice) in lung adenoma. These are p15INK4b, Dec1 and DcR2 (Collado et al., 2005).
1.2.3-Oxidative stress and senescence
Reactive oxygen species (ROS) have shown to be connected with the process of senescence and organismal aging (Chen and Ames, 1994; Lee AC, 1999; Lundberg and Weinberg, 2000).
ROS are produced by different sources such as mitochondria and membrane bound enzymes, NADPH-oxidases. ROS play important physiological roles during cellular processes, and their level is strictly regulated by redox homeostasis. At high concentrations, ROS are known as toxic by-products of metabolism, and they causes damage to lipids, proteins and DNA. Oxidative stress has been connected with
34
several diseases such as cancer, atherosclerosis, pulmonary fibrosis and neurodegenerative diseases (Thannical VJ, 2000). On the other hand, at moderate concentrations, reactive oxygen species act as signaling molecules in different important physiological processes. For example, superoxide and other ROS types have been implicated in control of ventilation, erythropoietin production, smooth muscle relaxation, as well as involvement in signal transduction and gene expression (Droge et al., 2002). Superoxide anion is produced by the reduction of molecular oxygen. NADPH oxidase, xanthine oxidase or mitochondrial electron transport chains are mainly responsible from superoxide generation. These highly unstable superoxides immediately alter to hydrogen peroxide and then to water by catalase or glutathione peroxidase. When transition metal ions (ferrous and cuprous ions) interact with superoxide and hydrogen peroxide, they modify them to highly reactive hydroxyl radical (∙OH).
After the mitochondria, NADPH family of oxidases is the second important generator of ROS in mammalian cell. Neutrophils and macrophages produce high amounts of ROS by phagocyte NADPH oxidase (Phox) to combat microbial pathogens. Phagocyte NADPH oxidase consists of gp91phox and the regulatory subunits p22phox, p47phox, p40phox and p67phox. However, non-phagocytic cells contain different types of Nox enzymes, which are homologous to gp91phox and generate low level of ROS. NADPH family of oxidases, comprising of five different Nox enzymes (Nox1, Nox2, Nox3, Nox4 and Nox5) and two Duox (Duox1 and Duox2). These enzymes are localized in the membrane. They all share an amino-terminal hydrophobic domain, composed of six transmembrane α-helices: the third and fifth helices, each containing two histidine residues which accommodate two heme binding sites. Carboxyl part of the enzyme holds binding sites for either flavin adenine dinucleotide (FAD) and NADPH, which are located in the cytoplasm. Alternatively, Nox5 enzymes carry gp91phox core structure and additionally amino-terminal calcium binding domain (Lambeth et al., 2004).
ROS and senescence association has been studied heavily in different organisms and cell types. It has been demonstrated that senescent cells have higher amount of ROS
35
than normal cells (Hagen et al., 1997). Similarly, treatment of primary fibroblasts with non-lethal dose of H2O2 causes senescence-like growth arrest (Chen and Ames,
1994). In Drosophila, overexpression of catalase or superoxide dismutase is result in organismal life-span increase (Parkes et al., 1998; Orr and Sohal, 1994). Moreover, Nox4 overexpression in NIH3T3 cells results in cellular senescence (Shiose et al., 2001; Geiszt et al., 2000).
1.2.4 Mechanisms of senescence as a DNA damage response
Many cell types can undergo senescence after DNA damage, which is generated by irradiation or treatment with DNA damaging agents. Like telomere-initiated senescence, DNA-damage induced senescence depends on p53-p21 pathway (DiLeonardo et al., 1994). Stabilization of p53 after DNA damage probably is maintained by ARF (Khan et al., 2004). On the other hand, in many cells, p16 plays important role to induce senescence after DNA damage and dysfunctional telomeres. It is suggested that DNA damage first inducs p53 and p21 for initial response and then p16 which supplies maintenance for senescence state (Ben-Porath and Weinberg, 2005).
36
Figure 5: Activation of the senescence program (Ben-Porath and Weinberg, 2005). Many chemotherapeutic drugs can induce senescence-like arrest especially the ones that affect DNA structure. Such drugs trigger senescence in some tumor cells in addition to normal cells and they cause severe DNA damage. Chang et al. showed that moderate doses of doxorubicin initiate senescence-like phenotype in tumor cell lines (Chang et al., 1999a). In another study, they also observed that drug-induced senescence in HCT116 and HT1080 cell lines is declined several fold but not totally abolished after inhibition or knockout of p53 or p21 (Chang et al., 1999b). Drug-induced senescence is observed in tumor cells in vivo as well (Shay and Roninson, 2004)
1.3 Senescence and immortality in breast epithelial cells 1.3.1 In vitro senescence mechanisms
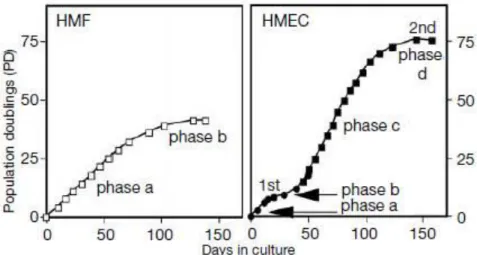
Senescence in normal cells is a very powerful barrier to protect cells from tumor development. Human fibroblast and human epithelial cells present some differences when they are entering senescence state. Romanov et al. analyzed proliferation barriers in human mammary fibroblasts (HMF) and human mammary epithelial cells (HMEC) in vitro. They showed that human fibroblast undergo one phase of
37
proliferation before entering senescence whereas HMECs exhibit two phases of proliferation and plateau. They showed that, both HMFs and HMECs go through a limited number of divisions before reaching the plateau. In human fibroblast, this plateau (phase b) is also termed as Hayflick limit, replicative senescence or M1. In HMECs they called M0 or selection. Characteristics of this stage; enlarged size and flattened shape, SABG positive staining, low incorporation of BrdU (5-bromo-2-deoxyuridine) (indication of low proliferation), minimal presence of MCM2 protein, 2N/4N is >4 and low Annexin-V staining (indication of low death). Compared to fibroblast HMEC can overcome from this stage and continue to proliferate ~20-70 PD (population doublings) before entering second plateau. HMECs that survive from first plateau lose expression of p16 protein. In second stage of growth plateau (called M1 or agonescence), HMECs show characteristics of crisis instead of senescence. They are heterogeneous in size and morphology, incorporate with BrdU, express high levels of MCM2 and 2N/4N is ~1. Also they present high staining with Annexin-V, indicating that high proliferation goes with high cell death. Chromosomal abnormalities in HMECs are also observed in phase c. When the telomere status is analyzed, HMFs and HMECs showed low telomerase activity and telomere erosion in similar level. Telomere shortening continued in post-selection HMECs at the range of ~3.5kb (55% decrease). Examination of senescence mediator proteins showed minimal changes in p53 and p21 protein expression and increase in p16 protein level during first growth plateau in HMECs. They observed p53 increase during emergence from senescence instead of induction of senescence (phase b) or second plateau (phase d). Increase in p14ARF, p21 and decrease in p16 is also seen during p53 up-regulation (Figure 7) (Romanov et al., 2001).
38
Figure 6: HMF (human mammary fibroblast) and HMEC (human mammary epithelial cells) growth curves (Romanov et al., 2001).
In another study, Stampfer and Yaswen, proposed that first barrier to immortalization is driven by Rb pathway respond to accumulated stress in vitro and in vivo. Rb inactivation is prevented by increased expression of CKIs. In HMEC, first growth arrest is related with elevated levels of p16INK4A and telomere independent. HMECs that overcome from fist barrier faces with telomere erosion and genomic instability, which leads to telomere-dependent proliferation barrier. If p53 function is absent, cell death occurs (termed as crisis). If p53 is functional, viable arrest is observed (termed agonescence). They also suggest that to derepress telomerase activity in p16- HMEC and to overcome stasis c-myc and ZNF217 amplifications are necessary. Conversion to immortalization is achieved after expression of telomerase in HMECs. Interestingly they detect telomerase activity just after loss of p53 function (Stampfer and Yaswen, 2003).
39
Figure 7: Model for steps in immortalization of cultured HMEC. (Stampfer and Yaswen, 2003).
1.3.2 Experimental creation of breast cancer cells
Great percentage of human breast cancer emerges from epithelial cells and they carry combination of mutations that control cell proliferation and survival. To understand the nature of biochemical alterations that leads to transformation of normal cells to tumor cells researchers tried to create carcinoma cells from immortalized HMEC by introducing cancer-associated genes. Recently Weinberg and colleagues established a multistep model for conversion of primary HMEC into tumorigenic state (Figure 8) as reviewed in Dimri et al., 2005. They serially introduced three genes, SV40 large-T antigen, hTERT and H-Ras oncoprotein into primary HMECs, which already bypassed initial M0 growth arrest. Tumorigenicity was determined by ability of tumor formation in nude mice by injecting cells subcutaneously and by
anchorage-40
independent growth in soft agar by forming colonies. It was shown that introduction of the large T antigen, which inactivates p53 and pRb to abolish senescence, activates hTERT to promote immortalization and oncogenic H-ras to provide constitutive mitogenic signaling. They also associated HMEC transformation with amplification of c-myc and ras oncogene expression level. By this method, when injected into nude mice, transformed HMEC generates poorly differentiated carcinoma (Elenbaas et al., 2006). Also it is shown that SV40 small t, which inhibits protein phosphatase 2A, has an important role in transformation of HMEC (Hahn WC et al., 2002). Other studies, which analyze role of small-t, showed that small-t activates PI3K pathway and active version of Akt1 and Rac1, which are downstream targets of PI3K, can substitute small-t function during transformation process (Zhao
et al., 2003). Raf and Ral-GEF pathways are also implicated in epithelial
transformation process in a cell type-specific manner (Dimri et al., 2005). Another recent study showed the importance of Bmi1. They achieved tumorigenic transformation of MCF10A, non-transformed, immortalized cell line, by co-overexpresion of Bmi1 and H-Ras (Datta S et al., 2007). All these studies show that interruption of several cellular pathways could cause tumorigenic transformation in human cells.
41
42
CHAPTER 2. OBJECTIVES AND RATIONALE
Breast cancer is the most common malignancy and despite the improvements of diagnosis and therapies still second leading cause of death among women.
Breast cancer is a heterogeneous disease in terms of histopathological and molecular features. Human breast tumors can be classified histologically into 18 subtypes at the time of diagnosis. Moreover, clinical response of patients to breast cancer therapies varies among the patients (Stingl and Caldas, 2007). Therefore, there is a great need for better understanding of molecular nature and tumorigenesis of disease.
Normal mammalian somatic cells have finite replicative potential in culture (Hayflick and Moorhead, 1961). After certain number of doublings, they cease to proliferate and undergo some biochemical and morphological changes which is referred as senescence. On the other hand, cancer cells have limitless replicative potential (Hanahan-Weinberg, 2000). In contrast to this general concept, our group observed that some of the Hepatocellular carcinoma-derived and breast cancer-derived cell lines enter senescence spontaneously (Ozturk N et al., 2006). Senescence has been suggested as a barrier against tumorigenesis and proposed as a potent anticarcinogenic program (Reddel, 2000). For these reasons, we believed that characterization of this observed senescence phenotype and clarification of the mechanism serve great importance for generation of possible therapies related with induction of senescence in breast cancer.
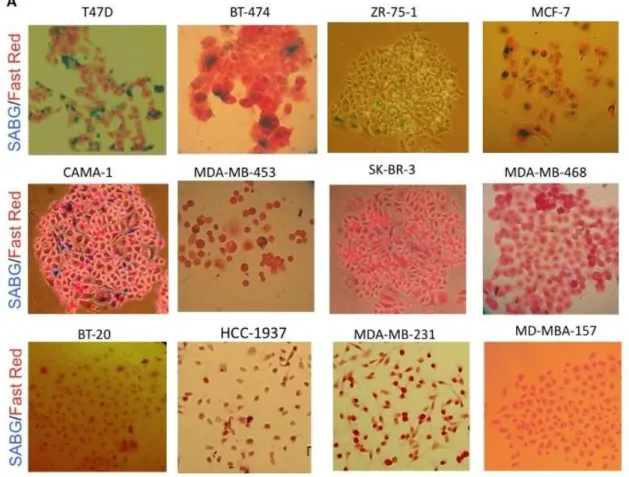
In the beginning of our studies, a panel of breast cancer cell lines was screened by using low-density clonogenic assay and SABG (senescence associated β-gal) methods. We found that only 5 out of 12 breast cancer cell lines showed senescence phenotype in different percentage. More interestingly, breast cancer cell lines, which display senescence, produce heterogeneously positive SABG colonies. These results lead us to hypothesize that generation of senescent progeny that we observed in a group of breast cancer cell lines could be the result of their stem cell capacity and differentiation ability.
43 Therefore our aims in this study were:
To characterize senescence phenotype and its relationship with their stem cell and differentiation capacity; and to characterize the mechanism underlying this phenomenon
44
CHAPTER 3. MATERIALS AND METHODS
3.1. MATERIALS
3.1.1. Reagents
All laboratory chemicals were biotechnology grade from Sigma (St. Louis, MO, U.S.A), Farmitalia Carlo Erba (Milano, Italy), Merck (Schucdarf, Germany) and Amresco (Ohio, USA). Agarose was obtained from Prona (EU).
3.1.2. Oligonucleotides
Oligonucleotides used in polymerase chain reaction (PCR) were synthesized by IONTEK (Istanbul, Turkey).
3.1.3. Primary antibodies
The following antibodies were used: CD44 (559046; BD Pharmingen), anti-CD24 (sc53660; Santa Cruz,), anti-ASMA (ab7817; Abcam), anti-CK19 (sc6278; Santa Cruz,), anti-p21Cip1 (OP64; Calbiochem), anti-p16Ink4a (NA29, Calbiochem), and anti-ERα (sc8002; Santa Cruz).
3.1.4. Antibiotics
Geneticin-(G418 Sulfate) 500 mg/ml solution in double-distilled water. Sterilized by filtration and stored at -20°C (stock solution). 500 µg/ml (working solution for stable cell line selection), and 250 µg/ml (working solution for maintenance of stable cell lines).
3.1.5. Oxidative Stress Detection Reagents
2′-7′-dichlorodihydrofluorescein diacetate (DCFH-DA) was from Sigma, Taufkircher, Germany.
45
3.1.6. Preparation of charcoal treated FCS:
100 ml FCS (Fetal calf serum) was heat inactivated at 56C for 30 min. Then 20mg/ml charcoal were added FCS and incubated overnight at cold room with stirring. After incubation FCS was centrifuged in Beckman ultrasantrifuj at 20,000 rpm for 20 min. Charcoal incubation was repeated for 8 hours and then santrifuj again in the same conditions. Later FCS was filtered twice. Before using in cell culture filtration was repeated under the hood.
3.2. SOLUTIONS AND MEDIA
3.2.1. General Solutions
50X Tris-acetic acid-EDTA (TAE): 2M Tris-acetate, 50mM EDTA pH 8.5. Diluted to 1x for working
solution
Ethidium bromide: 10 mg/ml in water (stock solution), 30
ng/ml (working solution)
1X Gel loading buffer:
0.25% bromophenol blue, 0.25% xylene cyanol, 50% glycerol, 1mM EDTA
Bradford Stock Solution 4.75 ml of 95 % ethanol, 10 ml of 85% phosphoric acid , 17.5 mg Coomassie Brilliant Blue. Stored in dark at 4°C.
46
Bradford Working Solution 21.25 ml double distilled water, 0.75 ml of 95% ethanol, 1.5 ml of 85% phosphoric acid 1.5 ml of Bradford stock solution. Filtered through Whatman No.1 paper and prepared freshly.
3.2.2. Tissue culture solutions
DMEM/RPMI working medium 10% FBS, 1% penicillin/streptomycin, 1% Non-Essential Amino Acid were added and stored at 4oC.
10X Phosphate-buffered saline (PBS) Per liter: 80 g NaCl, 2 g KCl, 14.4 g
Na2HPO4, 2.4 g KH2PO4, pH 7.4
47
3.2.3. SDS-PAGE Solutions
30% Acrylamide mix (1:29) Per 100 ml: 29 g acrylamide, 1 g
bisacrylamide in double-distilled water, filtered, degassed, and stored at 4°C (stock solution).
5X SDS gel-loading buffer: 3.8 ml double-distilled water, 1 ml of 0.5 M Tris-HCl, 0.8 ml glycerol, 1.6 ml of 10% SDS, o.4 ml of 0.05% bromophenol-blue. Before use, β-mercaptoethanol was added to final concentration of 5% to reach 1% when mixed with protein samples.
5X SDS-electrophoresis buffer Per liter: 15.1 g Tris base, 95 g Glycine,
5 g SDS. Diluted to 1X for working solution. Store up to 1 month at 4°C.
10% Ammonium persulfate (APS) 0.1 g/ml solution in double distilled
water. (Prepared freshly).
1.5 M Tris-HCl, pH 8.8 : 54.45 g Tris base (18.15 g/100 ml) ~150 ml distilled water Adjust to pH 8.8 with 1N HCl. Completed to 300 ml with distelled water and stored at 4° C.
48
1 M Tris-HCl, pH 6.8: 12.14 g Tris base ~ 60 ml distilled water Adjust to pH 6.8 with 1 N HCl.
Completed to 100 ml with distilled water and store at 4° C.
3.2.4. Immunoblotting solutions
Semi-dry transfer buffer Per liter: 48 mM Tris-base, 39 mM
glycine, 0.037% SDS, 20% methanol.
310X Tris-buffer saline (TBS) Per liter: 100 mM Tris-base, 1.5 M
NaCl, pH 7.6 in double distilled water.
TBS-Tween (TBS-T) 0.1-0.5% Tween-20 solution in TBS. (Prepared freshly)
Blocking solution 3-5% (w/v) non-fat milk, 0.1-0.5%
Tween-20 in TBS. (Prepared freshly).
49
3.2.5. RNA Study Solutions
DEPC-treated water 0.1% Diethylpyrocarbonate (DEPC)
(v/v) in double-distilled water was stirred in loosely plugged bottle. Then autoclaved and stored at room
temperature.
3.2.6. Immunofluorescence solutions
H33258 fluorochrome dye 1 mg/ml solution in double-distilled water and stored at -20 °C.
Working solution was 1 µg/ml.
DAPI (4', 6-diamidino-2-phenylindole) 0.1-1 µg/ml (working solution in PBS).
4% paraformaldehyde 4 g paraformaldehyde, in 100 ml. PBS, Stir 4 hours at 58°C, pH 7.4. Stable at
4°C for a week.
Permeabization solution 100µl TritonX-100 in 100 ml PBS BSA (Bovine serum albumin) 3% BSA in 1 X PBS (3 g in 100 ml).
50
3.2.7. Oxidative Stress Reagents
DCFH-DA Solution 10 mM HEPES (pH 7.5), 10 mM
glucose, and 1 μM DCFH-DA (dissolved in methanol) in 1X PBS. Prepared
freshly.
3.2.8. Estradiol, Tamoxifen and Retinoic acid Solutions
All-trans-retinoic acid (tRA), 17-β-estradiol (E2) and 4-hydroxy tamoxifen (4-OHT) were purchased from Sigma.
tRA was dissolved in DMSO as 10 mM stock solutions, E2 and 4-OHT was dissolved in ethanol as 1 mM stock solutions. All stock solutions were stored and protected from light at -20°C.
3.3. Equipment
Spectrophotometer Nano Drop ND-1000
Horizontal electrophoresis apparatus E-C Thermo Apparatus Corporation
Power supplies Power-PAC200 and 300, Bio Rad
PCR machine Techne, TC-512
Mini vertical gel system Thermo EC120
Semi-dry transfer cell Bio-Rad
51
Inverted light microscope, Axiovert 25 Zeiss Flourescent microscope, AxioCam MRc5 Zeiss, Axiovision Rel 4.6
Hood Holten
CO2 Incubator Holten cell house
3.4. METHODS
3.4.1. Tissue Culture Studies
3.4.1.1. Cell lines and Growth conditions of cells:
Breast cancer-derived cell lines (T-47-D, BT-474, MCF 7, BT-20, MDA-MB-453, CAMA-1, SK-BR-3, MDA-MB-157, ZR-75-1, MDA-MB-468, MDA-MB-231 and HCC-1937; all from ATCC) were used in this study. T-47-D, 474, MCF-7, BT-20, MDA-MB-468, MDA-MB-453, MDA-MB-231, were grown in Dulbecco’s modified Eagle’s medium (DMEM) supplemented with 10% FCS and 50 mg/ml penicillin-streptomycin. CAMA-1 and MDA-MB-157 were cultivated in DMEM supplemented with 10% FCS, 50 mg/ml penicillin-streptomycin and 1% sodium pyruvate. ZR-75-1 and SK-BR-3 were cultivated in RPMI (glucose rich; 4.5g/L) medium (Sigma) and McCoy (Biochrom) medium accordingly, supplemented with 10% FCS and 50 mg/ml penicillin-streptomycin.
3.4.1.2. Thawing cell lines:
One vial of the frozen cell line from the liquid nitrogen tank was taken and immediately put into ice. The vial was left 1 minute on the bench to allow excess
52
nitrogen to evaporate and then placed into 37oC water bath until the external part of the cell solution was thawed (takes approximately 1-2 minutes). The cells were resuspended gently using a pipette and transferred immediately into a 15 ml. sterile tube containing 10 ml cold fresh medium. The cells were centrifuged at 1500 rpm at 4oC for 5 minutes. Supernatant was discarded and the pellet was resuspended in 10 ml 37oC culture medium to be plated into 100 mm dish. After overnight incubation in a humidified incubator at 37°C supplied with 5% CO2, culture mediums were
replenished.
3.4.1.3. Subculturing of cells
The cells were passaged when they reached 80-90% confluence. The growth medium was aspirated and the cells were washed three times with 1x Phosphate buffer saline (PBS). Enough trypsin to cover the surface of the cells was added to the plate and waited 1-5 minutes until the cells are detached. The fresh medium was added and the suspension was pipetted gently to disperse the cells. The cells were transferred to either fresh petri dishes or fresh flasks using different dilutions (from 1:2 to 1:10) depending on requirements. All media and solutions used for culture were kept at 4°C (except stock solutions) and warmed to 37°C before use.
3.4.1.4. Cryopreservation of cell lines:
For cryopreservation cells should be in exponentially growing phase. 4x10⁶cells/ml concentration of cells could be freezed in 1 ml of freezing medium. Cells were trypsinized and neutralized with growth medium. The cells were counted and precipitated at 1500 rpm for 5 min. The pellet was suspended in a freezing medium. Freezing medium: 10% DMSO, 10% FCS and 80% growth medium.1 ml of this solution was placed into 1 ml screw cappedcryotubes. The tubes were placed to 20°C immediately, and kept 2 hours at this temperature. Then tubes were moved to -80 °C and kept overnight. The next day, the tubes were transferred into the liquid nitrogen storage tank.