Dergi web sayfası:
www.agri.ankara.edu.tr/dergi www.agri.ankara.edu.tr/journalJournal homepage:
TARIM BİLİMLERİ DERGİSİ
—
JOURNAL OF AGRICUL
TURAL SCIENCES
22 (2016) 275-294
Land Use/Cover Change from 2001 to 2010 and its Socioeconomic
Determinants in Guangdong Province, A Rapid Urbanization Area of
China
Lili LIa, Yunpeng WANGa
aGuangzhou Institute of Geochemistry, Chinese Academy of Science, Guangzhou 510640, CHINA
ARTICLE INFO
Research Article
Corresponding Author: Yunpeng WANG, E-mail: [email protected], Tel: +86 (020) 852 901 97 Received: 07 July 2014, Received in Revised Form: 07 January 2015, Accepted: 16 February 2015
ABSTRACT
Rapid economic and population growth exert profound effects on land use/cover change, especially in rapid economically developing areas, such as Guangdong Province-a pioneer of economic growth and urbanization in China. To elucidate the changes and mutual conversions of land-use types and their determinants in Guangdong Province, land-use maps of Guangdong Province from 2001 to 2010 were obtained from Moderate Resolution Imaging Spectroradiometer (MODIS) L1B images with 500 m resolution by using the supervised classification combined support vector machine (SVM) algorithm with a decision tree. The results indicate that during the studied time period, the area of urban land and orchards increased by 4186 km2 and 3615.5 km2, respectively, while the percentage of cropland decreased from 11.46%
to 10.14%. Massive urbanization and cropland loss have occurred in the region. The conversion from wasteland to urban land, and the mutual transformation between wasteland and cropland were the most prevalent in Guangdong Province. This was especially obvious from 2007 to 2010, with an annual changing rate of 5.13% and -19.33%, respectively. Several socio-economic factors were also obtained to investigate their impacts on land-use changes in Guangdong Province. It is shown that marked increases in gross domestic product (GDP), total investment in fixed assets, total retail sales of consumer goods, and the increasing development of modern service industries have led to large-scale migration, and industrial structure adjustment and improvement; consequently dramatically rapid expansion of cities and cropland loss have occurred.
Keywords: Land use/cover change; MODIS; Change detection; Urbanization; Economic development
Çin’in Hızlı Bir Ekonomik Gelişim Alanı Olan Guangdong’da Arazi
Kullanımı/Arazi Örtüsü Değişimleri ve Sosyo-Ekonomik Etkileri
ESER BİLGİSİAraştırma Makalesi
Sorumlu Yazar: Yunpeng WANG, E-posta: [email protected], Tel: +86 (020) 852 901 97 Geliş Tarihi: 07 Temmuz 2014, Düzeltmelerin Gelişi: 07 Ocak 2015, Kabul: 16 Şubat 2015
1. Introduction
Land use/cover change (LUCC) is regarded as a fundamental component of global environmental change because of its interactions with climates, ecosystems, biodiversity and human beings, and its crucial function in resource management and land planning (Meyer & Turner 1992; Bagarinao 2008; Sun et al 2012). Since the late 1980s, when remote sensing and GIS techonology were extensively applied to land research, the monitoring of regional land-use dynamic change has expanded globally, such as in the tropical rainforest areas of the Brazilian Amazon Basin (Skole & Tucker 1993), Africa (Tucker et al 1985), and South America (Townshend et al 1987). In 1995, the International Geoshpere Biosphere Programme (IGBP) and the International Human Dimensions Programme (IHDP) jointly developed a plan titled, “Land Use and Cover Change” (LUCC), which made land-use change an urgent international priority and focused on improving the ability to predict LUCC on different spatial scales (Thomson & Hardin 2000; Lo & Yang 2002; Gilani et al 2015). Masek et al (2000) utilized Landsat TM and MSS to detect urban growth in Washington D.C. based on a NDVI-differencing approach. Thenkabail et al (2005) mapped the irrigated areas in the Ganges and Indus River basins using near-continuous time-series, 500 m resolution
MODIS land data for 2001-2002. In addition, Kiage et al (2007) depicted the land degradation and land-use change in the Lake Baringo catchment by using the NDVI-differencing and post-classification comparison on TM classificaition results. Mertes et al (2014) also demonstrated a methodology for monitoring urban land expansion at continental to global scales through employing MODIS data.
A series of studies on LUCC at different spatial-temporal levels has also been conducted in China (Yu & Yang 2002; Liu et al 2003; Ye et al 2004; Wu et al 2006; Ding et al 2007; Chen et al 2011). For example, Wang et al (2001) applied mathematical methodology to study the spatial-temporal changes of land use and dynamic features in China. Okamoto et al (2005) classified the land cover in Heilongjiang Province, China by employing Landsat TM and ETM, and analyzed the conversions of paddy fields. Moreover, Xu et al (2007) described the development of the land-cover maps of the Yangtze River Delta. To accomplish this, they used 250 m MODIS data by utilizing DEM, EVI and reflectance data, and generating a compostitive classification matrix. Wang et al (2015) investigated the LUCC in the Kaidu-Kongqi River Basin during 1990-2010 based on the land-use classification data derived from Landsat images.
ÖZET
Çin’in ekonomik gelişim ve kentleşme bakımından öncü bölgelerinden Guangdong’da, ekonomik gelişim ve nüfus artışına bağlı olarak arazi kullanım/arazi örtüsü hızla değişmektedir. Bölgede alan kullanım tiplerini ve arazi değişimlerini tespit edebilmek için 500 metre çözünürlükte Orta Çözünürlüklü Spektroradyometre Görüntüleme Sistemi (MODIS) L1B görüntüleri üzerinden destek vektör makineleri (SVM) algoritması kullanılarak 2001-2010 yıllarına ait alan kullanım haritaları elde edilmiştir. Harita analizleri sonucunda 2001-2010 yılları arasında kentsel alanların 4186 km2 ve meyveliklerin 3615.5 km2 artış gösterdiği, tarım alanlarının % 11.46 oranından% 10.14’e gerilediği görülmüştür.
Bölgede hızlı kentleşmeye bağlı olarak tarım arazilerinin azaldığı belirlenmiştir. Boş arazilerin kentsel alana dönüşmesi yanında tarım alanları ile boş alanların yer değiştirmesi bölgede en çok görülen değişimlerdir. Bu değişimler özellikle 2007 ve 2010 yılları arasında % 5.13 ve % -19.33 değişim oranlarında görülmüştür. Bölgede alan kullanım değişimlerini etkileyen çeşitli sosyo-ekonomik faktörler belirlenmiştir. Gayrisafi yurtiçi hasıla ve sabit gelirin değişimi, perakende malların tüketimi ile çağdaş servis endüstrilerinin artışı ve yaygınlaşması sonucunda oluşan göçlerle endüstriyel yapı yaygınlaşmış; dolayısıyla kentler hızla büyüyerek tarım arazileri yok edilmiştir.
Anahtar Kelimeler: Arazi kullanımı/örtüsü değişimı: MODIS; Değişim belirleme; Kentleşme; Ekonomik gelişim © Ankara Üniversitesi Ziraat Fakültesi
Nature, population, economy, and policy are considered to be the typical driving forces of land use/cover changes (Lambin et al 2003; Siciliano 2012). Lambin et al (2001) concluded that people’s response to economic opportunities motivated land-cover changes, and global forces became the main determinant of LUCC. Yan et al (2006) studied the human dimensions affecting land-use change in one of China’s mega-urban regions and revealed that the population factor, economic development level, urbanization, and industrialization were the major factors influencing LUCC in the Pearl River Delta. Wang et al (2012) indicated that land-use changes in China, especially regarding cultivated and developed land, were closely related to economic fluctuations and the enaction and implementation of land policies. In China, especially since the reform and opening-up periods, the population explosion and rapid urbanization have brought about a sharp increase in the demand for natural resources and produced remarkable land use/cover changes (Zhou & Jiang 2000; Lin & Ho 2003; Lichtenberg & Ding 2008), significantly affecting the sustainable development of China’s economy, society, and ecology (Ge et al 2000; Liu et al 2010). Complex land-use structure and intensive utilization gradually created serious problems, such as land degradation and pollution, thus highlighting the necessity and significance of comprehensive study on LUCC and its determining factors (Shi et al 2000; Zhang et al 2008).
Guangdong Province, as China’s richest province, has witnessed rapid economic development, fast population growth, and consequently tremendous changes in land use. These dramatic changes became obvious beginning in China’s reform and opening-up periods, and have become especially pronounced in the past several years. Considering that many studies of LUCC have been conducted in the Pearl River Delta instead of Guangdong Province (Seto et al 2002; Weng 2002; Zhang et al 2007; Fan et al 2008; Dai et al 2010), this paper acquired the land-use maps of Guangdong Province from 2001 to 2010, a period when it experienced unprecedented development and expansion. The
current study investigated land-use change and mutual conversions using remote sensing and geographic information system techniques, and then analyzed the driving factors behind the changes.
2. Material and Methods
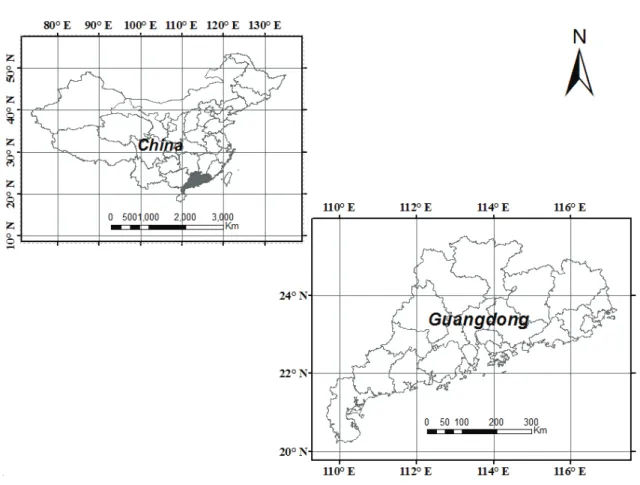
2.1. Study area and dataGuangdong Province lies between 109.5° and 117.3° E longitude and 20.2° and 25.5° N latitude, and borders Fujian Province to the northeast, Jiangxi and Hunan Provinces to the north, and Guangxi Autonomous Region to the west (Figure 1). It exhibits diverse and complicated landscape types, including mountains, hills, plateaus and plains, constituting 33.7%, 24.9%, 14.2% and 21.7% of the whole province area, respectively. It has a humid subtropical climate, in which winters are short, mild and relatively dry, while summers are long, hot, and very wet. The annual average temperature ranges between 19-24 oC, and the average yearly
precipitation is between 1300-2500 mm.
Guangdong Province has a total population of 85.21 million and covers an area of 179800 km2, accounting for only 1.87% of the entire
country’s land area. However, its gross domestic product (GDP) constitutes 11.17% of the country (Guangdong Statistical Bureau 2010) and it is known as the richest province in China. As the province’s economy has developed rapidly in recent years, marked and intense land-cover changes have occurred in the region, and are closely correlated with human activity, resulting in greatly increased environmental pollution and damage. Therefore, it is of critical importance to analyze LUCC of Guangdong Province in recent years and further identify its determinants.
At present, MODIS has become a widely-used moderate resolution remote-sensing data sources. The unique design of MODIS instrument provides data (12 bit) in 36 spectral bands ranging in wavelength from 0.4 μm to 14.4 μm, and at varying spatial resolutions (two bands at 250 m, five bands at 500 m, and the remaining 29 bands at 1 km).
In addition, its ±55-degree scanning pattern at the EOS orbit could provide global coverage every one to two days. The moderate spectral, spatial, and temporal resolutions make it easy to obtain cloud-free images and facilitate land use and land cover classification on a large scale. The data involved in this paper mainly include: 1) MODIS 500 m resolution satellite images (L1B) in the last months from 2001 to 2010 (at URL http://lpdaac.usgs.gov/ lpdaac/get_data), considering that the quality of images at that time is the best, and there is the least cloud coverage during that time of the year. The exact dates of the MODIS images used in the study
are: November 25, 2001; October 8, 2002; October 23, 2003; December 7, 2004; December 21, 2005; December 21, 2006; December 1, 2007; December 9, 2008; October 10, 2009; and November 1, 2010. 2) The Digital Elevation Model (DEM) with a spatial resolution of 90 m. The data set is provided by the NASA Shuttle Radar Topographic Mission (SRTM) and downloaded from the International Scientific and Technical Data Mirror Site, Computer Network Information Center, Chinese Academy of Sciences (http://www.gscloud.cn). 3) Vector data of Guangdong Province administrative division boundary. 4) Several socioeconomic indexes
Figure 1- Location and administrative boundary of Guangdong Province, China (109.5°-117.3° E, 20.2°- 25.5° N)
reflecting the development of the economy and population in Guangdong Province.
2.2. Methodology
The processing of remote-sensing images is the key to the entire study and the method, and thus the accuracy and the procedure may affect the final results greatly. Figure 2 is the entire image processing flow chart in this study.
in the last months from 2001 to 2010 (at URL http://lpdaac.usgs.gov/lpdaac/get_data), considering that the quality of images at that time is the best, and there is the least cloud coverage during that time of the year. The exact dates of the MODIS images used in the study are: November 25, 2001; October 8, 2002; October 23, 2003; December 7, 2004; December 21, 2005; December 21, 2006; December 1, 2007; December 9, 2008; October 10, 2009; and November 1, 2010. 2)The Digital Elevation Model (DEM) with a spatial resolution of 90 m. The data set is provided by the NASA Shuttle Radar Topographic Mission (SRTM) and downloaded from the International Scientific and Technical Data Mirror Site, Computer Network Information Center, Chinese Academy of Sciences (http://www.gscloud.cn). 3) Vector data of Guangdong Province administrative division boundary. 4) Several socioeconomic indexes reflecting the development of the economy and population in Guangdong Province.
2.2. Methodology
The processing of remote-sensing images is the key to the entire study and the method, and thus the accuracy and the procedure may affect the final results greatly. Figure 2 is the entire image processing flow chart in this study.
Figure 2- The image processing flow chart of remote-sensing images (including pre-processing and image interpretation).
Şekil 2- Uzaktan algılama görüntülerinin görüntü işleme akış diyagramı (ön değerlendirme ve yorumlama süreçleri dahil)
2.2.1. Pre-processing
MODIS LIB data reflect the calibrated and geo-located radiation values, and are saved as hierarchical data format (.HDF) through band hierarchical storage. Pre-processing tasks, such as reprojection and sub-setting, are crucial prerequisites for the study, and their accuracy has direct effects on classification and change detection.
Geo-referencing and Bow Tie Correction: The imaging characteristics of the MODIS detector result in geometric distortion of MODIS LIB images. This is especially the case between the scanning swathes
LUCC analysis based on maps for each year Supervised classification (SVM)
Image registration
Image 2
Study area extraction Geometric and Bow Tie Correction MOD02 L1B remote-sensing image 1
Training data selection Field survey Classification scheme
Decision tree classification Land-cover classification results
Figure 2- The image processing flow chart of remote-sensing images (including pre-processing and image interpretation)
Şekil 2- Uzaktan algılama görüntülerinin görüntü işleme akış diyagramı (ön değerlendirme ve yorumlama süreçleri dahil)
2.2.1. Pre-processing
MODIS LIB data reflect the calibrated and geo-located radiation values, and are saved as hierarchical data format (.HDF) through band hierarchical storage. Pre-processing tasks, such as reprojection and sub-setting, are crucial prerequisites for the study, and their accuracy has direct effects on classification and change detection.
Geo-referencing and Bow Tie Correction: The imaging characteristics of the MODIS detector result in geometric distortion of MODIS LIB images. This is especially the case between the scanning swathes where serious dislocation, i.e., bow tie, exists. Geometric and bow tie correction
are conducted through he MODIS processing module (Geo-reference MODIS) in ENVI software.
Image Registration: As MODIS images with the same coverage of each year are not identical and may have certain pixel offsets, we firstly subset the images with an area slightly bigger than Guangdong Province. Then, registration is performed to make all of the corresponding pixels locate in the same place by selecting over 50 control points, with a root mean square error (RMSE) below 0.5 pixels.
Image Sub-setting: Vector data of Guangdong Province boundary are needed to extract the study area from the corrected remote-sensing imagery.
2.2.2. Land-use classification scheme and approach
Before conducting Land-use classification, there are two aspects we should consider: 1) to develop a classification scheme suitable for the study area; and 2) to select an appropriate classification approach. Based on the prior knowledge of Guangdong Province obtained in recent years and a literature survey on previous research in this region, we developed a classification scheme comprising six classes, including water, wasteland, urban land, forest, orchards, and cropland. Moreover, wasteland includes waste grassland, saline-alkali land, sand, and undeveloped land.
The objective of image classification is to classify all of the pixels of the image into several categories or themes, and the cores of the classification algorithm are the discrimination function and the corresponding criterion. In this study, we firstly use a supervised classification with a support vector machine (SVM) algorithm (Burges 1998) to classify the MODIS image into water, vegetation, urban land, and wasteland with the aid of existing knowledge, experience and some auxiliary data, such as MODIS land use/cover products and Landsat TM images with higher spatial resolution. The auxiliary data in our study were used to help select regions of interest (ROIs) as training pixels for each class in the SVM and validate the classification results. TM images at similar times, covering parts
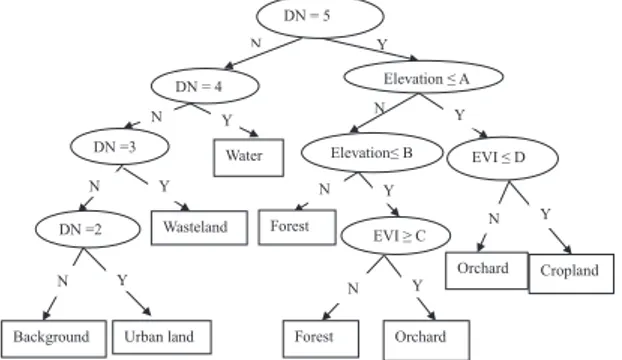
of Guangdong Province, were used because of their higher spatial resolution with 30 m, which provided clearer details of the objections. MODIS Land Cover Type Product supplies global maps of land cover at annual time steps. The primary results with IGBP global vegetation classification scheme identify 17 land-cover classes, and the overall accuracy of the product is about 75%. SVM is a classification system derived from statistical learning theory. Specifically, it separates the classes with a decision surface that maxmizes the margin between the classes. The surface is called the optimal hyperplane, and the data points closest to the hyperplane are support vectors. SVM classification output is the decision values of each pixel for each class, which are used for probability estimates, and then ENVI performs classification by selecting the highest probability. A decision tree (He 2007; Zhang et al 2008; Jia & Xu 2010) is then built by setting a series of thresholds to DEM data and Enhanced Vegetation Index (EVI) to further categorize vegetation into forest, orchard, and cropland (Figure 3). The decision tree performs multistage classifications by employing a series of binary decisions to place pixels into classes. Each decision divides the pixels in the images into two classes based on an expression, and the results of the decisions are classes. The rules of the decision tree include: 1) croplands are generally at low altitudes and have low Enhanced Vegetation Index (EVI); 2) orchards are at slightly higher altitudes and have much higher EVI values; and 3) forests are usually at the highest altitudes. Therefore, firstly a low value of elevation A is set to extract the cropland and orchards at low altitudes from the vegetation class, and then a threshold of EVI D is set to separate the cropland and orchards. For vegetation at altitudes greater than A, we further set a threshold for elevation B to extract the forests. For vegetation at altitudes between A and B, a value of EVI C is used to divide forests and orchards, since orchards have higher EVI values. Thresholds A, B, C and D vary in different years, and are defined according to existing knowledge, MODIS land use/ cover products, and Guangdong Province vegetation maps. The accuracy of classification was evaluated using the 30 m resolution TM images covering the
study areas. MODIS Land Cover Type products by the IGBP classification scheme were also utilized. Over 50 samples for each class were selected to calculate the kappa coefficient.
Figure 3- A decision tree developed for land-use classification in Guangdong Province (DN is the code of each type of initial classification result; A, B, C, and D are the thresholds of elevation and EVI for different years).
Şekil 3- Guangdong bölgesinde alan kullanım sınıflandırması için geliştirilen karar sıralaması (DN, sınıflandırma sonuçlarının kodlamasını ifade etmekte; A, B, C, ve D, farklı yıllara ait EVI ve yükseklik sınırlarını ifade etmektedir)
3. Results and Discussion
3.1. Land-use change detection from 2001 to 2010
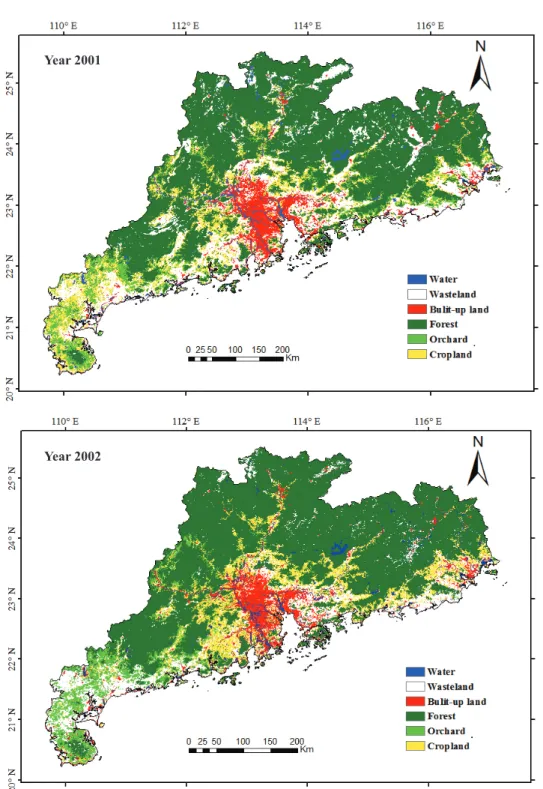
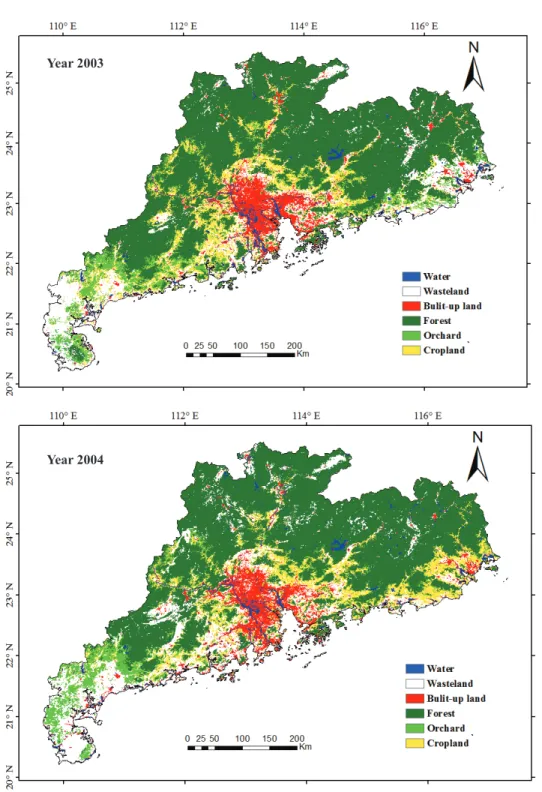
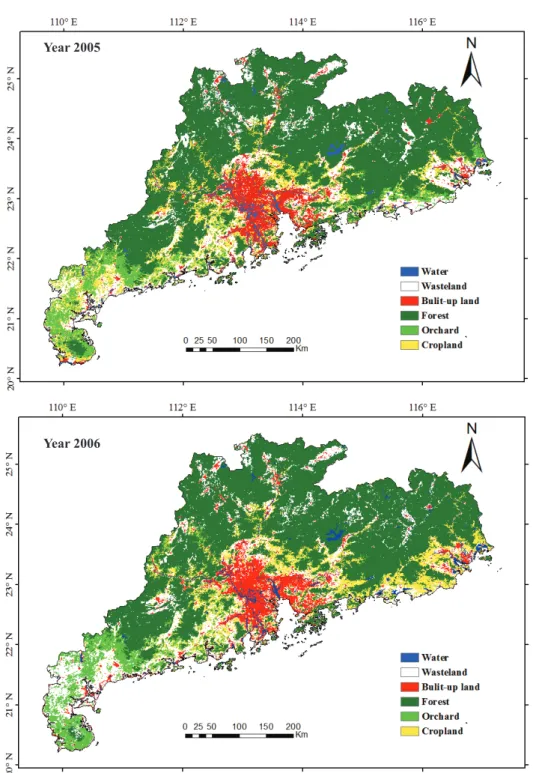
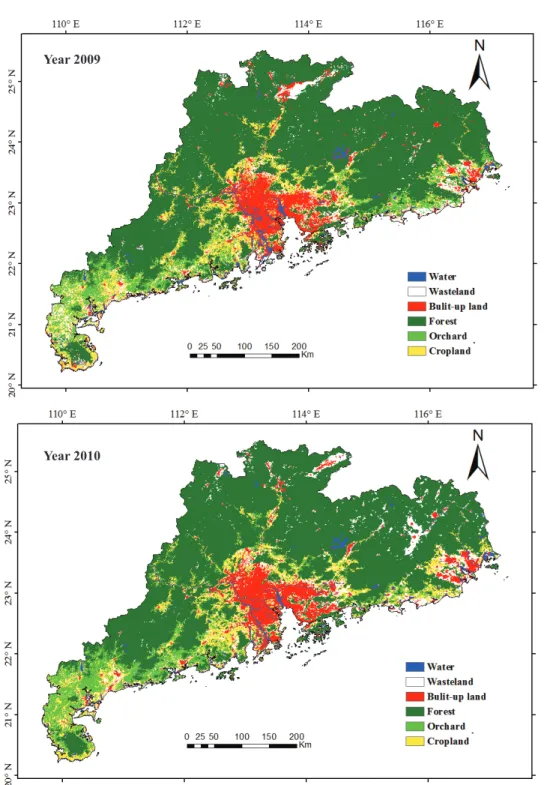
The land use maps of each year from 2001 to 2010 were obtained through various image processing techniques and combined classification techniques (Figure 4). The overall accuracy of the results in 2008 and 2010 were calculated as 80.4% and 81.2% with kappa coefficient of about 0.79 and 0.776, respectively. These are mainly limited by the low spatial resolution of MODIS images, since a single pixel covers about 0.25 km2 and there are many mixed pixels.
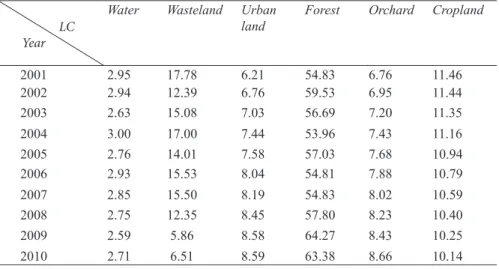
Table 1 shows that: the water area changed very little from 2001 to 2010; the area of wasteland shrank in a large amount and proportion due to its low transformation cost; urban land expanded dramatically as a result of economic growth and a great influx of population, so it is necessary to increase the built-up area to meet people’s living demands; the forest area first shows a decrease, and then an increase, which implies that both human demand for forest resources and control over ecosystems have been increasing with the rapid development of society; the percentage of orchards demonstrates a significant rise during the period, since they produce much higher income due to market mechanisms. Moreover, because of superior geographical condition, the area of cropland decreased from 11.46% to 10.14% gradually in those years, identifying a dramatic expansion of urban area and a major loss of cropland during the years, which are closely related to the rapid growth of the economy and population in the region. As data acquision for the selected MODIS images in 2002, 2003 and 2009 took place in October when the harvest is not yet completed, an obscure variation trend of wasteland and forest resulted.
N Y N Background Elevation≤ B N DN =2 Y EVI ≥ C DN =3 Orchard Cropland Forest Water Y Wasteland N Y EVI ≤ D Elevation ≤ A Orchard Forest DN = 4 Urban land N Y xxxviii. Y N Y Y N N DN = 5
Figure 3- A decision tree developed for land-use classification in Guangdong Province (DN is the code of each type of initial classification result; A, B, C, and D are the thresholds of elevation and EVI for different years)
Şekil 3- Guangdong bölgesinde alan kullanım sınıflandırması için geliştirilen karar sıralaması (DN, sınıflandırma sonuçlarının kodlamasını ifade etmekte; A, B, C, ve D, farklı yıllara ait EVI ve yükseklik sınırlarını ifade etmektedir)
3. Results and Discussion
3.1. Land-use change detection from 2001 to 2010
The land use maps of each year from 2001 to 2010 were obtained through various image processing techniques and combined classification techniques (Figure 4). The overall accuracy of the results in 2008 and 2010 were calculated as 80.4% and 81.2% with kappa coefficient of about 0.79 and 0.776, respectively. These are mainly limited by the low spatial resolution of MODIS images, since a single pixel covers about 0.25 km2 and there are many
mixed pixels.
Table 1 shows that the water area changed very little from 2001 to 2010; the area of wasteland shrank in a large amount and proportion due to its low transformation cost; urban land expanded dramatically as a result of economic growth and
a great influx of population, so it is necessary to increase the built-up area to meet people’s living demands; the forest area first shows a decrease, and then an increase, which implies that both human demand for forest resources and control over ecosystems have been increasing with the rapid development of society; the percentage of orchards demonstrates a significant rise during the period, since they produce much higher income due to market mechanisms. Moreover, because of superior geographical condition, the area of cropland decreased from 11.46% to 10.14% gradually in those years, identifying a dramatic expansion of urban area and a major loss of cropland during the years, which are closely related to the rapid growth of the economy and population in the region. As data acquision for the selected MODIS images in 2002, 2003 and 2009 took place in October when the harvest is not yet completed, an obscure variation trend of wasteland and forest resulted.
3.2. Analysis of the LUCC in Guangdong Province (2001-2010)
To perform further analysis, we selected the land-use maps of 2001, 2004, 2007, and 2010 to elucidate the mutual transformation of each land use/cover class. The change matrixes between each two years
are listed in Table 2, which reveals the unchanged area and the conversion area of land-cover type i in the initial stage to type j at the end of the period.
It can be concluded from the Table 2 that in the past 10 years, the conversion between land-cover types in Guangdong Province has been quite dramatic. Moreover, three major types of land-cover change can be identified: wasteland to urban land, wasteland to cropland, and cropland to orchards. The conversion from wasteland is the most notable, and the areas converted from wasteland to cropland account for 46.1%, 30.1% and 28.8% of the total changing area of wasteland in 2001-2004, 2004-2007 and 2004-2007-2010, respectively. Urban land witnessed a great rise by 4186.25 km2, exhibiting
first an increasing trend and then a slowing trend. The areas transformed to urban land from wasteland are 2759.5 km2, 2949.75 km2 and 2973 km2 during
each of the above periods, respectively. In addition, a large amount of cropland was converted to orchards for the purpose of obtaining additional profits owing to the subsequent processes of agricultural restructuring and land encroachment. The conversion patterns are presented in Figure 5. The conversions between land cover types during 2007-2010 were the most profound and complicated.
Table 1- Percentage (%) of each land cover class in Guangdong Province (2001-2010)
Çizelge 1- Guangdong bölgesinde herbir alan örtüsünün yüzdesi (%)
LC Year
Water Wasteland Urban
land Forest Orchard Cropland
2001 2.95 17.78 6.21 54.83 6.76 11.46 2002 2.94 12.39 6.76 59.53 6.95 11.44 2003 2.63 15.08 7.03 56.69 7.20 11.35 2004 3.00 17.00 7.44 53.96 7.43 11.16 2005 2.76 14.01 7.58 57.03 7.68 10.94 2006 2.93 15.53 8.04 54.81 7.88 10.79 2007 2.85 15.50 8.19 54.83 8.02 10.59 2008 2.75 12.35 8.45 57.80 8.23 10.40 2009 2.59 5.86 8.58 64.27 8.43 10.25 2010 2.71 6.51 8.59 63.38 8.66 10.14
Figure 4- Land-use maps of each year in Guangdong Province from 2001 to 2010
Şekil 4- Guangdong bölgesinde 2001’den 2010 yılına kadar her yıla ait alan kullanım haritaları
Year 2001
Figure 4- (Continued) Land-use maps of each year in Guangdong Province from 2001 to 2010
Şekil 4- (Devam) Guangdong bölgesinde 2001’den 2010 yılına kadar her yıla ait alan kullanım haritaları
Year 2003
Figure 4- (Continued) Land-use maps of each year in Guangdong Province from 2001 to 2010
Şekil 4- (Devam) Guangdong bölgesinde 2001’den 2010 yılına kadar her yıla ait alan kullanım haritaları
Year 2005
Figure 4- (Continued) Land-use maps of each year in Guangdong Province from 2001 to 2010
Şekil 4- (Devam) Guangdong bölgesinde 2001’den 2010 yılına kadar her yıla ait alan kullanım haritaları
Year 2007
Figure 4- (Continued) Land-use maps of each year in Guangdong Province from 2001 to 2010
Şekil 4- (Devam) Guangdong bölgesinde 2001’den 2010 yılına kadar her yıla ait alan kullanım haritaları
Year 2009
Table 2- Change matrixes of land-cover types during three different periods (km2)
Çizelge- 2- Üç farklı dönemde alan örtüsü tiplerinin değişim matrisleri (km2)
2001 2004
Water Wasteland Urban Forest Orchard Cropland Total
Water 2798 111.5 952.25 725.5 45 274.75 4907 Wasteland 395.75 20316.5 1050.75 2517.75 1388 4848 30516.75 Urban 1166.75 2759.5 8457.75 228.75 63.25 486.75 13162.75 Forest 308.5 2888 116.75 93076.25 319 403.25 97111.75 Orchard 15.5 513.25 3 2211 7456 3162 13360.75 Cropland 214.25 5354.75 426.25 0 2778.5 11232.75 20006.5 Total 4898.75 31943.5 11006.75 98759.25 12049.75 20407.5 179065.5 2004 2007
Water Wasteland Urban Forest Orchard Cropland Total
Water 2805.5 215.75 890.25 518.25 15.25 383.75 4828.75 Wasteland 117.5 19547.75 1263.75 3076.5 1514.25 2331.5 27851.25 Urban 1125.75 2949.75 9904.75 137.75 3.75 348 14469.75 Forest 604.5 2174.25 269.25 93154.75 2549 0 98751.75 Orchard 57.75 2325 97.25 224.5 8886.75 2712.75 14304 Cropland 196 3304.25 737.5 0 391.75 14230.5 18860 Total 4907 30516.75 13162.75 97111.75 13360.75 20006.5 179065.5 2007 2010
Water Wasteland Urban Forest Orchard Cropland Total
Water 2037 370 1335 199.75 35.25 378.25 4355.25 Wasteland 262.25 6428.25 1071 1662.25 150.25 2122.75 11696.75 Urban 1060 2973 10104.5 109.25 17 929.25 15193 Forest 874.25 6539 410 96780.5 6285.25 3071.25 113960.3 Orchard 18.75 5361.75 74.75 0 6274.5 3935.5 15665.25 Cropland 576.5 6179.25 1474.5 0 1541.75 8423 18195 Total 4828.75 27851.25 14469.75 98751.75 14304 18860 179065.5
Land Use/Cover Change from 2001 to 2010 and its Socioeconomic Determinants in Guangdong Province..., Li & Wang
Here, two dynamic index proposed by Wang & Bao (1999) are used to quantify the yearly changing rate of land use types. The single land-use dynamic index is calculated with Equation 1.
% 100 1 K 1 2 × − × − = t t U U U a a b (1)
Where; K is the dynamic degree of a land-use type in a certain period from t1 to t2; Ua represents the area of the type at the beginning of the period; and Ub is the area at the end of the period.
The comprehensive land-use dynamic index is used to describe the regional transforming rate of all land-use types during the study period, and quantitatively reflects the transformation rate and intensity of land use in the region. It can be expressed as Equation 2.
Figure 5- Land-use mutual conversion patterns during 2001-2004 (a), 2004-2007 (b), and 2007-2010 (c) Şekil 5- 2001-2004 (a), 2004-2007 (b), ve 2007-2010 (c) yıllarında alan kullanım değişimlerini gösteren dokular
Here, two dynamic index proposed by Wang & Bao (1999) are used to quantify the yearly changing rate of land use types. The single land-use dynamic index is calculated with Equation 1.
% 100 1 K 1 2 t t U U U a a b (1)
Where; K is the dynamic degree of a land-use type in a certain period from t1 to t2; Ua represents the
area of the type at the beginning of the period; and Ub is the area at the end of the period.
The comprehensive land-use dynamic index is used to describe the regional transforming rate of all land-use types during the study period, and quantitatively reflects the transformation rate and intensity of land use in the region. It can be expressed as Equation 2.
%
100
1
2
CR
1 2 1 1t
t
LU
LU
r i i r i i j (2)Where; CR is the value of comprehensive land-use dynamic degree; LUi is the area of land-use type i
at the beginning of the period; and ΔLUi-j is the conversion area from land-use type i to land-use type j.
The yearly changing rate and comprehensive land-use dynamic degrees during 2001-2004, 2004-2007, and 2007-2010 are obtained according to the above equations and are listed in Table 3. The results
(c)
(2)
Where; CR is the value of comprehensive land-use dynamic degree; LUi is the area of land-use type
i at the beginning of the period; and ΔLUi-j is the
conversion area from land-use type i to land-use type j.
The yearly changing rate and comprehensive land-use dynamic degrees during 2001-2004, 2004-2007, and 2007-2010 are obtained according to the above equations and are listed in Table 3. The results suggest that Guangdong Province has experienced striking and intense changes in land use, and the comprehensive land-use dynamic during 2001-2004, 2004-2007 and 2007-2010 was 3.32, 2.84 and 4.56, respectively. Wasteland shrank at an increasing rate, while the area of urban land witnessed a substantial expansion at a decreasing rate. The annual growth rate of orchards was rapid, while cropland suffered a moderate reduction from 2001 to 2010. It is inferred that agricultural restructuring, urbanization, and wasteland development are the direct causes of Guangdong Province’s fast
land-Figure 5- Land-use mutual conversion patterns during 2001-2004 (a), 2004-2007 (b), and 2007-2010 (c)
Şekil 5- 2001-2004 (a), 2004-2007 (b), ve 2007-2010 (c) yıllarında alan kullanım değişimlerini gösteren dokular
(a)
(b)
cover change. Cities and towns spread rapidly into the countryside, creating strong development pressures on surrounding farmland and open spaces.
3.3. Analysis of the driving forces in Guangdong Province (2001-2010)
To further identify the socio-economic determinants of LUCC in Guangdong Province, several typical socio-economic factors during four years were collected from Guangdong’s Statistical Bureau (Table 4).
Owing to the massive investment and rapid export growth made possible by the reform and opening-up policies, Guangdong Province’s economy developed rapidly in the 1980s and early 1990s. Until 2001, the economy was large and the growth rate was moderate during 2001-2004; from 2004 to 2010, the economy advanced at a stable and fast speed, which can be reflected from marked increases in GDP, total investment in fixed assets, and total retail sales of consumer goods. Increases in wealth and income promoted increasing demands
Table 3- Single and comprehensive dynamic degree of land use/cover classes (from 2001 to 2010)
Çizelge 3- Alan kullanımı ve arazi örtüsünün tekli ve karmaşık derecesi
Water Wasteland Urban Forests Orchards Cropland
Single dynamic degree (%)
(2001-2004) 0.056 -1.49 6.53 -0.56 3.63 -0.65 Comprehensive dynamic
degree (%) (2001-2004) 3.32 Single dynamic degree (%)
(2004-2007) -0.53 -2.91 3.31 0.56 2.35 -1.91 Comprehensive dynamic
degree (%) (2004-2007) 2.84 Single dynamic degree (%)
(2007-2010) -3.26 -19.33 1.67 5.13 3.17 -1.17 Comprehensive dynamic
degree (%) (2007-2010) 4.56
Table 4- Socio-economic indices in Guangdong Province
Çizelge 4- Guangdong bölgesinin sosyo-ekonomik indeksi
2001 2004 2007 2010
Gross Domestic Product
(100 million Yuan) 10647.71 16039.46 31084.4 46013.06 Primary Industry 1004.35 1245.42 1695.57 2286.98 Secondary Industry 5341.61 8890.29 15939.1 23014.53 Tertiary Industry 4301.75 5903.75 13449.73 20711.55 Population (10000 people) 7565.33 7804.75 8156.05 8521.55 Government Revenue (100 million Yuan) 1160.51 1418.51 2785.8 4517.04 Total Investment in Fixed Assets
(100 million Yuan) 3536.34 6025.53 9596.95 16113.19 Total Retail Sales of Consumer
Goods (100 million Yuan) 4515.28 6370.42 10598.14 17414.66 Gross Agricultural Output Value
(100 million Yuan) 1722.35 2154.79 2821.24 3754.86 Gross Industrial Output Value (100
for urban land, since people desire more comfortable houses, more convenient transportation, and more beautiful living environments. Moreover, the rapid expansion of urban land occurred mainly because the economic output of urban land is generally much more than that of agricultural land. Since the agricultural land and wasteland in the urban fringe have the potential to be transformed into urban land, the rate of land cover change increased accordingly.
Guangdong Province’s total investment in fixed assets soared to 16113.19 billion Yuan in 2010 from 3536.34 billion Yuan in 2001. The substantial increase in investment resulted in the rapid growth of infrastructure projects, simulated the low-density expansion of urban areas, and consequently the frequent conversion of wasteland and cropland into construction land.
The total retail sales of consumer goods in Guangdong Province has risen by over four times during the past 10 years, marking a great enhancement of buying power and demand for durable goods, including houses and cars. This consequently promoted the development of the
real estate, transportation, and service industries. Due to the above mentioned causes, along with the effects of developments in science and technology on economic development, Guangdong Province made significant progress in industrial structure adjustment and improvement. In fact, secondary and tertiary industries have increased at a fairly higher rate than primary industries, which led to a rising demand for labor, and consequently a large quantity of floating population. The population has been on the move, up to 852.15 million in 2010 from 756.53 million in 2001, and the population growth rate during 2001-2004, 2004-2007 and 2007-2010 was 3.16%, 4.5% and 4.48%, respectively. Furthermore, the population mainly gathered in urban centers and the outskirts surrounding them (mainly the Pearl River Delta), which is also a reason for urbanization and cropland loss.
To further confirm the influence of population and GDP on land-use change, we collected relevant data from 2001 to 2010. The change trend of GDP, and area of urban and cropland is shown in Figure 6. During the last 10 years, Guangdong
Figure 6- Change trend of GDP, and area of urban and croplands in Guangdong Province during 2001-2010
Şekil 6- Guangdong bölgesinde 2001-2010 yılları arasında GSYH ile kentsel ve tarım alanlarındaki değişim trendleri
Province has experienced a dramatic increase in GDP and corresponding gradual city expansion and cropland loss. Urbanization and economic growth are characterized by a close relationship and mutual promotion. Figure 7 indicates the correlation between population and area of urban and cropland, with the correlation coefficient of 0.923 and 0.987, respectively. In other words, the growing population has not only facilitated urbanization, but is also a major driving force behind reduction in farmland.
Figure 7- Correlation between population and area of urban (top) and cropland (bottom) in Guangdong Province during 2001-2010
Şekil 7- Guangdong bölgesinde 2001-2010 yılları arasında nüfus ile (üst) kentsel alan ve (alt) tarım alanları arasındaki korelasyon
4. Conclusions
Land use/cover change is recognized as an important factor in environmental change, especially in areas where enormous population and rapid economic growth exist. Our analysis indicates that in the last decade, Guangdong Province has witnessed dramatic land-use change, mainly manifested in urban land and cropland. The percentage of urban land and orchards increased by 2.38% and 1.9%, respectively; whereas, cropland shrank to 10.14% from 11.46%. This indicates that along with rapid economic development, massive urbanization (4186.25 km2) and cropland loss (2212.5 km2) have
taken place in the region; meanwhile, the utilization of wasteland has been greatly increased, as shown by a decrease of area from 20407.5 km2 to 18195
km2. To some degree, the shrinkage of cropland
and undeveloped land reflects an irreversible trend of growing industrialization, urbanization, and marketization. However, fertile cropland loss usually incurs substantial costs through diminishing the productivity of land and the capability of food grain production, as well as farmland diversity, which presents many challenges for farmers. Urban development could also cause environmental problems, such as air and water pollution, and an increase of carbon emissions.
The land-cover conversion mechanisms in Guangdong Province are mainly wasteland to urban land, and the mutual transformation between wasteland and cropland. The conversions from 2007 to 2010 were especially dramatic and complicated, which can also be inferred from the annual changing rate, with the most positive being 5.13%, the most negative -19.33%, and comprehensive land-use dynamic being 4.56%. The expansion rate of urban land and orchards was rapid, while wasteland and cropland suffered a sharp decline. The land-use changes could result in alterations in the physical and chemical soil parameters, thus giving rise to soil erosion, salinization, and desertification. Forestlands to built-up and wasteland conversions have been proven to produce an increase in soil erosion (Li et al 2014). Moreover, massive deforestation could change the atmospheric concentration of carbon
dioxide, i.e., the principal heat-trapping gas, and the local and regional climate by altering the vegetation cover on the surface. Therefore, there exists an urgent need for the government of Guangdong Province to plan and utilize the limited land resources more efficiently and effectively, and achieve a workable balance between the preservation of high-quality cropland and the need for urban growth.
The notable land-cover change in Guangdong Province is conclusively driven by its economic and population development. Marked increases in GDP (10647.71 billion Yuan to 46013.06 billion Yuan), total investment in fixed assets (3536.34 billion Yuan to 16113.19 billion Yuan), and total retail sales of consumer goods (4515.28 billion Yuan to 17414.66 billion Yuan) have led to fast expansion of cities and industrial structure adjustment and improvement. The rise of modern service industries has also created an opportunity for large-scale migration from rural to urban areas, together with rapid growth of the total population, thus accelerating the urbanization process and loss of farmland.
Acknowledgements
China National Key Technology R&D Program (2012BAH32B03), China National 863 Program (2006AA06A306) and Guangdong NSF (S2013010014097) are acknowledged for financial supports. We also thank the NASA Earth System for the MODIS products. Bernard de Jong of Utrecht University are thanked for comments and corrections. This is contribution No. SKLOG2013A01 from SKLOG and No. IS-2243 from GIGCAS.
References
Bagarinao R T (2008). Land use change and its implications on the environment and people’s health: The case of Mananga Watershed in Metro Cebu, Philippines. Asia Life Sciences 2: 65-76
Burges C J C (1998). A tutorial on support vector machines for pattern recognition. Data Mining and Knowledge
Discovery 2: 121-167
Chen G Y, Guo D Z, Wojtaszek M V & Márkus B (2011). Land use and land cover change based on remote
sensing and GIS in Changping, Beijing, China and Lake Velence Watershed, Hungary. Advanced
Material Research 403-408: 1543-1547
Dai J L, Wang K Y & Gao X L (2010). Spatial structure and land use control in extended metropolitan region of Zhujiang River Delta, China. Chinese Geographical
Science 20(4): 298-308
Ding H, Wang R C, Wu J P, Zhou B, Shi Z & Ding L X (2007). Quantifying land use change in Zhejiang Coastal region, China using multi-temporal landsat TM/ETM plus images. Pedosphere 17(6): 712-720 Fan F L, Wang Y P & Wang Z S (2008). Temporal and
spatial change detecting (1998-2003) and predicting of land use and land cover in Core corridor of Pearl River Delta (China) by using TM and ETM+ images.
Environmental Monitoring and Assessment 137(1-3):
127-147
Ge Q S, Zhao M C & Zheng J Y (2000). Land use change of China during the 20th century. Acta Geographica
Sinica 55(6): 706-716
Gilani H, Shrestha H L, Murthy M S R, Phuntso P, Pradhan S, Bajracharya B & Shrestha B (2015). Decadal land cover change dynamics in Bhutan. Journal of
Environmental Management 148: 91-100
Guangdong Statistical Bureau & Guangdong Survey Office of National Bureau of Statistics (2002, 2005, 2008, 2010). Guangdong Statistical Yearbook (2002, 2005, 2008, 2010). China Statistics Press, Beijing (in Chinese)
He B F, Fan W, Liu H M & Feng Y (2007). Study of land cover classification of Anhui province using MODIS data. Infrared Technology 29(11): 651-656
Jia W J & Xu F F (2010). Land use change research in Beijing city based on MODIS. Journal of Shandong
Jianzhu University 25(2): 151-153
Kiage L M, Liu K B, Walker N D, Lam N & Huh O K (2007). Recent land-cover/use change associated with land degradation in the Lake Baringo catchment, Kenya, East Africa: evidence from Landsat TM and ETM. International Journal of Remote Sensing
28(19): 4285-4309
Lambin E F, Turner B L, Geist H J, Agbola S B, Angelsen A, Bruce J W, Coomes O T, Dirzo R, Fischer G, Folke C, George P S, Homewood K, Imbernon J, Leemans R, Li X B, Moran E F, Mortimore M, Ramakrishnan P S, Richards J F, Skanes H, Steffen W, Stone G D, Svedin U, Veldkamp T A, Vogel C & Xu J C (2001). The causes of land-use and land-cover change:
moving beyond the myths. Global Environmental
Change-Human and Policy Dimensions 11(4):
261-269
Lambin E F, Geist H J & Lepers E (2003). Dynamics of land-use and land-cover change in tropical regions.
Annual Review of Environment and Resources 28(1):
205-241
Li L L, Wang Y P & Liu C (2014). Effects of land use changes on soil erosion in a fast developing area.
International Journal of Environmental Science & Technology 11: 1549-1562
Lichtenberg E & Ding C (2008). Assessing farmland protection policy in China. Land Use Policy 25(1): 59-68
Lin G & Ho S P (2003). China’s land resources and land-use change: insights from the 1996 land survey. Land
Use Policy 20(2): 87-107
Liu J Y, Liu M L, Zhuang D F, Zhang Z Z & Deng X Z (2003). Study on spatial pattern of land-use change in China during 1995-2000. Science in China Series D:
Earth Sciences 46(4): 373-384
Liu J Y, Zhang Z X, Xu X L, Kuang W H, Zhou W C, Zhang S W, Li R D, Yan C Z, Yu D S & Wu S X (2010). Spatial patterns and driving forces of land use change in China during the early 21st century. Journal
of Geographical Sciences 20(4): 483-494
Lo C P & Yang X J (2002). Drivers of land-use/land-cover changes and dynamic modeling for the Atlanta, Georgia Metropolitan Area. Photogrammetric
Engineering and Remote Sensing 68(10): 1073-1082
Masek J G, Lindsay F E & Goward S N (2000). Dynamics of urban growth in the Washington DC metropolitan area, 1973-1996, from Landsat observations.
International Journal of Remote Sensing 21(18):
3473-3486
Mertes C M, Schneider A, Sulla-Menashe D, Tatem A J & Tan B (2014). Detecting change in urban areas at continental scales with MODIS data. Remote Sensing
of Environment doi.org/10.1016/j.rse.2014.09.023
Meyer W B & Turner B L (1992). Human population growth and global land-use/cover change. Annual
Review of Ecology and Systematics 23: 39-61
Okamoto K, Shindo J & Kawashima H (2005). Analysis of rapid land-use/land-cover change in North-eastern China using Landsat TM/ETM+ data. Transactions
on Ecology and the Environment 81: 553-561
Seto K C, Woodcock C E, Song C, Huang X, Lu J & Kaufmann R K (2002). Monitoring land-use change in the Pearl River Delta using Landsat TM. International
Journal of Remote Sensing 23(10): 1985-2004
Shi P J, Gong P & Li X B (2000). 2. Science Press, Beijing (in Chinese)
Siciliano G (2012). Urbanization strategies, rural development and land use changes in China: A multiple-level integrated assessment. Land Use
Policy 29(1): 165-178
Skole D & Tucker C (1993). Tropical deforestation and habitat fragmentation in the Amazon: Satellite data from 1978 to 1988. Science 260(5116): 1905-1910 Sun X, He J, Shi Y Q, Zhu X D & Li Y F (2012).
Spatiotemporal change in land use patterns of coupled human-environment system with an integrated monitoring approach: A case study of Lianyungang, China. Ecological Complexity 12: 23-33
Thenkabail P S, Schull M & Turral H (2005). Ganges and Indus river basin land use/land cover (LULC) and irrigated area mapping using continuous streams of MODIS data. Remote Sensing of Environment 95(3): 317-341
Thomson C N & Hardin P (2000). Remote sensing/GIS integration to identify potential low-income housing sites. Cities 17(2): 97-109
Townshend J R G, Justice C O & Kalb V (1987). Characterization and classification of South American land cover types using satellite data. International
Journal of Remote Sensing 8(8): 1189-1207
Tucker C J, Townshend J R G & Goff T E (1985). African land-cover classification using satellite data. Science
227(4685): 369-375
Wang X L & Bao Y M (1999). Study on the mehods of land use dynamic change research. Progress In
Geography 18(1): 81-87
Wang S Y, Liu J Y, Zhang Z X, Zhou Q B & Zhao X L (2001). Analysis on spatial-temporal features of land use in China. Acta Geographica Sinica 56(6): 631-639
Wang J, Chen Y Q, Shao X M, Zhang Y Y & Cao Y G (2012). Land-use changes and policy dimension driving forces in China: Present, trend and future.
Land Use Policy 29(4): 737-749
Wang Y, Chen Y N, Ding J L & Fang G H (2015). Land-use conversion and its attribution in the
Kaidu-Kongqi River Basin, China. Quaternary International
380-381: 216-223
Weng Q H (2002). Land use change analysis in the Zhujiang Delta of China using satellite remote sensing, GIS and stochastic modelling. Journal of
Environmental Management 64(3): 273-284
Wu Q, Li H Q, Wang R S, Paulussen J, He Y, Wang M, Wang B H & Wang Z (2006). Monitoring and predicting land use change in Beijing using remote sensing and GIS. Landscape and Urban Planning
78(4): 322-333
Xu Y M, Liu Y H, Wei M & Lv J J (2007). Land cover classification of the Yangtze River Delta using MODIS data. Acta geographica sinica 62(6): 640-648 Yan X P, Mao J X & Pu J (2006). Research on the human
dimensions of land use changes in the mega-urban region: A case study of the Pearl River delta. Acta
Geographica Sinica 61(6): 613-623
Ye Q H, Liu G H, Tian G L, Chen S L, Huang C, Chen S P, Liu Q S, Chang J & Shi Y (2004). Geospatial-temporal analysis of land-use changes in the Yellow
River Delta during the last 40 years. Science in China
Series D-Earth Sciences 47(11): 1008-1024
Yu X X & Yang G S (2002). The advances and problems of land use and land cover change research in China.
Progress in Geography 21(1): 51-57
Zhang H H, Zeng Y N, Zou B, Xiao P F, Hu D Y & Peng J C (2007). Quantitative analysis and simulation of land use changes in the Pearl River Delta, China. Proc.
SPIE 6752, Geoinformatics 2007: Remotely Sensed Data and Information doi:10.1117/12.761303
Zhang X, Sun R, Zhang B & Tong Q (2008). Land cover classification of the North China Plain using MODIS_ EVI time series. ISPRS Journal of Photogrammetry
and Remote Sensing 63(4): 476-484
Zhang Y L, Nie Y & Lv X F (2008). Chinese literature analysis on land use research in China. Progress in
Geography 27(6): 1-11
Zhou W C & Jiang X B (2000). Construction of information system of policy-making supporting for sustainable development of land resources in Sichuan, Yunan, Guizhou and Chongqing in China. Journal of