WHY IS AGRICULTURAL EMPLOYMENT INCREASING
IN TURKEY?
BETAM WORKING PAPER SERIES #004
Why is Agricultural Employment Increasing in Turkey?
∗
Seyfettin G¨
ursel
†Z¨
umr¨
ut ˙Imamo˘
glu
‡April 4, 2013
Abstract
Using panel data across 26 regions, this paper investigates why the long-run trend of decreasing share of agricultural employment following the usual path of economic development in Turkey, has been reversed in the aftermath of the global crisis. Our results show that the decrease in non-agricultural wages during the crisis was not effective in increasing agricultural employment; however, changes in relative agricultural prices had a significant effect. Exploring further for other causes, such as changes in agricultural production structure, does not change the results.
Keywords: Agricultural employment, Economic development, Structural change
∗The authors are grateful to Fatih ¨Ozatay, S¸evket Pamuk, ˙Insan Tunalı, Refet G¨urkaynak, seminar
participants at the Istanbul Technical University, the 7th Employment Assessment Meetings at the Ministry of Development (Ankara, 2011), Turkey Labour Market Network Conference (Istanbul, 2011) and the 10th Annual International Meeting of the Middle East Economic Association (Barcelona, 2011) for their comments and suggestions. We thank Ay¸senur Acar for her excellent research assistance. We would also like to thank Tu˘gba Zeydanlı for her assistance during the early stages of the paper.
†Bah¸ce¸sehir University Center for Economic and Social Research (Betam), Istanbul, Turkey. e-mail:
‡Bahcesehir University Center for Economic and Social Research (Betam), Istanbul, Turkey. e-mail:
1
Introduction
Economic development in Turkey has decreased the share of agriculture in the economy as well as the share of agricultural employment over decades. Such structural change in agriculture is a common feature of the process of development in every economy around the world. Once the structural change begins there seems to be no turning back. As Alvarez-Cuadrado and Poschke (2011) state, increases in agricultural employment are extremely rare events. However, agricultural employment has been increasing in Turkey for four consecutive years since 2007. In this paper, we try to shed some light on the possible causes of the increase in agricultural employment by exploiting the regional variation in agricultural employment. There have been increases in the share of agricultural employment following the global crisis in various countries. A recent report by ILO (2012) (International Labor Office) states that the share of agricultural employment increased in Central and South-Eastern Europe (non-EU) and the CIS in the aftermath of the crisis, from 19.5 percent in 2008 to 20.6 percent in 2010.1 Agricultural employment in these countries have been declining for years as well
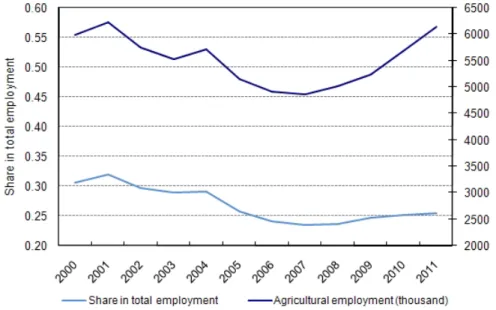
as in Turkey. Usage of modern agricultural methods and equipment led to improvements in labour productivity. The share of agricultural employment in Turkey went down from about 46% in 1990 to 23.5% in 2007 and the number of people employed decreased from about 9 million to 5 million. The declining trend in agricultural employment, however, has been reversed since 2007. The significance of the increase in agricultural employment in Turkey is that it was larger and has lasted for a more prolonged time than in other countries. Agricultural employment increased by 17 percent between 2007 and 2011, from 4.9 million to 6.1 million, and its share in total employment increased by 2.0 percentage points above its 2007 level to 25.5% (see Figure 1).
As ˙Ilkkaracan and Tunalı (2011) and C¸ akmak (2004) point, agriculture is still the major sector for employment in the rural areas in Turkey. Production is mainly carried out by small farms who are mostly employed in own account or unpaid family work. Agricultural labour force is poorly educated and labour productivity is low. Still, as a result of ongoing
1ILO, Global Employment Trends 2012. The country group includes Bosnia-Herzegovina, Serbia, Kosovo,
modernization in agriculture, agricultural employment was expected to continue its decrease over time. The large increase in agricultural employment in the recent years is, therefore, unexpected and puzzling and it raised many questions about the mechanism behind the transformation in the agricultural sector.
The adverse effect of the global crisis on the labour market in non-agricultural sectors in Turkey could be a potential explanation. A large body of studies in the literature start-ing with Lewis (1954) and Harris and Todaro (1970) state that improvements in the non-agricultural sectors attract (pull) labour through high wages. A reversal in the conditions in the non-agricultural sector might induce a “reverse migration” towards the agricultural sector. However, the reversibility and symmetry of this theory is doubtful, i.e. the idea that a large enough decrease in the non-agricultural income during the crisis might have caused the labour flow into agriculture.2 In fact, the increase in agricultural employment in Turkey continued even as the economy was recovering strongly in the aftermat of the crisis, in 2010 and 2011. Therefore, the global crisis alone is probably not enough to explain the whole story.
Another potential explanation could be the increase in world food prices. There was a surge in agricultural prices in the world starting a few years before the crisis (See Figure 3). Basic grain prices such as wheat, rice and corn were increasing rapidly, as well as others. Agricultural employment started increasing in Turkey as agricultural prices followed the world trend and increased relative to the price of industrial goods. Figure 4 shows that the relative price of agricultural goods have increased by about 25% between 2008 and 2011. The question we raise in this paper is, whether changes in agricultural prices, dominated by world price changes, affect employment in the agricultural sector via increases in agricultural income as an implicit consequence of rising prices.
Using panel data covering agricultural prices and employment between 2004 and 2011 for 26 regions in Turkey, we study the effects of the increase in agricultural prices and the decrease in non-agricultural wages on agricultural employment.3 We use a model
specifica-2Weiss (1997) provides evidence that a decrease in non-agricultural wages does not necessarily cause the
employees to drop out of the the non-agricultural labour force.
tion following Matsuyama (1992) and Alvarez-Cuadrado and Poschke (2011) that features a labour pull – labour push mechanism. Our paper is related to the literature on sectoral labour migration, in particular to Lewis (1954) and Harris and Todaro (1970), Hansen and Prescott (2002) as well as Nurske (1954), Gollin et al. (2007) and Ngai and Pissarides (2007). Our work also builds on G¨ursel et al. (2010a,b) by using agricultural price and employment data in an extended panel data set.
The remainder of this paper is organized as follows. Section 2 explains the model and its implications about the relationship between agricultural employment, wages and relative prices. Section 3 describes the data used and how we construct the regional price indicators in detail. Section 4 shows the main regression results and discusses alternative specifications. Section 5 explores the effects of changes in regional structure of agricultural production and exports. Section 6 shows the effects of changes in non-agricultural unemployment and Section 7 concludes.
2
The Model
Our model economy is similar to that in Matsuyama (1992). It consists of two sectors, one that produces agricultural output and one that produces non-agricultural goods. Labour is the only factor of production and production technology in both sectors have diminishing returns. Labour is freely mobile between the two sectors. Production technologies in the two sectors are given by
YtA = zAt FA(ltA) (1)
YtM = zMt FM(ltM). (2)
where agricultural and non-agricultural sectors are denoted by A and M , respectively, and Y denotes output, z denotes productivity and l denotes labour. Labour force is assumed to be normalized to 1, hence lM
t + ltA= 1. Production technologies in both sectors have decreasing proxy.
returns in labour such that FA0 > 0, FA00 < 0 and FM0 > 0, FM00 < 0. Profit maximization of firms imply equality between wages and marginal product of labor in each sector, measured in terms of each sector’s output,
wtA = zAt FA0(ltA) (3) wtM = zMt FM0 (1 − lAt ). (4)
Since labour is assumed to be mobile between the two sectors, real wages earned in the two sectors have to be equal in equilibrium at any point in time, wMt = ptwtA, where pt is the
price of agricultural goods relative to non-agricultural goods.4 Using wage equations from
profit maximization, we can rewrite the labour mobility condition as FM0 (1 − lA t) FA0(lA t ) = pt zA t zM t . (5)
Log-linearising and relabelling the left hand side function as G(lAt), we can rewrite equation (5) as follows,
log(G(lAt )) = log(pt) + log(
zA t
zM t
) (6)
Given the decreasing returns assumption on production technologies, the function G is in-creasing in the labour employed in agriculture, lA
t. In a small-open economy, where the
relative price of agricultural products are determined exogenously in the world market, em-ployment in the two sectors are determined by the relationship presented in equation 6. An exogenous increase in the price of agricultural products that causes an increase in the relative price would increase the share of labour in agriculture in a small-open economy be-cause it would increase the income earned in agriculture and labour would move from the non-agricultural sector into the agricultural sector until equilibrium is restored.
A decrease in productivity in the non-agricultural sector would cause a similar move. Given the relative price in the world market, a decrease in zM would decrease the marginal
productivity of labour in the non-agricultural sector and decrease the real wage. Labour
4It suffices that the wages are equal up to a constant such as the cost of living in an urban area relative
would move from the non-agricultural sector to the agricultural sector, again until the equi-librium is restored. The mechanism here is similar to that of Harris and Todaro (1970) where the increases in non-agricultural productivity increases the real wage in the non-agricultural sector and pulls labour out of agriculture.
A key assumption in the model is that the economy is open and agricultural prices are exogenously determined in the world market. In recent years, global food prices has been increasing and acting as an external shock for many small-open economies. Although Turkey is not a big importer of agricultural products, agricultural prices move in line with the global food prices. Figure 3 shows the changes in the World Food Price Index and the PPI for agricultural products in Turkey. The two lines follow a similar trend and are highly correlated.5 Both peak before the global crisis in 2008 and then rapidly increase
following the crisis. The same is true for the price of agricultural goods relative to the price of manufacturing goods. Figure 4 shows the change in the relative price of agricultural products from 2003 to 2011 in Turkey. Notice that before the crisis in 2008, the relative price peaks and after the crisis it rapidly increases to levels higher than that of the whole period. The increase from the end of 2008 until end of 2010 is about 20%. Agricultural prices during the same period increased by about 30%. It is clear that the increase in the relative price was driven mainly by the increase in agricultural prices, which followed the world trend. Relative price drops in 2011 but increases back up towards the end of the year. Turkey imports only about 12% of its grains and 8% of its fruits. Tariffs on agricultural products are high and agricultural production is highly protected. However, a closed economy approach would not be realistic for modelling pricing behaviour in agriculture in Turkey, given the high correlation between domestic prices and world prices. Besides, having constant rates of tariff protection does not prevent world price changes from affecting prices in Turkey. Therefore, we believe that a small open economy assumption is more suitable for our model. An increase in agricultural income would attract labour in to the agricultural sector. This implication is not specific to our model. Harris and Todaro (1970) and Alvarez-Cuadrado and Poschke (2011) also state that an increase in agricultural income could trigger a reverse
migration into agriculture.6 Matsuyama (1992) discusses in detail implications of a similar
model for open and closed economy cases.
In this paper, we test the two important implications of our model that i) an exogenous increase in agricultural prices would affect agricultural employment positively and ii) a crisis that causes a deterioration in productivity in the non-agricultural sector decreases wages and hence has adverse effects on agricultural employment. In order to do that, we exploit the regional variation in agricultural prices and employment in Turkey. Due to different climates in different parts of Turkey, the variety of agricultural produce change significantly across regions. That allows us to study the regions as independent areas and quantify to what extent changes in agricultural prices and non-agricultural wages affect changes in agricultural employment. We use a panel data set across 26 regions on regional employment, wages and agricultural prices. Next section describes the data in detail.
3
Data
We use two different sets of data, one on agricultural prices and production, the other one on employment and wages. On agricultural prices we use the survey data released by the TurkStat called Prices Received by Farmers (PRF). For agricultural production we use the Crop Production Statistics collected by the Ministry of Agricultural and Rural Affairs and released by the Turkstat. On employment and wages we use the Household Labour Force Survey, which is also released by the Turkstat. Our sample consists of 26 regions in Turkey over 6 years, between 2004 and 2011.
6“On the other hand, an increase in agricultural income will induce reverse migration with no diminution
3.1
Agricultural employment by employment status, gender and
age
Agricultural employment has been decreasing in Turkey since the 1990s. The share of agri-cultural employment went down from about 46% in 1990 to 23.5% in 2007 and the number of people employed decreased from about 9 million to 5 million. However, since 2007 the trend has been reversed. Between 2007 and 2011, the number of employed in agriculture increased by 1,267 (thousand). The increase between 2009 and 2011, the high growth period in Turkey, was 889 (thousand) which accounts for about 70 percent of the total increase.
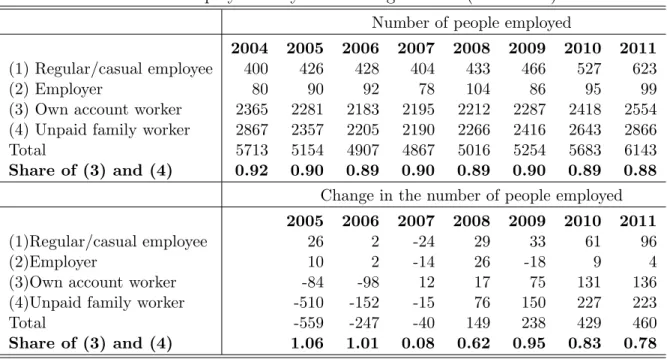
Agriculture in Turkey is still dominated by small family farms. Table 3.1 shows em-ployment in the agriculture by status for 2004-2011. About 90 percent of the employed in agriculture consist of own account workers and unpaid family workers. Most of the change in agricultural employment in 2010 and 2011, approximately 80 percent, comes from increase in the number of workers in these groups. Compared to previous years, acceleration in the number of wage earners in agriculture during these two years are noticeable, although overall wage employment still remains small.
Table 1: Employment by status in agriculture (thousands)
Number of people employed
2004 2005 2006 2007 2008 2009 2010 2011 (1) Regular/casual employee 400 426 428 404 433 466 527 623
(2) Employer 80 90 92 78 104 86 95 99
(3) Own account worker 2365 2281 2183 2195 2212 2287 2418 2554 (4) Unpaid family worker 2867 2357 2205 2190 2266 2416 2643 2866
Total 5713 5154 4907 4867 5016 5254 5683 6143
Share of (3) and (4) 0.92 0.90 0.89 0.90 0.89 0.90 0.89 0.88 Change in the number of people employed 2005 2006 2007 2008 2009 2010 2011
(1)Regular/casual employee 26 2 -24 29 33 61 96
(2)Employer 10 2 -14 26 -18 9 4
(3)Own account worker -84 -98 12 17 75 131 136
(4)Unpaid family worker -510 -152 -15 76 150 227 223
Total -559 -247 -40 149 238 429 460
Share of (3) and (4) 1.06 1.01 0.08 0.62 0.95 0.83 0.78
Classifying by gender reveals, not surprisingly, that most of the unpaid family workers are women and own account workers are pre-dominantly men. Table 3.1 shows agricultural employment by status and gender. Most of the increase in agricultural employment in 2008 and 2009 was due to increases in the number of men while the increase in 2010 was due to increase in the number of women. The increase in 2011 was more balanced between genders. The decreases in years 2005 to 2007 are, on the other hand, mostly due to decreases in male employment. Year 2005 shows the typical trend of men moving out of agriculture and leaving the farm business to females. Both the own account worker (mostly old) and unpaid family worker (mostly young) men leave agriculture while number of own account worker women increase. In total, more men leave compared to women. This trend continues until 2007 when agricultural employment starts to increase.
Figure 2 shows how the age composition of male and female workers changed over time in agricultural employment. From 2004 to 2007, young workers were leaving the agricultural sector. The decrease in agricultural employment during these years was mostly due to decreases in the younger generation (age below 40) for both genders, but more strongly for males. Starting from 2008 and onwards though, we observe an increase in the number of young in agriculture, but quite small. On the other hand, there are large increases in the number of mid-aged workers, age 40-60 for men and age 30-60 for women. It seems that the increase in agricultural employment was caused by (i) the stop in the flow of young workers from agricultural sector to non-agricultural sector and (ii) come back by some middle-aged men and women.
3.2
Agricultural employment by region
Looking at the data at the regional level, we see large deviations in agricultural employment both across regions and time. The Household Labour Force Survey (HLFS) reports agricul-tural employment at the NUTS2 level for 26 regions in Turkey since 2004. Therefore, in our analysis we are restricted to using data from year 2004 until 2011. As Figure 1 shows, during these years share of agricultural employment followed a U-shape. Between 2004 and 2007 agricultural employment overall decreased by 15 percent (5 percent per year on average) and
Table 2: Agricultural employment by status and gender
Number of people employed
Male 2004 2005 2006 2007 2008 2009 2010 2011
Regular/casual employee 265 271 272 256 264 292 308 385
Employer 74 82 82 69 90 79 85 92
Own account worker 2028 1836 1749 1761 1812 1879 1993 2120
Unpaid family worker 782 598 509 493 496 558 573 602
Total 3148 2787 2613 2578 2663 2808 2959 3199
Female
Regular/casual employee 137 155 155 146 169 174 219 238
Employer 6 8 10 9 14 7 10 8
Own account worker 337 445 434 435 400 408 426 434
Unpaid family worker 2086 1759 1695 1697 1770 1858 2070 2265
Total 2565 2367 2295 2288 2354 2446 2724 2944
Male/Female ratio (total) 1.23 1.18 1.14 1.13 1.13 1.15 1.09 1.09 Change in the number of people employed
Male 2005 2006 2007 2008 2009 2010 2011
Regular/casual employee 6 1 -16 8 28 16 77
Employer 8 0 -13 21 -11 6 7
Own account worker -192 -87 12 51 67 114 127
Unpaid family worker -184 -89 -16 3 62 15 29
Total -361 -174 -35 85 145 151 240
Female
Regular/casual employee 18 0 -9 23 5 45 19
Employer 2 2 -1 5 -7 3 -2
Own account worker 108 -11 1 -35 8 18 8
Unpaid family worker -327 -64 2 73 88 212 195
Total -198 -72 -7 66 92 278 220
Male/Female ratio (total) 1.82 2.42 5.00 1.29 1.58 0.54 1.09
Source: Turkstat, Household Labour Force Survey.
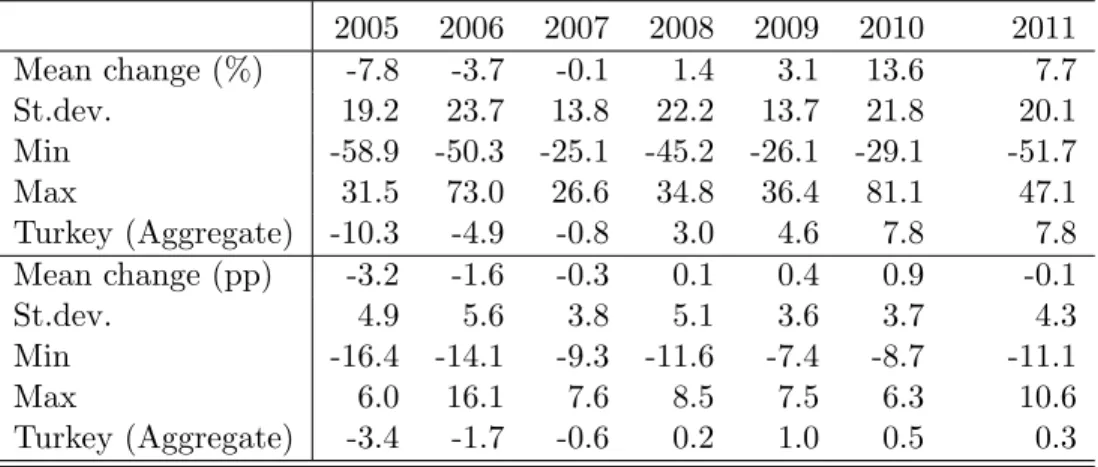
its share in employment fell by 5.6 percentage points. Agricultural employment increased by 26 percent between 2007 and 2011 (7 percent per year on average) and its share in total employment increased by 2.0 percentage points. On a regional basis, the changes were not all in line with this trend. Table 3 shows the average change in agricultural employment and its share in total employment across 26 regions. There is substantial variance across regions, standard deviations are high both for the change in levels and shares. And the average change in employment varies from -8 to 14 percent over the years. The minimum and max-imum values show that in each year some regions had substantial increases in agricultural
employment while others had substantial decreases.
Table 3: Average change in agricultural employment, level and share
2005 2006 2007 2008 2009 2010 2011 Mean change (%) -7.8 -3.7 -0.1 1.4 3.1 13.6 7.7 St.dev. 19.2 23.7 13.8 22.2 13.7 21.8 20.1 Min -58.9 -50.3 -25.1 -45.2 -26.1 -29.1 -51.7 Max 31.5 73.0 26.6 34.8 36.4 81.1 47.1 Turkey (Aggregate) -10.3 -4.9 -0.8 3.0 4.6 7.8 7.8 Mean change (pp) -3.2 -1.6 -0.3 0.1 0.4 0.9 -0.1 St.dev. 4.9 5.6 3.8 5.1 3.6 3.7 4.3 Min -16.4 -14.1 -9.3 -11.6 -7.4 -8.7 -11.1 Max 6.0 16.1 7.6 8.5 7.5 6.3 10.6 Turkey (Aggregate) -3.4 -1.7 -0.6 0.2 1.0 0.5 0.3
Source: TurkStat, Household Labour Force Survey
Notes: Top panel shows the statistics for the change in the level of agricultural employment from the previous year and the bottom panel shows them for the change in the share of agricultural employment in total employment. All changes in levels are differences in log values and changes in shares are differences in percentage points.
Figure 5 plots the changes in agricultural employment for each region. For about half of the regions the average change in agricultural employment is below zero. For other regions the average change is positive except a few for which it is close to zero. The variation in the change in agricultural employment over years 2004-2011 is substantial for almost all regions. The smallest variation is observed in region 19 (TR90 Trabzon, Ordu, Giresun, Rize, Artvin, G¨um¨u¸shane) followed by region 8 (TR42 Kocaeli, Sakarya, D¨uzce, Bolu, Yalova); these are two relatively large areas in terms of agricultural employment. The largest variation is observed in region 26 (TRC3 Mardin, Batman, S¸ırnak, Siirt), a relatively small area in terms of agricultural employment.
Figure 6 plots the changes in agricultural employment in each year. During the first two years the average change in agricultural employment is negative, but at a decreasing rate. In 2007, the average change is almost zero, and from 2008 till 2011, it is positive. The pace of increase in agricultural employment is increasing over last three years and it’s especially high in 2010, a year in which the Turkish economy, recovering from the crisis, grew by 9% followed by an 8.4% growth in 2011. It is surprising that the share in agriculture is increasing, not only during the crisis, but also during years of high growth, which leads us to believe that something different than the employment opportunities in the non-agricultural sector must
be driving the increase in agricultural employment. The variation of change across regions is the smallest in year 2007, the year agricultural employment stalled, but considerably large in other years.
There are two outliers, two data points at which the increase in agricultural employment was greater than 50%. These points belong to two different regions in two different years as can be seen in Figures 5 and 6. Excluding these regions from the regression improves standard errors but does not change the significance of the independent variables; therefore, we keep them in the regressions in order not to reduce the number of observations.
The increase in agricultural employment does not necessarily imply a transition from non-agricultural employment to non-agricultural employment. A decrease in the rate at which labour leave (or do not join) the agricultural labour force and join the non-agricultural labour force might have caused the observed increase in the share of agricultural employment. In Turkey, young population who grow up in rural areas have to make a choice between staying with their families to work in the farm or go out looking for a job in the non-agricultural sector.7 Since the unemployment rate in the agriculture is close to zero as agricultural production is mostly concentrated in family farms, an increase in the agricultural labour force increases the agricultural employment almost one to one. On the other hand, part of the transition might have come from transitions from the non-agricultural labour force into agriculture.
3.3
Agricultural Prices and Production
We compute the change in the price level in a region as the sum of the change in agricul-tural product prices weighted by their share of production in each region. The change in agricultural price in year t in region n is denoted by ∆ptn and given by
∆ptn =
X
i
ωin∆pti (7)
7Population continues to still grow in Turkey albeit at a decreasing rate; the current rate is 1,3 percent
where ωinis the share of product i in total agricultural production in region n, averaged over
the whole sample period and ∆pti is the change in price of agricultural product i at time
t. Overall, we have regional production data on 172 agricultural products in Turkey. The price data comes from a different data set and covers only 155 of these products.8 We do
not have data on regional agricultural prices. The price data available is the average prices of agricultural products in Turkey. The change in agricultural prices we compute is different for each region only because different products are produced in each region. For example, if only the price of hazelnuts go up in a given year, we would see an increase in our measure only in regions where hazelnuts grow and no change in others.
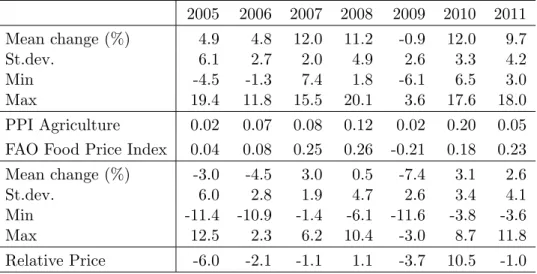
Table 4 shows the average annual agricultural price changes between 2004 and 2011. The table includes both the nominal changes and the changes in price adjusted for regional CPI inflation.9 The simple average of regional price changes follow the trend in the Producer Price Index (PPI) for the agricultural sector as well as the trend in global food prices given by the Food Price Index.10 Price changes vary substantially across regions both in nominal and relative terms; the standard deviation in each year varies from 2 to 6 percent.
Food prices in the world, as shown by the FAO Food Price Index have been increasing at low rates, lower than 10 percent, in 2005 and 2006. After 2007 agricultural price increases gain pace, increasing 25 percent and continued to do so in 2008. With the global recession, food prices around the world dropped, but they started increasing again in 2010 as the world economy started its recovery. Table 4 shows that the regional agricultural prices in Turkey follows the same trend. Average change in regional prices gains pace in 2007, increasing up to 12 percent, more than twice the change in previous years. There is a small decline in 2009, during the crisis, followed by a 12 percent increase again in 2010, as Turkey comes out of the recession. The relative agricultural price follows a similar trend; it increases until 2009 but recovers during of 2010 but decreases again in 2011. Overall the relative agricultural price decreases by 8.9 percent from 2004 to 2007 and increases by 6.4 percent from 2007 to 2011.
8Price data is not available on products used for feeding animals such as fig, ucgul, korunga, etc. 9Although the model we use is based agricultural prices relative to manufacturing prices, there are no
PPI index available at the regional level, therefore we use the regional CPI index.
10The Food Price Index is constructed by the Food and Agricultural Organization of the United Nations
Table 4: Average change in regional prices and the PPI for agricultural products, nominal and adjusted for regional CPI inflation
2005 2006 2007 2008 2009 2010 2011 Mean change (%) 4.9 4.8 12.0 11.2 -0.9 12.0 9.7 St.dev. 6.1 2.7 2.0 4.9 2.6 3.3 4.2 Min -4.5 -1.3 7.4 1.8 -6.1 6.5 3.0 Max 19.4 11.8 15.5 20.1 3.6 17.6 18.0 PPI Agriculture 0.02 0.07 0.08 0.12 0.02 0.20 0.05 FAO Food Price Index 0.04 0.08 0.25 0.26 -0.21 0.18 0.23 Mean change (%) -3.0 -4.5 3.0 0.5 -7.4 3.1 2.6
St.dev. 6.0 2.8 1.9 4.7 2.6 3.4 4.1
Min -11.4 -10.9 -1.4 -6.1 -11.6 -3.8 -3.6
Max 12.5 2.3 6.2 10.4 -3.0 8.7 11.8
Relative Price -6.0 -2.1 -1.1 1.1 -3.7 10.5 -1.0
Source: TurkStat, Food & Agricultural Organization of the United Nations (FAO) and authors’ calculations. Notes: Changes in prices are log differences from the previous year. Top panel shows nominal changes. Bottom panel shows changes adjusted for regional CPI inflation. Relative price refers to the changes in PPI in agriculture relative to CPI at the national level.
3.4
Non-agricultural income
Data we use comes from the Household Labour Force Survey (HLFS) of Turkey. The HLFS has data on wage earnings of the employed on a regional basis since year 2004. Unfortunately, the survey does not contain any information on the earnings of neither the self-employed nor the employers. That allows us to use only the wage earnings in our regressions, but wage earners constitute a large share of the employed in the non-agricultural sector, about 71%.
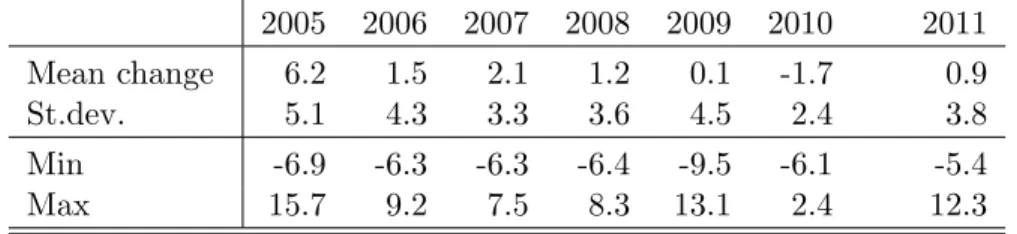
We want to consider the changes in wages that are ‘relevant’ to workers who make a decision on whether to work in the agricultural sector or in the non-agricultural sector. A natural way of doing this is to consider workers that have similar skill sets in both sectors. About 81% of the employed in the agricultural sector in Turkey has less than 8 years of schooling. Therefore, among the wage earners in the non-agricultural sector, we filter out those who have more than 8 years of schooling while computing the changes in wage earnings. Table 5 shows the changes in regional wages earned in the non-agricultural sector for workers who have less than 8 years of schooling, over years 2004-2011 after adjusting for
Table 5: Average change in non-agricultural wages 2005 2006 2007 2008 2009 2010 2011 Mean change 6.2 1.5 2.1 1.2 0.1 -1.7 0.9 St.dev. 5.1 4.3 3.3 3.6 4.5 2.4 3.8 Min -6.9 -6.3 -6.3 -6.4 -9.5 -6.1 -5.4 Max 15.7 9.2 7.5 8.3 13.1 2.4 12.3
Source: TurkStat, Household Labor Force Survey
Notes: All changes are differences in log values from the previous year. Wages are calculated for the employed in the non-agricultural sector that has less than 8 years of schooling, adjusted for regional CPI inflation.
regional CPI inflation. The variation in the change in wages (the standard deviation) is between 2 to 5 percent. In 2009, the year of crisis the increase in real wages come to a halt and in 2010, the change in wages is negative, on average, across regions although this was the year of strong economic growth. The stagnation or decrease in wages during these years might have encouraged workers to remain in the agricultural sector. In 2011, real wages started to increase again as non-agricultural sector continued to grow fast.
4
The relationship between agricultural prices and
agri-cultural employment
In order to analyse the relationship between agricultural prices and agricultural employ-ment we regress the change in agricultural employemploy-ment in each region on the change in agricultural price and non-agricultural income in that region after adjusting for regional CPI inflation. Theory implies that changes in agricultural employment are positively related with agricultural prices and a negatively related with non-agricultural income. Table 6 presents regression results for different model specifications. The first column shows the estimations under pooled OLS that includes time dummies. The second column shows the results for fixed effect model including time dummies. We report robust standard errors. Under both specifications the coefficient on the price is positive and strongly significant. Including time dummies in regressions picks up the effect of the global recession. Including region fixed intercepts does not change neither the magnitude nor the significance of the coefficients. In fact, since we are using log differences for both dependent and independent variables, time
invariable regional fixed effects are already removed and hence are insignificant.
Regarding the effect of changes in non-agricultural wages on agricultural employment, the coefficient has a negative sign as expected in most cases but not significant in any of the specifications. When the data is restricted to non-urbanized areas by excluding regions that consist of two large cities, namely Istanbul and Ankara regions, in column (4), significance of the coefficient of the price variable improves and increases in magnitude while that of the non-agricultural income remains insignificant. We suspect that there could also be a lag in the labour market, in the sense that labour mobility may lag behind price changes. We explore this scenario in column (3). However, the coefficient of lagged price change is not significant and has the wrong sign.
Our results suggest that the reverse mechanism, i.e., the idea that a large enough decrease in the non-agricultural income during the crisis might have caused the labour flow into agriculture is not supported in the Turkish data. Weiss (1997) finds a similar result using micro level upper Austrian data, that decreases in non-agricultural wages do not encourage off-farm workers to drop their jobs and go back to farm work. A model with moving costs could also account for the absence of this effect. As long as the decrease in non-agricultural real wages is not large enough to cover for moving costs, there would be no incentive for the workers to move back to agricultural work. Our data shows no significant relationship between non-agricultural wages and agricultural employment but a significant one between agricultural prices and employment.
A similar set of regressions run using changes in share of agricultural employment in total employment yields similar results but less significant coefficients.11 Table 7 shows these
results. From here onwards, we will use the changes in share of agricultural employment as the dependent variable in our remaining analysis. All regressions yield stronger results for the price variable when changes in levels are used and are not different for other independent variables. The results are robust to changes in model specification and exclusion of outliers in the data that show large deviations from the mean.
11Changes in share of agricultural employment are calculated as differences in shares from the previous
Table 6: Regression results: Effect of change in agricultural prices
(1) (2) (3) (4)
Time dummies Fixed Effects Lag Restricted
Price 0.862*** 0.851*** 0.914*** (0.302) (0.305) (0.296) NA Income -0.0735 0.00191 -0.0228 -0.0878 (0.427) (0.456) (0.527) (0.441) Lag Price -0.287 (0.283) 2006 0.0501 0.0535 -0.160** 0.0614 (0.048) (0.050) (0.070) (0.051) 2007 0.0225 0.0262 -0.127* 0.0431 (0.052) (0.050) (0.066) (0.053) 2008 0.0579 0.0620 -0.0910 0.0814 (0.061) (0.061) (0.076) (0.060) 2009 0.142*** 0.146*** -0.0816 0.164*** (0.046) (0.046) (0.054) (0.045) 2010 0.155** 0.162** 0 0.134** (0.066) (0.063) (0.000) (0.065) 2011 0.103** 0.107** -0.0279 0.0891* (0.045) (0.046) (0.074) (0.047) Constant -0.0475 -0.0524 0.114** -0.0573 (0.042) (0.035) (0.046) (0.044) Observations 182 182 156 168 R2 0.131 0.143 0.081 0.121 Adjusted R2 0.091 0.104 0.037 0.077
Notes: The dependent variable is the log difference of agricultural employment from the previous year in each region. Robust standard errors in parentheses (clustered at regional level). Region dummies are suppressed for easy reading in column (2). Only time dummies are used in regressions (1), (3) and (4). Column (4) includes all except two regions, Istanbul and Ankara, where agricultural employment is very small due to urbanization. Stars indicate significance level: *p < .10, **p < .05, ***p < .01
The results in Table 7 column (1) imply that a one percent increase in agricultural prices increase the share of agricultural employment by 0.16 percentage points. Hence, the 6.4 percent overall increase in agricultural prices relative to CPI from 2007 to 2011, would on average increase the share of agricultural employment by approximately 1 percentage points, about half as much as that observed in the data. Using the results for the change in levels in Table 6 column (1) though, we can only explain 20 percent of the increase in the number
Table 7: Regression results: Effect of change in agricultural prices
(1) (2) (3) (4)
Time dummies Fixed Effects Lag Restricted
Price 0.158** 0.146* 0.191** (0.074) (0.078) (0.075) NA Income -0.0747 -0.0651 -0.0610 -0.0731 (0.116) (0.127) (0.138) (0.118) Lag Price -0.102 (0.068) 2006 0.0149 0.0152 -0.0192 0.0177 (0.011) (0.012) (0.014) (0.012) 2007 0.0162 0.0173 -0.00760 0.0180 (0.012) (0.011) (0.016) (0.013) 2008 0.0237 0.0246* 0.00377 0.0273* (0.014) (0.014) (0.016) (0.015) 2009 0.0389*** 0.0390*** 0.00406 0.0442*** (0.011) (0.011) (0.010) (0.011) 2010 0.0260 0.0275* 0 0.0281* (0.015) (0.015) (0.000) (0.016) 2011 0.0188 0.0199 0.00227 0.0199 (0.012) (0.013) (0.016) (0.013) Constant -0.0229** -0.0238** 0.000844 -0.0256** (0.011) (0.009) (0.009) (0.011) Observations 182 182 156 168 R2 0.103 0.110 0.043 0.115 Adjusted R2 0.062 0.068 -0.003 0.071
Notes: The dependent variable is the percentage point difference in the share of agricultural employment from the previous year, in each region. Robust standard errors in parentheses (clustered at regional level). Region dummies are suppressed for easy reading in column (2). Only time dummies are used in regressions (1), (3) and (4). Column (4) includes all except two regions, Istanbul and Ankara, where agricultural employment is very small due to urbanization. Stars indicate significance level: *p < .10, **p < .05, ***p < .01
of people employed in agriculture from 2007 to 2011.
Our results suggest that in regions where agricultural prices have been increasing, agricul-tural employment has also increased. We would like to remind here that our sample includes the time periods during which agricultural employment have been decreasing as well. Indeed,
the 8,9 percent decrease in the overall agricultural prices relative to CPI from 2004 to 2007 imply a decrease in the share of employment of about 1.3 percentage points, which is only 23 percent of the decrease in the data. Hence, our results are more general in the sense that agricultural prices play an important role in determining agricultural employment. Prices alone, of course, may not be the whole story.
5
Agricultural Area Usage and Exports
Here, we explore further whether factors other than included in our model, such as structural changes in agricultural production might have affected agricultural employment in Turkey. There are two scenarios we explore here. The first one is that agricultural production might have shifted towards products within agriculture that are more labour intensive such as perennial crops. The share of perennial crops in total arable land has increased over time, from 6.6 percent in 2004 to 13.5 percent in 2011. If agricultural employment increased in those areas where share of perennial crop production increased, this could in part explain the recent increase in agricultural production. The other scenario we explore is that exports of certain agricultural products that are relatively more labour intensive, again mainly perennial crops, might have led to an increase in agricultural employment. An example often quoted is the increase in exports of strawberries in recent years which have to be hand-picked.
Table 8 shows the results of a series of regressions that include changes in exports of agricultural products, changes in area used for production of vegetables and area used for perennial crop (mainly fruit) production, both relative to area usage for total production, by region. The coefficient for changes in regional exports of agricultural products are insignif-icant and have the wrong sign. The coefficient for area used for perennial crop production relative to total production is also not significant and has a negative sign implying that share of agricultural employment has decreased in regions where area used for perennial crop pro-duction increased. This implication is contrary to the intuitive suggestion that agricultural employment should have increased in such regions due to labour-intensive nature of peren-nial crop production. The sign for the coefficient of area used for vegetable production is in
Table 8: Regression results: Effect of exports and agricultural area usage (1) (2) (3) Price 0.158** 0.166** 0.147* (0.077) (0.074) (0.073) Exports -0.002 (0.005) Vegetables 0.0464 (0.029) Perennial Crops -0.0688 (0.041) 2006 0.0187* 0.0175* 0.0210** (0.010) (0.010) (0.010) 2007 0.0191 0.0203 0.0212 (0.014) (0.014) (0.013) 2008 0.0267* 0.0257 0.0278* (0.015) (0.015) (0.015) 2009 0.0435*** 0.0437*** 0.0442*** (0.011) (0.012) (0.010) 2010 0.0316** 0.0313** 0.0332** (0.014) (0.014) (0.013) 2011 0.0225* 0.0197* 0.0253** (0.012) (0.011) (0.011) Constant -0.0268** -0.0266** -0.0267*** (0.010) (0.010) (0.010) Observations 182 182 182 R2 0.100 0.115 0.112 Adjusted R2 0.059 0.074 0.071
Notes: The dependent variable is the change in the share of agricultural employment. Changes in area used for vegetable and perennial crop production are relative to total arable land. Robust standard errors in parentheses, clustered by region. * p < .10, ** p < .05, *** p < .01
the right direction but the coefficient is not significant.
Furthermore, we explored the case of greenhouse production. In recent years, greenhouse usage in certain regions have increased in Turkey. Since agricultural production using green-houses are also labour intensive we run an additional regression using changes in greenhouse area by region although data for that is only available until 2010. The results are once again insignificant. It seems that the structural changes in regional production structure has not
played a significant role in the increase in agricultural employment.
6
Unemployment and Expectations
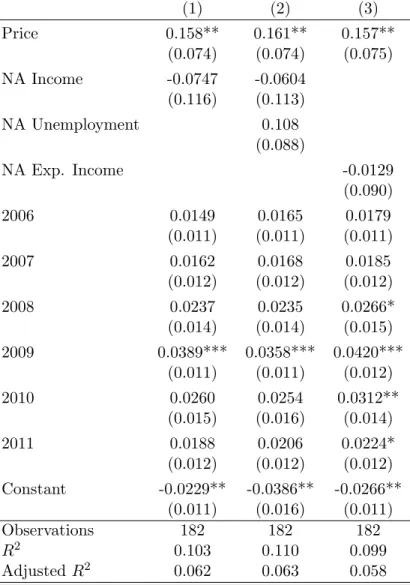
Lastly, following Harris-Todaro model, we explore the role of unemployment in non-agricultural sectors and thus the expectation on finding a job in the non agricultural sector on agricul-tural employment. According to the Harris and Todaro, the existence of unemployment in the non-agricultural sector makes it uncertain to find a job and thus the income that such a job will bring only comes with the probability of (1-unemployment rate). We run a set of regressions where unemployment rate and expected income in the non-agricultural sec-tor are used as independent variables. The expected income in the non-agricultural secsec-tor is calculated as “(1-unemployment rate) x non-agricultural income” where non-agricultural income is computed as in section 4.
Table 9 shows the regression results. Coefficients of both the non-agricultural unem-ployment rate and expected income are insignificant, although they have signs in the right direction. Results are similar when changes in levels of agricultural employment are used. Regional non-agricultural unemployment does not seem to play a role in the changes in agricultural employment. However, unemployments rates in large urban areas may still be important if there was reverse migration from these areas to many different regions. Unfortu-nately, we do not have any data on whether those workers who switched from non-agricultural jobs to agricultural did so within their regions or across regions. Hence we cannot account for this factor.
7
Conclusion
Economic development everywhere in the world is characterized by a decreasing share of agricultural output in GDP and a decreasing share of agricultural in total employment. In most of the developed countries labour share of agriculture decreased below 10% in the aftermath of the Second World War. Today, developing countries are experiencing a similar
Table 9: Regression results: Effect of non-agricultural employment and expected income (1) (2) (3) Price 0.158** 0.161** 0.157** (0.074) (0.074) (0.075) NA Income -0.0747 -0.0604 (0.116) (0.113) NA Unemployment 0.108 (0.088) NA Exp. Income -0.0129 (0.090) 2006 0.0149 0.0165 0.0179 (0.011) (0.011) (0.011) 2007 0.0162 0.0168 0.0185 (0.012) (0.012) (0.012) 2008 0.0237 0.0235 0.0266* (0.014) (0.014) (0.015) 2009 0.0389*** 0.0358*** 0.0420*** (0.011) (0.011) (0.012) 2010 0.0260 0.0254 0.0312** (0.015) (0.016) (0.014) 2011 0.0188 0.0206 0.0224* (0.012) (0.012) (0.012) Constant -0.0229** -0.0386** -0.0266** (0.011) (0.016) (0.011) Observations 182 182 182 R2 0.103 0.110 0.099 Adjusted R2 0.062 0.063 0.058
Notes: The dependent variable is the change in the share of agricultural employment. Robust standard errors in parentheses, clustered by region. * p < .10, ** p < .05, *** p < .01
transformation and Turkey is no exception. Agricultural employment and its share in total employment has been declining in Turkey since the 1960s. However, the declining trend has been reversed since 2007 and agricultural employment has been increasing for last four years. In this paper, we study the possible causes of the change in trend using regional panel data from Turkey.
We present a simple open-economy model that incorporates the effects of productivity changes and exogenous price shocks across agricultural and non-agricultural sectors. We show that the model implies a labour pull effect in line with the literature on structural
transformation in agriculture. Using panel data on 26 regions of Turkey over 6 years, we analyse the implications of the model for agricultural employment. We find that changes in agricultural prices are an important determinant of agricultural employment in Turkey. Our results show that when the price of the agricultural produce in a region increases exoge-nously, agricultural employment increases in that region. We also find that non-agricultural wages are not very effective; our empirical results indicate no significant relationship be-tween changes in non-agricultural wages and agricultural employment. Exploring effects of other possible factors such as changes in regional production structures and changes in non-agricultural employment opportunities yield similar results.
Combining these findings, we believe that the recent increase in global food prices has played an important role in the increase in agricultural employment in Turkey. Although one could hypothesize that the adverse effects of the global crisis on the non-agricultural sector might have played a role as well, we do not find any empirical evidence in support of this view. If our inference is correct, it is possible that some other developing countries like Turkey might have experienced a similar increase in the agricultural employment. Whether other developing countries have been affected in the same way or not deserves further investigation.
References
Alvarez-Cuadrado, Francisco and Markus Poschke (2011), “Structural change out of agri-culture: Labor push versus labor pull.” American Economic Journal: Macroeconomics, 3, 127–58.
C¸ akmak, Erol H. (2004), “Structural change and market opening in agriculture: Turkey towards eu accession.” Working Paper 04/10, Economic Research Center, Middle East Technical University.
Gollin, Douglas, Stephen L. Parente, and Richard Rogerson (2007), “The food problem and the evolution of international income levels.” Journal of Monetary Economics, 54, 1230–1255.
G¨ursel, Seyfettin, Z¨umr¨ut ˙Imamo˘glu, and Tu˘gba Zeydanlı (2010a), “Tarı m istihdamı bilme-cesi.” Research Brief 10/95, Bah¸ce¸sehir University Center for Economic and Social Re-search (Betam).
bilme-cesi: Tartı¸sma notu.” Discussion Note 10/95, Bah¸ce¸sehir University Center for Economic and Social Research (Betam).
Hansen, Gary D. and Edward C. Prescott (2002), “Malthus to solow.” American Economic Review, 92, 1205–1217.
Harris, J and M Todaro (1970), “Migration, unemployment and development: A two-sector analysis.” American Economic Review, 60, 126–142.
˙Ilkkaracan, ˙Ipek and ˙Insan Tunalı (2011), “Agricultural transformation and the rural labor market in turkey.” In Rethinking Structural Reform in Turkish Agriculture: Beyond the World Bank’s Strategy (Baris Karapinar, Fikret Adaman, and Gokhan Ozertan, eds.), chapter 7, 105–148, Nova Science Publishers, New York.
ILO (2012), “Global employment trends 2012, preventing a deeper jobs crisis.” Technical report, International Labour Office, Geneva.
Lewis (1954), “Economic development with unlimited supplies of labour.” Manchester School, 22, 139–191.
Matsuyama, Kiminori (1992), “Agricultural productivity, comparative advantage, and eco-nomic growth.” Journal of Ecoeco-nomic Theory, 58, 317–334.
Ngai, L. Rachel and Christopher A. Pissarides (2007), “Structural change in a multisector model of growth.” American Economic Review, 97, 429–443.
Nurske, R (1954), Problems of capital formation in underdeveloped countries. Oxford Uni-versity Press, New York.
Weiss, Christoph R (1997), “Do they come back again? the symmetry and reversibility of off-farm employment.” European Review of Agricultural Economics, 24, 65–84.
Figure 1: Agricultural employment and its share in total employment
Notes: The left axis shows the share of agricultural employment in total employment and the right axis shows the number of people employed in the agriculture (in thousands). The data is from the Household Labour Force Survey of Turkstat.
Figure 2: Age composition in agricultural employment
Figure 3: Monthly Food Price Index (2002-2004=100) and the PPI for Agricultural Goods in Turkey (2003=100)
Notes: The figure plots the World Food Price Index and the Producer Price Index (PPI) for agricultural products in Turkey. The data is from Food and Agriculture Organization of the United Nations and TurkStat.
Figure 4: Relative price of agricultural products in Turkey
Notes: The figure plots the ratio of monthly Producer Price Index for Agricultural Products to Producer Price Index for Industrial Products in Turkey (2003=100). Data is from TurkStat.
Figure 5: Distribution of change in share of agricultural employment across regions −.2 −.1 0 .1 .2 0 5 10 15 20 25 id
Agricultural Employment Mean
Notes: The x-axis shows the id numbers for the 26 regions in the data. Table A.1 in appendix shows which regions the id codes represent. The y-axis shows the change in share of agricultural employment. There are seven observations (years) for each region. The line plots the average yearly change in agricultural employment between 2004-2011 in each region.
Figure 6: Distribution of change in share of agricultural employment across years
−.2 −.1 0 .1 .2 2005 2006 2007 2008 2009 2010 2011 year
Agricultural Employment Mean
Notes: The x-axis shows the years and the y-axis shows the change in agricultural employment for the 26 regions in the data. There are 26 observations (regions) in each year. The line plots the average yearly change in agricultural employment across regions for each year.
Appendices
A
List of regions and products
Table A.1 shows the list of 26 regions at the NUTS2 level in Turkey. Table A.2 lists the agricultural products in our dataset.
Table A.1: List of regions at NUTS2 level in Turkey
1 TR10 (˙Istanbul)
2 TR21 (Tekirda˘g, Edirne, Kırklareli) 3 TR22 (Balıkesir, C¸ anakkale)
4 TR31 (˙Izmir)
5 TR32 (Aydın, Denizli, Mu˘gla)
6 TR33 (Manisa, Afyon, K¨utahya, U¸sak) 7 TR41 (Bursa, Eski¸sehir, Bilecik)
8 TR42 (Kocaeli, Sakarya, D¨uzce, Bolu, Yalova) 9 TR51 (Ankara)
10 TR52 (Konya, Karaman)
11 TR61 (Antalya, Isparta, Burdur) 12 TR62 (Adana, Mersin)
13 TR63 (Hatay, Kahramanmara¸s, Osmaniye)
14 TR71 (Kırıkkale, Aksaray, Ni˘gde, Nev¸sehir, Kır¸sehir ) 15 TR72 (Kayseri, Sivas, Yozgat)
16 TR81 (Zonguldak, Karab¨uk, Bartın) 17 TR82 (Kastamonu, C¸ ankırı, Sinop) 18 TR83 (Samsun, Tokat, C¸ orum, Amasya)
19 TR90 (Trabzon, Ordu, Giresun, Rize, Artvin, G¨um¨u¸shane) 20 TRA1 (Erzurum, Erzincan, Bayburt)
21 TRA2 (A˘grı, Kars, I˘gdır, Ardahan) 22 TRB1 (Malatya, Elazı˘g, Bing¨ol, Tunceli) 23 TRB2 (Van, Mu¸s, Bitlis, Hakkari) 24 TRC1 (Gaziantep, Adıyaman, Kilis) 25 TRC2 (S¸anlıurfa, Diyarbakır)
Table A.2: List of agricultural products
Wheat (durum) Cotton (raw) Cauliflower Sour oranges
Wheat (other) Cotton (lint) Broccoli Apples (golden)
Maize Flax (fiber) Cabbages (white) Apples (starking)
Rice Hemp (fiber) Cabbages (red) Apples (Amasya)
Barley (for beer) Poppy (capsule) Cabbages (kale) Apples (g.smith)
Barley (other) Lupin Brussels sprouts Apples (other)
Rye Hop Lettuce (loose leaf) Pears
Oats Cow vetches (seed) Lettuce (cos) Quinces
Spelt Onion (green) Lettuce (iceberg) Loquats
Millet Onion (dry) Artichokes Medlar
Canary gras Garlic (green) Celery Peaches (nectarines)
Mixed grain Garlic (dry) Spinach Peaches (other)
Triticale Leek Swiss chard Plums
Sorghum Carrots Purslane Apricots
Potatoes (other) Turnip Parsley Wild apricots
Broad bean Beets (red) Rocket Cherries
Pea (Dry) Celeriac Cress Sour cherries
Chick pea Radish (horse) Mint Cornel
Bean (dry) Radish (red) Dill Oleaster
Lentil (red) Tomatoes (for table) Asparagus Strawberries Lentil (green) Tomatoes (for process) Cultivated mushroom Raspberry Cow pea (dry) Cucumber (for table) Grapes (table) Mulberry Wild vetches (seed) Cucumber (for pickle) Grapes (table seedless) Pomegranates Fenugreek Hairy cucumber Grapes (raisins) Persimmons Grass pea Pepper (for process) Grapes (raisins seedless) Carobs
Jerusalem artichokes Pepper (bell) Grapes (for wine use) Olive (for table)
Soybean Pepper (green) Bananas Olive (for oil)
Groundnut Okra Kiwi Almonds
Sunflower (for oil) Eggplant Avocado Hazelnuts
Sunflower (for app.) Squash Figs Walnuts
Sesame Pumpkin Oranges (Washington) Chestnuts
Safflower Squash (for app.) Oranges (jaffa) Pistachios
Rapeseed Pea (green) Oranges (other) Dry pepper (red)
Flax (seed) Bean (green) Mandarin (satsumas) Anise Hemp (seed) Cowpea (green) Mandarin (clementine) Cumin Poppy (seed) Broad beans (green) Mandarin (king) Thyme Tobacco Calavence (green) Mandarin (other) Green tea
Sugar beets Melon Lemons
Beets for fodder Watermelon Grape fruits
Source: TurkStat. The abbreviation app. stands for appetizer.
The list includes 154 products for which both price and production data is available for years between 2004 and 2010. There are 172 types of agricultural products in the data set for agricultural production. 15 of these are produced for feeding animals and there is no price data available for these products. Prices of 3 other products are also not available. Those are cotton seeds, sweet potatoes and rice in the husk.