www.betam.bahcesehir.edu.tr
1
ECONOMY CONTRACTED IN THE SECOND QUARTER
Seyfettin Gürsel*, Zümrüt İmamoğlu
†, ve Barış Soybilgen
‡Executive Summary
Turkey’s real Gross Domestic Product (GDP) increased at a rate of 2.1 percent in the second quarter of 2014 from the same quarter of the previous year. Seasonally adjusted GDP declined by 0.5 percent in the second quarter from the previous quarter. The economy contracted for the first time since the first quarter of 2012.
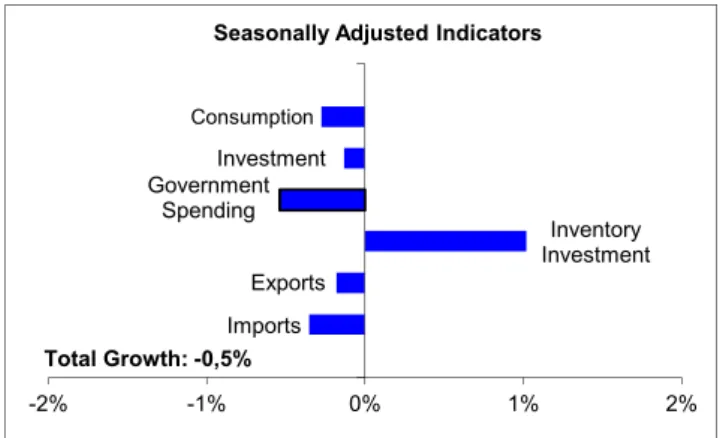
The contraction was caused by declines in consumption, investment, government expenditures and exports in the second quarter compared to the previous quarter. Private consumption and investment declined by 0.4 percent and 0.7 percent, respectively. Government spending and exports fell 3.3 percent and 0.7 percent, respectively. The contribution of net exports to the growth was negative. The only component that increased in the second quarter was inventory investment. It increased by 1.0 percent. In the first quarter of 2014, growth was strong, 1.9 percent qoq, due to high foreign demand. Private domestic demand, on the other hand, had shrank in the first quarter. We see that domestic demand continued to decline in the second quarter. In addition foreign demand also decreased causing the economy to contract.
Low growth reduced the current account deficit. The 12-month current account deficit to GDP ratio which •Seyfettin Gürsel, Betam, Director
†Zumrut Imamoglu, Betam, Research Associate
‡Baris Soybilgen, Betam, Research Assistant
Figure 1. Change in GDP components from the previous quarter, 2014-Q2
Source: Turkstat.
Figure 2. Contributions of GDP components to 2014-Q2 GDP growth
Source: Turkstat.
was 7.5 percent at the end of the first quarter fell to 6.5 percent at the end of the second quarter. Gold excluded current account deficit fell to 5.9 percent from 6.4 percent. Imports Exports Government Spending Investment Consumption -6% -4% -2% 0% 2% 4%
Seasonally Adjusted Indicators
Imports Exports Inventory Investment Government Spending Investment Consumption -2% -1% 0% 1% 2%
Seasonally Adjusted Indicators
Total Growth: -0,5%
Growth Review: 2014, 2
nd
Quarter
www.betam.bahcesehir.edu.tr
2
Both domestic and foreign demand declined
In the second quarter of 2014, Turkish economy contracted by 0.5 percent. Except inventory investments all components of the GDP subtracted from growth. In the first quarter, consumption and investment had subtracted from the GDP, however, surges in exports and government expenditures offset the weakness in the domestic demand, and as a result, the growth rate was higher than expected. In the second quarter, the decline in private consumption and private investment expenditures slowed down. However, exports and government expenditures declined in the second quarter in contrast to the first quarter. Therefore, the growth rate was significantly lower than expected and the economy contracted for the first time since the first quarter of 2012 (Figure 3).
Figure 3:Quarter-on-quarter real GDP growth rate
Source: Turkstat.
Private consumption and investment continues to decline
Table 1 shows contributions of GDP components to growth in the first and second quarter. Seasonally adjusted and calendar day corrected figures show that private consumption expenditures declined by 0.4 percent and subtracted 0.3 percentage points from growth in the second quarter. Consumption had declined by 1.1 percent in the first quarter. Private investment fell by 0.7 percent and subtracted 0.1 percentage points from growth in the second quarter. In the first quarter, private investment had declined by 4.3 percent.
The decrease in both consumption and investment slowed down, but the outlook of domestic demand remains weak. Private investment subtracted from growth in 6 out of 9 quarters since 2012, and contributed very little other times (Figure 4).
Figure 4. Private Investment, QoQ Contribution
Source: Turkstat.
Foreign demand is weak, contribution of exports is negative
Exports which increased by 6 percent in the first quarter declined by 0.7 percent and subtracted 0.2 percentage points from growth in the second quarter. Imports which declined by 2.7 percent in the first quarter increased by 1.3 percent and subtracted 0.4 percentage points from growth in the second quarter.
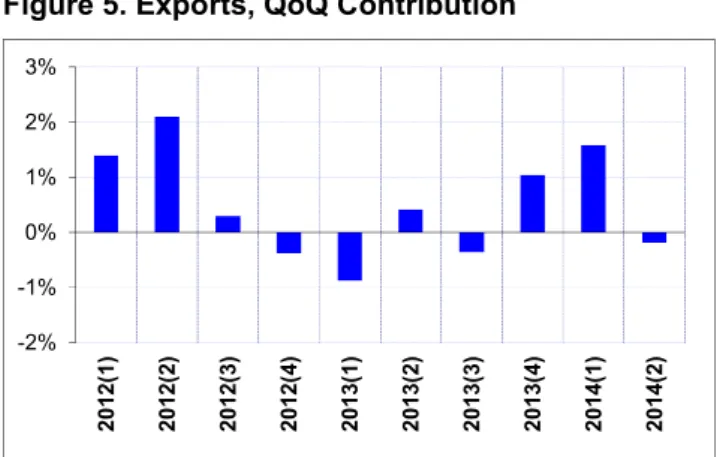
Contraction in German and Italian economies, stagnation in French economy and zero growth in the Eurozone in the second quarter adversely affected Turkey's exports. Contribution of exports to the growth had been high, above 1 percent qoq, in the last two quarters after a period of low contribution (Figure 5). However, sluggish demand from Europe erased gains quickly.
The increase in imports was mainly due to the increase in imports of intermediate goods. Although increase in imports is a positive sign for demand, inventory investment also increased, signaling a slowdown in demand. -1% 0% 1% 2% 3% 4% 5% 20 10 (1 ) 20 10 (2 ) 20 10 (3 ) 20 10 (4 ) 20 11 (1 ) 20 11 (2 ) 20 11 (3 ) 20 11 (4 ) 20 12 (1 ) 20 12 (2 ) 20 12 (3 ) 20 12 (4 ) 20 13 (1 ) 20 13 (2 ) 20 13 (3 ) 20 13 (4 ) 20 14 (1 ) 20 14 (2 ) -2% -1% 0% 1% 2% 3% 20 12 (1 ) 20 12 (2 ) 20 12 (3 ) 20 12 (4 ) 20 13 (1 ) 20 13 (2 ) 20 13 (3 ) 20 13 (4 ) 20 14 (1 ) 20 14 (2 )
www.betam.bahcesehir.edu.tr
3
Figure 5. Exports, QoQ Contribution
Source: Turkstat.
Major brake on government expenditures
For the last two years, government spending had been contributing significantly to growth. In 2012, government spending contribution was 1.0 percentage points and in 2013 it was 1.6 percentage points. In the first quarter of 2014, this contribution continued and government spending increased by 5,4 percent and added 0.9 percentage points to growth. However, in the second quarter, government spending declined significantly. It decreased by 3.3 percent in and subtracted 0.5 percentage points from qoq growth.
Compared to other components, this is the largest subtraction from growth in the second quarter. Given the weakness in demand and slowdown in government revenues, an adjustment in spending was expected, although we have to note that the budget targets for the year-end remain solid.
Forecasts and the future of growth
Betam's YoY forecast for the first quarter was 3.1 percent. Data release of 2.1 percent was much lower than Betam's forecast, as well as market expectations. We expected the economy to grow by 0.1 percent QoQ, but instead the economy contracted by 0.5 percent. In our August brief, we pointed out that the weakness in investment would continue and the contribution of net exports would be negative due to the slowdown in Europe. However, private consumption expenditure declined in contrast to our expectations. In line with our expectations, the
current account deficit ratio declined from 7.5 to 6.5 percent, and the gold excluded current account deficit fell from 6.4 percent to 5.9 percent.
The third quarter began with a high increase in industrial production in July. The Turkish Central Bank’s consecutive interest rate cuts reduced interest rates on bank loans and increased credit demand. On the other hand, the slowdown in Europe, Ukrainian crisis, and conflicts in Iraq continues to affect Turkey's exports. This fall, Federal Reserve’s decision on interest rates will begin to shape up, and this might increase the volatility in emerging markets. In the third quarter, we expect that domestic demand will continue to be weak. Unless foreign demand recovers, and the contribution of net exports turns positive, growth will continue to be weak, below 3 percent YoY. We expect government to loosen the break on government spending slightly in the third quarter. -2% -1% 0% 1% 2% 3% 20 12 (1 ) 20 12 (2 ) 20 12 (3 ) 20 12 (4 ) 20 13 (1 ) 20 13 (2 ) 20 13 (3 ) 20 13 (4 ) 20 14 (1 ) 20 14 (2 )
www.betam.bahcesehir.edu.tr
4
Table 1.Changes in and contributions of GDP
components for 2014Q2 and 2014Q1, compared
to the previous quarter.
2014 – 2.Q Change(%) Contribution(pp) Consumption -0.4% -0.3% Investment -0.7% -0.1% Government exp. -3.3% -0.5% Inventory Inv. -- 1.0% Exports -0.7% -0.2% Imports 1.3% -0.4% 2014 – 1.Q Change(%) Contribution(pp) Consumption -1.1% -0.8% Investment -4.3% -0.9% Government exp. 5.4% 0.9% Inventory Inv. -- 0.2% Exports 6.0% 1.6% Imports -2.7% 0.8% Source: Turkstat.
Table 2.Changes in and contributions of GDP
components for 2014Q2 and 2014Q2, compared
to the same quarter of previous year.
2014 – 2.Q Change(%) Contribution(pp) Consumption 0.4% 0.3% Investment -4.1% -0.9% Government exp. 1.4% 0.2% Inventory Inv. -- -0.4% Exports 5.5% 1.5% Imports -4.6% 1.4% 2014 – 1.Q Change(%) Contribution(pp) Consumption 3.2% 2.2% Investment -1.6% -0.3% Government exp. 8.7% 1.2% Inventory Inv. -- -1.1% Exports 11.1% 2.8% Imports 0.7% -0.2% Source: Turkstat.
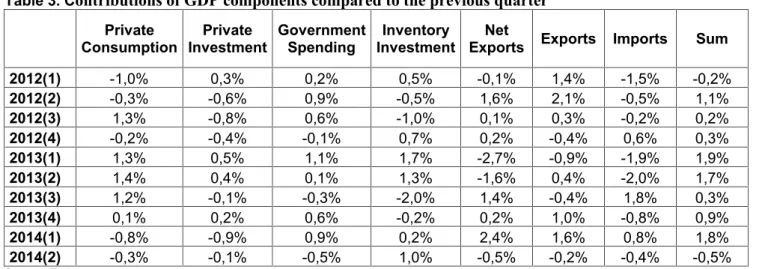
Table 3. C
ontributions of GDP components compared to the previous quarter
Private
Consumption InvestmentPrivate GovernmentSpending InvestmentInventory Exports Exports ImportsNet Sum 2012(1) -1,0% 0,3% 0,2% 0,5% -0,1% 1,4% -1,5% -0,2% 2012(2) -0,3% -0,6% 0,9% -0,5% 1,6% 2,1% -0,5% 1,1% 2012(3) 1,3% -0,8% 0,6% -1,0% 0,1% 0,3% -0,2% 0,2% 2012(4) -0,2% -0,4% -0,1% 0,7% 0,2% -0,4% 0,6% 0,3% 2013(1) 1,3% 0,5% 1,1% 1,7% -2,7% -0,9% -1,9% 1,9% 2013(2) 1,4% 0,4% 0,1% 1,3% -1,6% 0,4% -2,0% 1,7% 2013(3) 1,2% -0,1% -0,3% -2,0% 1,4% -0,4% 1,8% 0,3% 2013(4) 0,1% 0,2% 0,6% -0,2% 0,2% 1,0% -0,8% 0,9% 2014(1) -0,8% -0,9% 0,9% 0,2% 2,4% 1,6% 0,8% 1,8% 2014(2) -0,3% -0,1% -0,5% 1,0% -0,5% -0,2% -0,4% -0,5% Source: Turkstat.