THE ENGINE OF THIRD QUARTER GROWTH: EXPORTS
Zümrüt İmamoğlu* ve Barış Soybilgen
†Executive Summary
July data released by TurkStat shows that the main driver of third quarter GDP growth will be exports. The slowdown in domestic demand coupled with more than 10 percent depreciation of the Turkish Lira curbed imports. Increase in exports pushed the Industrial Production Index (IPI) close to its peak point back in January 2011. Our third quarter forecast indicates that the real GDP will grow by 0.8 percent in the third quarter from the previous quarter. This amounts to a 7.6 percent increase from the same quarter of the previous year.
Trade deficit in volume continue to decrease in the third quarter. In July, current account deficit reduced to $5.3 billion due to seasonal income from Tourism services. Betam’s annual current account deficit forecast for the end of third quarter is 9.5 percent of GDP. The future GDP growth will depend on the course of the debt crisis in Europe. Contraction in demand for exports in Europe would adversely affect the Turkish economy and reduce the GDP growth. Stimulating domestic demand in response might further increase the current account deficit.
* Dr. Zümrüt İmamoğlu, Betam, Research Associate. [email protected]
† Barış Soybilgen, Betam, Research Assistant, [email protected]
Table 1. Betam’s quarterly and annual growth rate forecasts
Source: Betam
*sa: seasonally and calendar day adjusted **ca: calendar day adjusted
Unexpected increase in investment demand Components of GDP in the second quarter were almost stagnant except investment. We believe that investors’ concerns on depreciation of the Turkish Lira and the expectations of an increase in cost of loans after elections fueled imports of investment goods and the unexpected growth in investment demand in the second quarter. Our indicators for investment show that investment demand will decelerate in the third quarter.
The slowdown in domestic demand continues in the third quarter and growth is mainly driven by exports. Export figures in July were high and according to preliminary data released by the Turkish Exports Assembly (TEM), August figures will be similar. On the other hand, the contraction
2011 Q3 Real GDP growth (%)
(quarter on quarter, sa*) 0.8
Real GDP growth (%)
(year on year, ca**) 7.6
Current account deficit
(% of GDP, annual) 9.5
Economic Outlook and Forecasts:
September 2011
in imports that began in the last quarter continues in the third quarter as well. The diminishing trade deficit will help curb the high current account deficit.
Consumption fell in July
Data released so far show that consumption decelerated in the third quarter. In July, consumer goods imports and nondurable consumer goods manufacturing decreased by 6.8 and 4.6 percent respectively. Consumer confidence index also fell 0.7 percent in July. Special Consumer Tax (SCT) both decreased both in July and August due to fall in imports and consumption. The only positive economic indicator for consumption in July was durable goods manufacturing which increased by 1.8 percent. Both the depreciation of the Turkish Lira and Turkish officials’ warnings about possible contagion of European debt crisis caused consumer confidence to deteriorate and slowed down consumption.
Investment goods imports decrease In the second quarter, economic growth was driven by a surge in investment demand. Investment goods imports had increased by 9.7 percent. In the third quarter though, the first signals are quite contrary. In July, investment goods imports decreased by 13.9 percent and real sector confidence index decreased both in July and August. On the other hand, investment goods manufacturing increased by 3.9 percent in July. If investment demand in the second quarter increased due to after-election jitters as we expected, then we should see a sharp deceleration in investment demand in the third quarter.
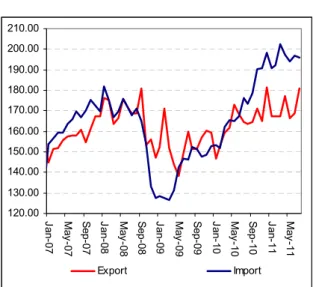
Surge in exports
Figure 2 shows monthly changes of seasonally adjusted import and export volume indices. In July, exports increased by 6.9 percent and imports decreased by 0.5 percent. Net exports in the second quarter added to economic growth. We expect that contribution of net exports to quarterly GDP will be even higher in the third quarter, despite recession fears in the euro area.
Current account deficit will be 9.3 percent Due to the increase in exports and the decline in imports, trade deficit in volume decreased in July. Current account deficit also decreased due to the seasonal increases in tourism income during summer months. Trade deficit was $9 billion and current account deficit was $5.3 billion in July. Betam expects that the annual current account deficit will be 9.3 percent of GDP at the end of third quarter.
Table 2. Monthly and quarterly changes of Betam’s selected indicators (real and sa)
Indicators April May June July August
2011 2. Quarter 2011 3. Quarter Exports 6.2 -6.0 1.8 6.9 ** 2.5 5.9 Imports -2.6 -1.5 1.4 -0.5 ** 0.4 -0.0
Intermediate goods import -2.5 -1.8 0.6 -0.5 ** -1.8 -0.7
Consumer goods import -6.4 -6.0 7.1 -6.8 ** -0.0 -4.5
Investment goods import -6.3 7.2 -1.1 -13.9 ** 9.7 -12.6
Industrial Production Index (IPI) -0.2 -0.3 -0.8 2.7 ** -1.6 2.0
Nondurable consumer goods -1.1 1.6 0.7 -4.6 ** 0.0 -3.7
Durable consumer goods -1.7 3.7 -0.8 1.8 ** 2.0 2.5
Intermediate goods -1.0 1.4 -1.2 0.4 ** -1.3 0.1
Investment goods -3.9 -2.1 4.7 3.9 ** -3.2 6.3
Capacity Utilization Rate (CUR) -0.4 -1.0 -0.0 -1.4 1.0 -1.3 -1.3
Nondurable consumer goods -1.0 0.4 0.3 -0.3 0.4 -0.6 0.2
Durable consumer goods -1.0 -2.5 2.2 0.5 -1.7 -1.2 0.3
Intermediate goods -0.7 -0.4 0.2 -1.9 1.4 -1.6 -1.3
Investment goods 0.7 -1.4 0.6 -1.8 3.4 0.3 -0.2
Soft Data
Consumer confidence index (Turkstat)
-0.2 -0.7 3.8 -0.7 ** 1.2 1.6
Reel sector confidence index -3.9 -0.1 -0.6 -0.6 -2.9 -4.7 -2.4
Financial Data
IMKB 100 (Stock Exchange) 3.1 -4.7 -0.6 -1.9 -13.0 -1.2 -10.1
Other
Special consumer tax* (SCT) 4.4 -4.3 11.0 -7.5 -1.0 6.3 -2.8
Automobile production -12.0 -3.7 7.4 1.0 -2.7 -10.9 3.1
Source: TurkStat. TCMB. Treasury. IMKB. Betam. All series are real (or inflation adjusted) wherever necessary and seasonally adjusted.
*This tax is collected on sales of goods such as gas. fuel oils. alcohol. tobacco products and automobiles. **Data not yet released
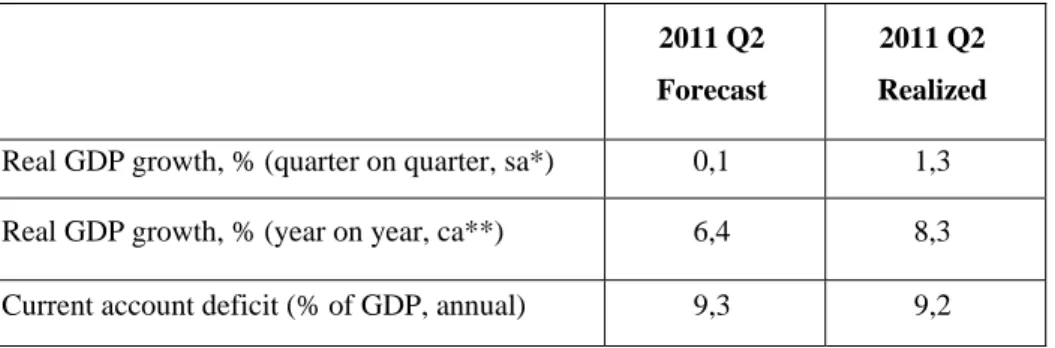
Table 3. Betam’s quarterly and annual growth forecasts and announced data
Source: Betam
*sa: seasonally and calendar day adjusted **ca: calendar day adjusted
2011 Q2 Forecast
2011 Q2 Realized
Real GDP growth, % (quarter on quarter, sa*) 0,1 1,3
Real GDP growth, % (year on year, ca**) 6,4 8,3
Figure 1: Capacity utilization rate and industrial production index (sa. left axis for CUR and right axis for IPI)
60 65 70 75 80 85 Ja n-07 A pr-0 7 Ju l-0 7 Oc t-07 Ja n-08 A pr-0 8 Ju l-0 8 Oc t-08 Ja n-09 A pr-0 9 Ju l-0 9 Oc t-09 Ja n-10 A pr-1 0 Ju l-1 0 Oc t-10 Ja n-11 A pr-1 1 Ju l-1 1 95 100 105 110 115 120 125 130 CUR IPI
Source : TurkStat. Betam
Figure 2: Volume indices of exports and imports (sa) 120.00 130.00 140.00 150.00 160.00 170.00 180.00 190.00 200.00 210.00 Jan-07 May -07 S ep-07 Jan-08 May -08 S ep-08 Jan-09 May -09 S ep-09 Jan-10 May -10 S ep-10 Jan-11 May -11 Export Import
Source : TurkStat. Betam
Figure 3: Ratio of current account deficit to GDP (yearly)
Current Account Deficit (% of GDP)
0.0 1.0 2.0 3.0 4.0 5.0 6.0 7.0 8.0 9.0 10.0 2008( Q 1) 2008( Q 3) 2009( Q 1) 2009( Q 3) 2010( Q 1) 2010( Q 3) 2011( Q 1) 2011( Q 3)
Source: TCMB. TurkStat. Betam * Betam’s forecasts
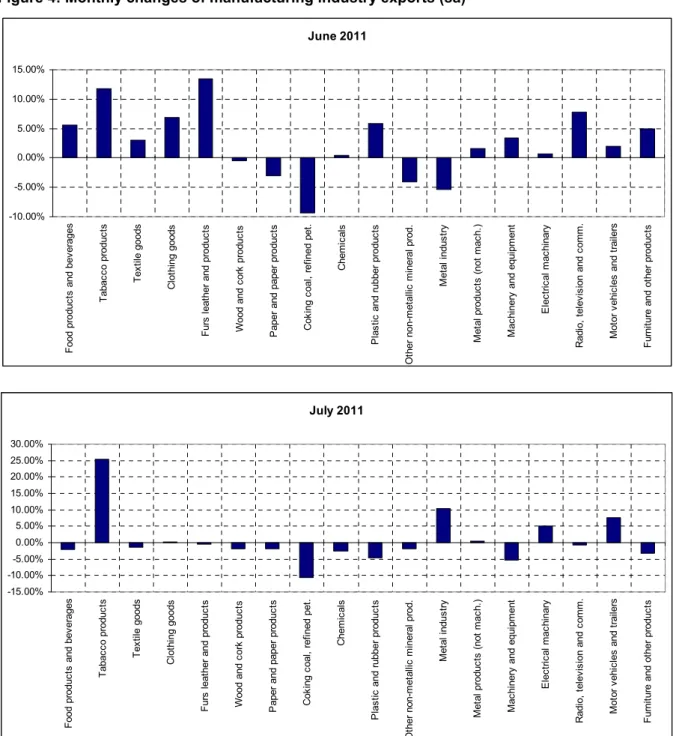
Figure 4: Monthly changes of manufacturing industry exports (sa)
Source: TurkStat. Betam
July 2011 -15.00% -10.00% -5.00% 0.00% 5.00% 10.00% 15.00% 20.00% 25.00% 30.00% F ood pr oduc ts and bev erages T abac co produc ts T ex til e goods C lot hi ng goods F urs leat her and pr oduc ts Wood and co rk produc ts P aper and paper pr oduc ts C ok ing c oal , ref ine d pet . C hem ic al s P las tic and r ubber pro duc ts O ther non-m et allic m in er al p ro d. M et al indus tr y M et al produc ts (not m ac h. ) M ac hi nery and e qui pm ent E lec tr ic al m ac hi nary R adi o, t el ev is ion and c om m . M ot or v ehi cl es and t rai le rs F urni tur e and ot her pr oduc ts June 2011 -10.00% -5.00% 0.00% 5.00% 10.00% 15.00% F ood produc ts and bev erages T abac co produc ts T ex til e goods C lot hi ng goods F urs leat her and produc ts Wood and c or k produc ts P aper and paper produc ts C ok ing c oal , r ef ined pet . C hem ic al s P las tic
and rubber produc
ts O ther non-m et al lic m iner al prod. M et al indus tr y M et al pr oduc ts ( not m ac h. ) M ac hi nery an d equi pm ent E lec tr ic al m ac hi nary R adi o, t el ev is ion and c om m . M ot or v ehi cl es and t rai le rs F ur ni ture and ot her produc ts