LOWER GROWTH AND CURRENT ACCOUNT DEFICIT
IN THE 3
RDQUARTER
Zümrüt İmamoğlu* ve Barış Soybilgen
†Executive Summary
In July, industrial production index (IPI) increased by 1.7 percent from June. Export volume index decreased by 1.3 percent whereas import volume index increased by 0.1 percent. In July, industrial production continued to increase, but exports declined. According to first indicators for the third quarter, there is a revival in private investment expenditure. However, private consumption expenditure seems to stagnate. Betam expects the real GDP growth to be slower in the third quarter than the second quarter. Betam’s quarter on quarter (QoQ) growth forecast for the third quarter of 2012 is 0.6 percent. The corresponding year on year (YoY) growth rate is 2.7 percent.
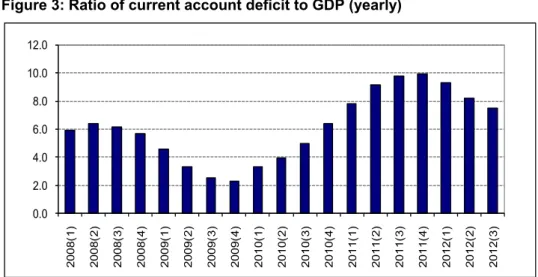
The current account deficit continues to decline. The 12-month current account deficit at the end of the second quarter decreased by $8.9 billion compared to the end of the first quarter and fell to $62.9 billion. Moreover, the current account deficit decreased by $1.6 billion in July and fell to $61.4 billion. According to the revised data announced on Tuesday, the ratio of the current
* Dr. Zümrüt İmamoğlu, Betam, Research Associate. [email protected]
† Barış Soybilgen, Betam, Research Assistant,
Table 1. Betam’s quarterly and annual growth rate forecasts
Source: Betam
*sa: seasonally and calendar day adjusted **ca: calendar day adjusted
account deficit to GDP was 8.2 percent at the end of the second quarter. We estimate that this ratio will fall to 7.5 percent at the end of third quarter.
Positive contribution of net exports may decline The real GDP growth in the second quarter was strong and more than accounted for the decrease in the first quarter. Betam’s QoQ real GDP growth forecast for the second quarter was 1 percent. However, Turkstat announced the real GDP growth as 1.8 percent which is above our forecast. As we expected, private investment expenditure declined and the anticipated revival in private consumption
2012 3rd Quarter
Forecast Real GDP growth, %
(quarter on quarter, sa*) 0.6
Real GDP growth, %
(year on year, ca**) 2.7
Current account deficit
(% of GDP, annual) 7.5
Economic Outlook and Forecasts:
September 2012
expenditure exhibited itself in inventory investment. In other words, consumer goods production increased but private consumption expenditure didn’t rise. Therefore, the revival in the production increased the inventory investment and contributed positively to real GDP growth. This positive contribution was stronger than we predicted. The contribution of net exports was positive as expected.
We still have limited data for the third quarter. Indicators in July point to a revival in production and stagnation in consumption. On the other hand, the decline in the export volume index and the limited increase in the import volume index might curb the positive contribution of net exports in the third quarter. Turkish Exporters’ Assembly’s figures indicate that nominal exports excluding gold fell in August. If weakness in exports continues in the coming months, the third quarter growth might be lower than second quarter. Betam’s quarter on quarter (QoQ) growth forecast for the third quarter of 2012 is 0.6 percent. The corresponding year on year (YoY) growth rate is 2.7 percent.
An interesting point about the components of the second quarter GDP data was that real public expenditures increased by 1 percent and contributed
only 0.1 percentage points to GDP growth.1 This
indicates that the government still pursues tight fiscal policy. On the other hand, the Central Bank is slowly easing monetary policy. Even though the Turkish Central Bank had not changed the lower and upper bounds of the interest rate corridor until
1
See: “Growth review 2012 2nd Quarter”, Betam.
recently, it has already decreased the cost of funding for banks. In parallel to the decline in the cost of funding, cash and housing loan interest rates decreased slightly (Figure 4). If the fall in interest rates continues through the third quarter, it may support the GDP growth by boosting private consumption expenditure. Moreover, if this limited monetary expansion turns out to be sufficient in stimulating consumption, Turkish Central Bank will achieve supporting growth without worsening inflation expectations. However, positive contribution of net exports might be lower than in the second quarter, making it hard to push the growth above 3 percent.
Consumption indicators are on the rise
The economic indicators we use in forecasting private consumption expenditures are mostly positive in July. Imports of consumption goods increased by 5.5 percent in July from the previous month. Durable and non-durable consumer goods productions increased by 4.1 percent and 6 percent, respectively. Consumer Confidence Index increased by 1.3 percent. If economic indicators show a similar performance in the coming months of the third quarter, private consumption expenditure might increase slightly.
Uncertainty in investment expenditures
Real sector confidence index continued to deteriorate, decreasing 1.4 percent in August from the previous month. Automobile production also continued to decline in July, decreasing 2.5 percent. On the other hand, investment goods production increased by 5.5 percent. Investment
goods imports are very volatile. Even though we seasonally adjusted and outlier corrected investment goods imports series, we have detected a surge in investment goods imports. To make a solid analysis of private investment expenditures, it seems better to wait for the August data.
Net exports declined
Figure 2 shows monthly changes of seasonally adjusted import and export volume indices. In July, export volume index decreased by 1.3 percent whereas import volume index increased by 0.1 percent. Turkish Exporters’ Assembly’s figures of August do not indicate a positive outlook. Net exports that boosted the growth in the last 2 quarters may contribute very little to the growth in the third quarter.
Current account deficit will fall below 8 percent
In July, the current account deficit decreased by $1.6 billion compared to the same month of the last year and the 12-month current account deficit fell to $61.4 billion at the end of July. We expect the current account deficit to decrease in the coming months, but the rate of decrease will be slower. There are two reasons for this slowdown: one reason is that exports will be weaker in the second half of 2012 than the first half and the second reason is that the base effect from the previous year will diminish after the fourth quarter. At the end of second quarter, the current account to GDP ratio was 8.2 percent (before the revision in July, it was 8.3 percent). We forecast
that the current account to GDP ratio will fall to 7.5 percent at the end of the third quarter.
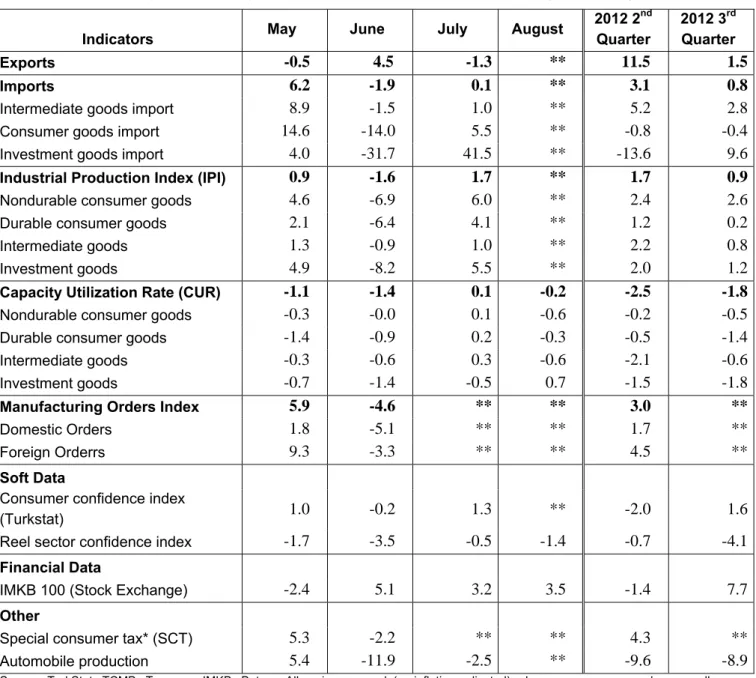
Table 2. Monthly and quarterly changes of Betam’s selected indicators (real and sa)
Indicators May June July August
2012 2nd Quarter 2012 3rd Quarter Exports -0.5 4.5 -1.3 ** 11.5 1.5 Imports 6.2 -1.9 0.1 ** 3.1 0.8
Intermediate goods import 8.9 -1.5 1.0 ** 5.2 2.8
Consumer goods import 14.6 -14.0 5.5 ** -0.8 -0.4
Investment goods import 4.0 -31.7 41.5 ** -13.6 9.6
Industrial Production Index (IPI) 0.9 -1.6 1.7 ** 1.7 0.9
Nondurable consumer goods 4.6 -6.9 6.0 ** 2.4 2.6
Durable consumer goods 2.1 -6.4 4.1 ** 1.2 0.2
Intermediate goods 1.3 -0.9 1.0 ** 2.2 0.8
Investment goods 4.9 -8.2 5.5 ** 2.0 1.2
Capacity Utilization Rate (CUR) -1.1 -1.4 0.1 -0.2 -2.5 -1.8
Nondurable consumer goods -0.3 -0.0 0.1 -0.6 -0.2 -0.5
Durable consumer goods -1.4 -0.9 0.2 -0.3 -0.5 -1.4
Intermediate goods -0.3 -0.6 0.3 -0.6 -2.1 -0.6
Investment goods -0.7 -1.4 -0.5 0.7 -1.5 -1.8
Manufacturing Orders Index 5.9 -4.6 ** ** 3.0 **
Domestic Orders 1.8 -5.1 ** ** 1.7 **
Foreign Orderrs 9.3 -3.3 ** ** 4.5 **
Soft Data
Consumer confidence index
(Turkstat) 1.0 -0.2 1.3 ** -2.0 1.6
Reel sector confidence index -1.7 -3.5 -0.5 -1.4 -0.7 -4.1
Financial Data
IMKB 100 (Stock Exchange) -2.4 5.1 3.2 3.5 -1.4 7.7
Other
Special consumer tax* (SCT) 5.3 -2.2 ** ** 4.3 **
Automobile production 5.4 -11.9 -2.5 ** -9.6 -8.9
Source: TurkStat. TCMB. Treasury. IMKB. Betam. All series are real (or inflation adjusted) wherever necessary and seasonally adjusted.
*This tax is collected on sales of goods such as gas. fuel oils. alcohol. tobacco products and automobiles. **Data not yet released
Figure 1: Capacity utilization rate and industrial production index (sa. left axis for CUR and right axis for IPI)
Source : TurkStat. Betam
Figure 2: Volume indices of exports and imports (sa)
Source : TurkStat. Betam
Figure 3: Ratio of current account deficit to GDP (yearly)
Source: TCMB. TurkStat. Betam
Figure 4: Weighted Average Interest Rates For Turkish Lira Banks' Loans (%)
Source: TCMB 95 100 105 110 115 120 125 130 135 60 65 70 75 80 85 Ja n -0 7 Ma y-0 7 Se p -0 7 Ja n -0 8 Ma y-0 8 Se p -0 8 Ja n -0 9 Ma y-0 9 Se p -0 9 Ja n -1 0 May -10 Se p -1 0 Ja n -1 1 May -11 Se p -1 1 Ja n -1 2 May -12 CUR IPI 120.00 130.00 140.00 150.00 160.00 170.00 180.00 190.00 200.00 210.00 220.00 Ja n -0 7 May -07 Se p -0 7 Ja n -0 8 May -08 Se p -0 8 Ja n -0 9 May -09 Se p -0 9 Ja n -1 0 May -10 Se p -1 0 Ja n -1 1 May -11 Se p -1 1 Ja n -1 2 May -12 Export Import 0.0 2.0 4.0 6.0 8.0 10.0 12.0 2 008 (1 ) 2 008 (2 ) 2 008 (3 ) 2 008 (4 ) 2 009 (1 ) 2 009 (2 ) 2 009 (3 ) 2 009 (4 ) 2 010 (1 ) 2 010 (2 ) 2 010 (3 ) 2 010 (4 ) 2 011 (1 ) 2 011 (2 ) 2 011 (3 ) 2 011 (4 ) 2 012 (1 ) 2 012 (2 ) 2 012 (3 ) 5 7 9 11 13 15 17 19 21 24 ‐12 ‐2 010 14 ‐01 ‐2 011 04 ‐02 ‐2 011 25 ‐02 ‐2 011 18 ‐03 ‐2 011 08 ‐04 ‐2 011 29 ‐04 ‐2 011 20 ‐05 ‐2 011 10 ‐06 ‐2 011 01 ‐07 ‐2 011 22 ‐07 ‐2 011 12 ‐08 ‐2 011 02 ‐09 ‐2 011 23 ‐09 ‐2 011 14 ‐10 ‐2 011 04 ‐11 ‐2 011 25 ‐11 ‐2 011 16 ‐12 ‐2 011 06 ‐01 ‐2 012 27 ‐01 ‐2 012 17 ‐02 ‐2 012 09 ‐03 ‐2 012 30 ‐03 ‐2 012 20 ‐04 ‐2 012 11 ‐05 ‐2 012 01 ‐06 ‐2 012 22 ‐06 ‐2 012 Cash Vehicle Housing Commercial
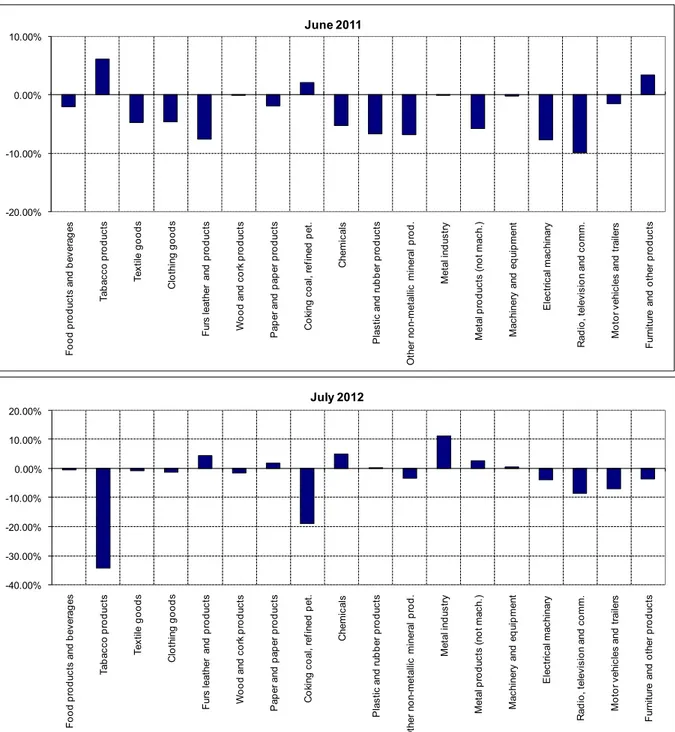
Figure 5: Monthly changes of manufacturing industry exports (sa)
Source: TurkStat. Betam
-40.00% -30.00% -20.00% -10.00% 0.00% 10.00% 20.00% F o o d pr odu ct s a nd be ve ra ge s Ta ba cc o pr odu ct s Te xt ile g oods C lot hi ng good s F ur s l eat her and p ro d uc ts W o o d a nd c o rk pr odu ct s P ape r a nd pa pe r pr odu ct s C o ki ng c o al , r ef ined p et . C hem ic al s P las tic and ru b b er p ro d uc ts O th er n o n-me ta llic min er al p ro d . M et al in d us tr y M et al pr odu ct s ( no t m ac h. ) M ac hi nery a nd eq ui p m en t E le ct ric al m ac hi nar y R adi o , t el ev is ion a nd c o m m . M o to r v ehi cl es and t rai le rs F ur ni tur e and o ther p ro d uc ts July 2012 -20.00% -10.00% 0.00% 10.00% F ood pr od uc ts a nd be ve ra g es Ta ba cc o pr odu ct s Te xt ile g oods C lot hi ng good s F ur s l eat her and p ro d uc ts W ood a nd c o rk pr odu ct s P ape r a nd pa pe r pr odu ct s C o ki ng c o al , r ef ined p et . C hem ic al s P las tic and ru b b er p ro d uc ts O th er n o n-me ta llic min er al p ro d . Me ta l in d us tr y M et al pr odu ct s ( not m ac h. ) M ac hi ner y an d eq ui p m ent E le ct ric al m ac hi nar y R ad io , te le vi si o n an d c o m m . M o to r v ehi cl es and t ra ile rs F ur ni tur e and o ther p ro d uc ts June 2011