1 Tables:
Table 1: Demographic features, clinical laboratory test results and the prevalence of conventional risk factors for ischemic stroke patients and controls in the study population.
Parameter Patients (n=239) Control (n=130) P OR (%95 CI) Age 65.6±13.5 64.2±12.2 0.067a Male, n (%) 133 (55.6) 63 (51.5) 0.186b 1.334 (0.870-2.048) Hypertension, n (%) 160 (66.9) 49 (37.7) 0.000b 3.35 (2.144-5.227) Diabetes mellitus, n (%) 77 (32.2) 20 (15.4) 0.000b 2.614(1.511-4.523) Smokers, n (%) 65 (27.2) 16 (12.3) 0.001b 2.662(1.467-4.829) Obesity, n (%) 53 (22.2) 8 (6.2) 0.000b 4.191(1928-9.113) Total cholesterol (mmol/L) 4.76 ±1.34 4.70±1.28 0.679c Triglycerides (mmol/L) 1.54 ±0.75 1.44±0.60 0.195c HDL-cholesterol (mmol/L) 1.08±0.31 1.20±0.31 0.001c LDL-cholesterol (mmol/L) 2.85±1.17 2.76±0.04 0.499c
For age, given values are median (quartiles) other values are either number of subjects, percentage, or mean ± SD
aMann-Whitney U test is applied bChi-square test is applied
2
Table 2: Distributions of genotypes and allele frequencies for single nucleotide polymorphisms, C419A (rs4925) of the GSTO1 gene and A424G (rs156697) of the GSTO2 gene.
Genotypes/Alleles Patients n=239, (%) Controls n=130, (%) OR (95%CI) P GSTO1 C419A CC 101 (42.3) 62 (47.7) 1.245a (0.811-1.914) 0.315 a CA 105 (43.9) 47 (36.2) AA 33 (13.8) 21 (16.1) C 0.642 0.658 1.071b (0.779-1.47) 0.675 b A 0.358 0.342 GSTO2 A424G AA 97 (40.6) 50 (38.5) 0.915c (0.591-1.146) 0.691 c AG 107 (44.8) 55 (42.3) GG 35 (14.6) 25 (19.2) A 0.630 0.596 0.868d (0.637-1.183) 0.370 d G 0.370 0.404
a CA+AA versus CC, b A versus C cAG+GG versus AA, dG versus A
Table 3: Distribution of the double combined haplotypes for C419A (rs4925) of the GSTO1 gene and A424G (rs156697) of the GSTO2 gene.
Combined haplotypes Patients n=239, (%) Controls n=130, (%) OR P CCAA 83 (34.7) 42 (32.3) 1.115 0.639 CCAG 18 (7.5) 20 (15.4) 0.448 0.017 CCGG 2 (0.8) 1 (0.8) 1.089 1 CAAA 13 (5.4) 6 (4.6) 1.189 0.732 CAAG 79 (33.1) 31 (23.8) 1.577 0.064 CAGG 12 (5.0) 9 (6.5) 0.710 0.451 AAAA 2 (0.8) 2 (1.5) 0.540 0.543 AAAG 9 (3.8) 4 (3.1) 1.232 0.732 AAGG 21 (8.8) 15 (11.5) 0.739 0.395
3
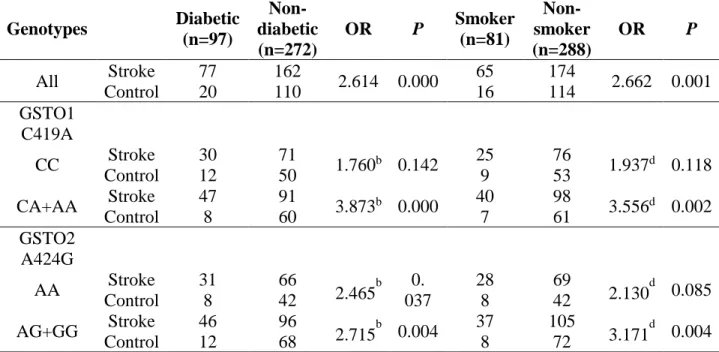
Table 4: Stratification of diabetic/non-diabetic and smoker/non-smoker groups according to different GSTO1 and GSTO2 genotypes and stroke-control status.
Genotypes Diabetic (n=97) Non-diabetic (n=272) OR P Smoker (n=81) Non-smoker (n=288) OR P All Stroke 77 162 2.614 0.000 65 174 2.662 0.001 Control 20 110 16 114 GSTO1 C419A CC Stroke 30 71 1.760b 0.142 25 76 1.937d 0.118 Control 12 50 9 53 CA+AA Stroke 47 91 3.873b 0.000 40 98 3.556d 0.002 Control 8 60 7 61 GSTO2 A424G AA Stroke 31 66 2.465b 0. 037 28 69 2.130d 0.085 Control 8 42 8 42 AG+GG Stroke 46 96 2.715b 0.004 37 105 3.171d 0.004 Control 12 68 8 72
b OR calculated against non diabetic, d OR calculated against non-smoker, e Fisher Exact Test is Applied
Table 5: Logistic regression analysis results of conventional risk factors, lipid parameters, and
GSTO1 and GSTO2 genotypes on ischemic stroke
Parameters OR 95%CI P
Hypertension 3.043 1.840-5.031 0.000
Smoking 3.258 1.658-6.500 0.001
Obesity 2.593 1.129-5.956 0.025
HDL-cholesterol 0.270 0.111-0.654 0.004
Table 6: Comparison of the wild-type and variant allele frequencies of the GSTO1 and GSTO2 genes in different populations of control groups.
Population Number of sample Wild allele (C) Variant allele (A) Reference
Turkish 130 0.658 0.342 This Study
Turkish 214 0.689 0.311 Ada et al. 2013
4 Taiwanese 251 0.817 0.183 Chung et al. 2011 764 0.834 0.166 Hsu et al. 2011 184 0.818 0.182 Chung et al. 2009 German 280 0.680 0.320 Kölsch et al. 2004
American 727 0.655 0.345 Ozturk et al. 2005
Serbian 130 0.637 0.363 Stamenkovic et al.
2013
Chinese 215 0.853 0.137 Fu et al. 2008
Italian 157 0.876 0.124 Capurso et al. 2010
Population Number of sample Wild allele (A) Variant allele (G) Reference
Turkish 130 0.596 0.404 This Study
Turkish 194 0.781 0.219 Takeshita et al. 2009
Taiwanese 251 0.741 0.259 Chung et al. 2011
764 0.753 0.247 Hsu et al. 2011
Brazil 222 0.626 0.374 Morari et al. 2006
American 732 0.695 0.305 Ozturk et al. 2005
Serbia 124 0.669 0.331 Stamenkovic et al. 2013
Japanese 369 0.726 0.274 Kiyohara et al. 2010
102 0.784 0.216 Takeshita et al. 2009
Thai 151 0.770 0.230 Chariyalertsak et al.
2009