Summary
Background Subclinical hypothyroidism (SH) occurs
when serum thyroid stimulating hormone (TSH) trations are raised and serum thyroid hormone concen-trations are normal. The effect of SH on the proinflam-matory adipose cytokine releasing visceral adipose tissue (VAT) is not clear. The aim of this study is to identify the difference between the pre and posttreatment levels of VAT, leptin, and resistin in SH patients.
Methods There were 51 SH patients and 43 age- and
gender-matched healthy subjects included in the study. Thyroid functions, biochemical tests, leptin, resistin, and visceral and subcutaneous fat measurements were made. The measurements were repeated in the SH group in the third month following L-thyroxin treatment.
Results Initially, high sensitivity C-reactive protein,
carotid artery intima-media thickness (mm), leptin, and resistin levels were significantly higher in the SH group compared to the controls, while the other parameters were similar. While no correlation was observed between
TSH levels and adipokines, a positive correlation was detected between waist circumference and leptin lev-els (r = 0.549, p < 0.01). Visceral adipose tissue was posi-tively correlated to age, waist circumference, and leptin levels, but negatively correlated to free thyroxin (T4) levels (r = 0.419, p = 0.009; r = 0.794, p < 0.01; r = 0.515,
p < 0.01 and r = − 0.416, p = 0.009, respectively). A
signifi-cant decrease was observed in VAT volume, leptin, and resistin levels of SH patients following levothyroxine treatment.
Conclusion The reduced VAT volume, leptin, and
resistin levels in SH patients following treatment may support the idea that TSH affects adipose tissue functions.
Keywords Subclinical hypothyroidism · Visceral
adi-pose tissue · Thyroid stimulating hormone · Leptin · Resistin
G. Akbaba, MD ()
Department of Internal Medicine, Endocrinology and Metabolism, Mugla Sıtkı Kocman University School of Medicine,
Mugla, Turkey
e-mail: [email protected]
Assoc. Prof. D. Berker, MD · Assoc. Prof. S. Isık, MD · M. M. Tuna, MD · Prof. S. Guler, MD
Clinics of Endocrinology and Diseases of Metabolism, Ankara Numune Education and Research Hospital, Ankara, Turkey e-mail: [email protected] Assoc. Prof. S. Isık, MD e-mail: [email protected] M. M. Tuna, MD e-mail: [email protected]
Received: 3 November 2014 / Accepted: 1 September 2015 / Published online: 22 September 2015 © Springer-Verlag Wien 2015
Wien Klin Wochenschr (2016) 128:579–585 DOI 10.1007/s00508-015-0865-9
Changes in the before and after thyroxine treatment
levels of adipose tissue, leptin, and resistin
in subclinical hypothyroid patients
Gulhan Akbaba · Dilek Berker · Serhat Isık · Mazhar Muslum Tuna · Suha Koparal · Murat Vural · Fatma Meric Yılmaz ·
Canan Topcuoglu · Serdar Guler
S. Koparal, MD · M. Vural, MD
Clinics of Radiology, Ankara Numune Education and Research Hospital,
Ankara, Turkey
Assoc. Prof. F. M. Yılmaz, MD · C. Topcuoglu, MD Clinics of Biochemistry,
Ankara Numune Education and Research Hospital, Ankara, Turkey
Prof. S. Guler, MD
Faculty of Medicine, Department of Endocrinology and Diseases of Metabolism, Hitit University,
Corum, Turkey
Introduction
Abdominal obesity is an independent risk factor for the development of cardiovascular diseases (CVD). It is associated with an increased volume of visceral adipose tissue (VAT) [1]. VAT is the predominant adipose tissue compartment that produces various proinflammatory cytokines and adipokines [2]. Increased VAT is strongly related to metabolic complications such as dyslipid-emia, hypertension, and insulin resistance [3]. Visceral fat thickness can be evaluated accurately with com-puted tomography (CT) and magnetic resonance imag-ing (MRI). Both techniques have some limitations, like radiation exposure for CT and cost-effectiveness for MRI. Abdominal ultrasound (US) is an accurate, noninvasive, and cost-effective method for VF evaluation. When com-pared with the CT, it has been found that visceral fat vol-ume measured by US has similar accuracy [4].
Subclinical hypothyroidism (SH) occurs when serum thyroid stimulating hormone (TSH) concentrations are raised while serum thyroid hormone concentrations are normal [5]. Several publications have demonstrated a positive correlation between SH and CVD [6, 7]. One study has shown that even small increases in serum TSH con-centrations within normal reference ranges may be asso-ciated with increased weight [8], as thyroid hormones, leptin, and resistin are involved in energy metabolism and weight changes. While a majority of studies report normal leptin levels among hypothyroid patients [9–12], there are studies reporting low [13–16] or high [17–19] lev-els of leptin as well. Similarly, low [10, 13], normal [20], and high [18] resistin levels have been reported in hypo-thyroid cases. Resistin levels among these patients did not change with treatment for hypothyroidism [13, 20].
One study demonstrated that, among patients with known vascular disorders, high TSH levels within nor-mal TSH ranges are associated with increased VAT [21]. Another study reported that epicardial adipose tissue (EAT) is increased among SH patients [22]. Another study analyzed fatty tissue changes after treatment in SH patients and evaluated fatty tissues throughout the entire body [23]. Therefore, we aimed to identify the changes in VAT, as it is the predominant adipose tissue compart-ment that produces various proinflammatory cytokines and adipokines, leptin, and resistin, with treatment com-pared to pretreatment levels in SH patients.
Methods and materials Study population
Fifty-one patients who presented at the Endocrinology Clinic of Ankara Numune Training and Research Hospi-tal and received SH diagnosis were included in the study. TSH measurements were conducted at the same time of day, in the morning, and blood was drawn sequentially on two different days. The etiology of hypothyroidism was autoimmune thyroiditis in 90.1 % of the patients.
None of them had any known or suspected cardiovas-cular disease, based on their clinical histories and lab-oratory evaluations, such as electrocardiography and echocardiography, nor had any taken any thyroid medi-cations. A total of 43 age- and gender-matched healthy subjects with no thyroid dysfunctions were enrolled. The institutional Ethics Committee approved the study, and informed consent was obtained from all subjects enrolled. Body mass index (BMI) was calculated by dividing subjects’ weight in kilograms by the square of their height in meters. Treatment with L-thyroxine was started in patients with dyslipidemia, obesity, planned pregnancy, goiter, or hypothyroidism. L-thyroxine of 25–50 µg/day was started, and the dose was adjusted by monthly TSH controls. Euthyroidism was provided with an average dose of 50–75 µg of L-thyroxine. Our study was designed prospectively. Measurements were repeated in the SH group 3 months after achieving euthyroid levels.
Biochemical analyses
Thyroid function tests: the Abbott Architect 2000 device and chemiluminescence micro-particle immunoassay approach were used to detect free triiodothyronine (fT3), freeT4 (fT4), and TSH concentrations. Patients with TSH levels between 4.0–10 mIU/mL with normal fT4 values are accepted to have SH [24].
Serum lipids: Serum lipids are measured by enzymatic calorimetric method. Low-density lipoprotein-choles-terol (LDL-C) is calculated with the Friedwald formula.
Plasma glucose and insulin: Plasma glucose is mea-sured with a spectrometric analyzer using the glucose oxidase method, and insulin levels are measured with immunoradiometric assay (Immunotech IRMA, Czech Republic) (intra-assay coefficient of variation (CV) 4.3 %, inter-assay CV 3.4 %). Insulin sensitivity upon homeosta-sis model assessment (HOMA) is calculated as “fasting plasma glucose (mmol/l) × fasting plasma insulin]/22.5” [25].
High sensitivity C-reactive protein (hsCRP): HsCRP concentrations were determined using the Behring BN100 and the N hsCRP reagent (Dade-Behring, Missis-sauga, Ontario, Canada).
Leptin and resistin levels: Venous blood samples were collected in vacutainer tubes and centrifuged at 1300 g for 10 min. Sera were separated and stored at − 20 °C until analysis. Human leptin and resistin levels were deter-mined quantitatively by enzyme-linked immunosorbent assay (ELISA) with an ELISA microplate strip washer (ELX50; BioTek Instruments, USA) and ELISA microplate reader (Chromate; Awareness Technology, USA). Human resistin concentrations were determined with an eBio-science ELISA kit (Bender MedSystems GmbH; Austria). Intra- and inter-assay precisions were 5.1 and 8.1 % for resistin, respectively. Leptin concentrations were mea-sured with a DRG ELISA kit (DRG Instruments GmbH, Germany). The range of the assay was 1.0–100 ng/mL.
nificance of differences between groups in the frequency distribution of categorical variables, unless the expected cell size was less than five when Fisher’s exact test was used. Medians were compared by using the Mann–Whit-ney U test when the number of independent groups was two. Differences between the medians of more than two groups were evaluated by using the Kruskal–Wallis test. To evaluate the correlation between the parameters, we used the Spearman correlation. Multivariate logistic regression analyses were performed in order to evalu-ate whether factors that are considered to be effective on visceral adipose tissue were statistically significant or not. A p-value less than 0.05 was considered statistically significant.
Results
Clinical and laboratory characteristics of the study pop-ulation are presented in Table 1. In all, 51 patients were diagnosed with SH. Their mean age was 36.9 ± 10.6 years, and most of the subjects were female. The mean age of the control subjects was 34.9 ± 8.4 years, and the gender distribution was similar to that of the SH group. While TSH (p < 0.01), hsCRP (p = 0.011), carotid artery IMT (mm) (p < 0.01), leptin (p < 0.01), and resistin (p < 0.01) levels were significantly higher in the SH group com-pared to the control group, fT4 (p < 0.01) levels were sig-nificantly lower. No significant correlation was observed between pre-treatment TSH and the VAT volume (r = 0.292, p = 0.76), hsCRP (r = 0.110, p = 0.511), leptin (r = 0.207, p = 0.213), and resistin (r = 0.105, p = 0.530) lev-els. While VAT was positively correlated to age (r = 0.419,
p < 0.01), waist circumference (r = 0.794, p < 0.01),
anti-thyroid peroxidase (antiTPO) (r = 0.435, p < 0.01), and leptin (r = 0.515, p < 0.01) levels, there was a negative cor-relation between VAT and fT4 (r = − 0.416, p < 0.01). No correlation was determined between VAT and resistin (r = 0.004, p = 0.980) (Table 2). Age was observed to have a positive correlation with waist circumference and leptin (r = 0.345, p = 0.034; r = 0.549, p < 0.01, respectively), but it did not have a significant correlation with resistin.
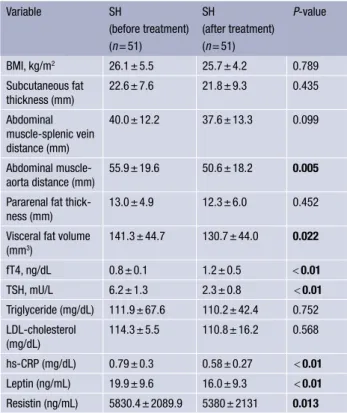
No changes were observed in the subcutaneous fat tissue of the SH patients following L-thyroxin treat-ment compared to pre-treattreat-ment values, though a sig-nificant decrease was observed in VAT (141.3 ± 44.7 vs. 130.7 ± 44.0 mm3, p = 0.022) (Table 3). While this decrease
occurred in abdominal muscle-aorta distance fat distri-bution (p < 0.01), no significant change was observed in the abdominal muscle-splenic vein distance (p = 0.09) or the pararenal fat distribution (p = 0.452). HsCRP (p < 0.01), leptin (p < 0.01), and resistin (p = 0.013) levels in SH patients significantly improved after the treatment. When analyzed after treatment, TSH was not cor-related with VAT volume (r = − 0.351, p = 0.140), resistin (r = 0.221, p = 0.182), or leptin (r = 0.103, p = 0.537) levels. No correlation was observed between VAT volume and resistin (r = 0.138, p = 0.409), while VAT was correlated positively to leptin (r = 0.365, p = 0.024) and anti-TPO Mean intra- and inter-assay precisions were 6.43 and
10 %, respectively.
Measurements of visceral and subcutaneous fat
Ultrasonography (Toshiba Aplio Ultrasound Imaging System, Japan) was performed independent of a fasting state, and visceral fat was measured at the end of a nor-mal exhalation in the supine position. For each patient, a total of four measurements were obtained as follows: (i) the distance between the internal surface of the splenic vein and the abdominal muscle, (ii) thickness of the fat layer of the posterior right renal wall in the right posterior perinephric space, (iii) distance between the internal surface of the abdominal muscle and the pos-terior wall of the aorta on the umbilicus, (iv) the thick-ness of preperitoneal and subcutaneous fat layers in the xiphoid process [4]. The visceral fat volume was calcu-lated by using the following equation: “[visceral fat vol-ume] = [− 9.008] + [1.191 × distance between the internal surface of the abdominal muscle and the splenic vein (mm)] + [0.987 × distance between the internal surface of the abdominal muscle and the posterior wall of the aorta on the umbilicus (mm)] + [3.644 × thickness of the fat layer of the posterior right renal wall (mm)]”[4]. A 3.75-MHz convex-array probe was used to measure each parameter except the thickness of both the subcutane-ous and the preperitoneal fat layers, which was measured using a 7.5-MHz linear-array probe by performing a lon-gitudinal scan. The procedures were performed by two radiologists with similar levels of experience.
Measurement of carotid artery intima-media thickness
All SH patients and control subjects received one mea-surement of the intima-media thickness (IMT) of the carotid arteries. This was measured by ultrasound in the supine position and by the same experienced investiga-tor. High-resolution B-mode ultrasound images (Loqic 3, General Electric, USA) with an 11-MHz linear array transducer were obtained for IMT measurement. Three arterial wall segments in each carotid artery were imaged from a fixed lateral transducer angle at the far wall. The mean IMT over the three segments of both carotid arter-ies was calculated and designated as the mean IMT.
Statistical analyses
Analyses of the data were performed using Statistical Package for Social Sciences (SPSS) for Windows 20 soft-ware (Chicago, IL). Definitive statistics were expressed as mean ± standard deviation or median (minimum–maxi-mum) for continuous variables, and they were shown as the number of cases and percent for categorical variables. Chi-square tests were used to assess the statistical
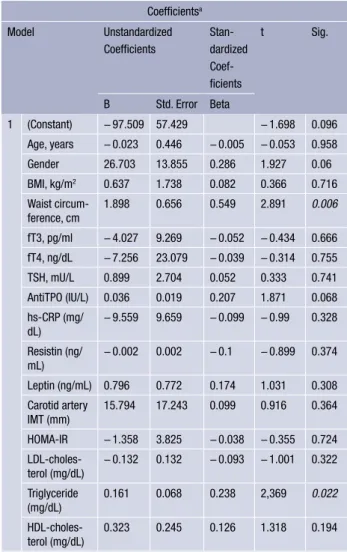
sig-ume was assessed, waist circumference and triglycerides were found to be statistically significant (Table 4).
Discussion
This study found that the carotid artery IMT, hsCRP, leptin, and resistin levels were significantly higher in SH patients with no cardiovascular disease than in the con-trol group. Though VAT volume was also higher than the control group, the difference was not statistically signifi-cant. However, we demonstrated that the VAT volume, hsCRP, leptin, and resistin levels significantly decrease after euthyroidism was achieved in the SH group. This is the first study, to our knowledge, that investigates the VAT change in SH patients after euthyroidism is achieved.
Abdominal obesity is known to increase VAT [1]. In line with this finding, we detected a positive correlation between VAT and waist circumference. SH was associ-ated with increased coronary heart disease (CHD) preva-lence [26, 27] and all-cause mortality independent of CHD risk factors [27]. Even though studies have revealed an association between SH and CHD and its related com-plications, the underlying pathological mechanisms are not well understood. Furthermore, there is a relationship between visceral adipose tissue and TSH levels. Abdomi-nal adipose tissue is metabolically active by producing (r = 0.451, p = 0.004), and negatively correlated to fT4
(r = − 0.351, p = 0.03).
In regression analyses, when the effect of baseline clinical and laboratory characteristics on visceral fat
vol-Table 1 Clinical and laboratory characteristics of the study population
Patients (n = 51) Control (n = 43) P-value Age, years 36.9 ± 10.6 34.9 ± 8.4 0.427 Male/female 10/41 11/32 0.076 BMI, kg/m2 26.1 ± 5.5 25.7 ± 4.2 0.715 Smoking (%) 29.4 20.9 0.477 HOMA-IR 1.81 ± 1.34 1.47 ± 0.88 0.224 Triglyceride (mg/dL) 111.9 ± 67.6 136.7 ± 42.0 0.07 HDL-cholesterol (mg/dL) 46.9 ± 14.9 49.1 ± 17.0 0.501 LDL- cholesterol (mg/dL) 114.3 ± 5.5 120.9 ± 48 0.366 fT4, ng/dL 0.8 ± 0.1 1.02 ± 0.2 < 0.01 TSH, mU/L 6.2 ± 1.3 1.9 ± 0.8 < 0.01 hs-CRP (mg/dL) 0.79 ± 0.3 0.49 ± 0.47 0.011
Carotid artery IMT (mm)
0.74 ± 0.3 0.47 ± 0.5 < 0.01
Subcutaneous fat
thickness (mm) 22.6 ± 7.6 24.9 ± 8.2 0.258 Abdominal
muscle-splenic vein distance (mm)
40.0 ± 12.2 40.5 ± 7.3 0.313
Abdominal
muscle-aorta distance (mm) 55.9 ± 19.6 48.1 ± 15.5 0.086 Para-renal fat
thick-ness (mm) 13.0 ± 4.9 10.7 ± 5.0 0,07
Visceral fat volume (mm3)
141.3 ± 44.7 125.8 ± 36.9 0.139
Leptin (ng/mL) 19.9 ± 9.6 10.5 ± 4.9 < 0.01 Resistin (ng/mL) 5830.4 ± 2089.9 4072.1 ± 1523.2 < 0.01 Variables are expressed as mean ± standard deviation
BMI body mass index, HOMA-IR homeostatic model of assessment-insulin resistance, HDL high-density lipoprotein, LDL low-density lipoprotein, T4 thyroxin, TSH thyroid stimulation hormone, hs-CRP high-sensitivity C-reactive protein, IMT intima-media thickness (A p-value less than 0.05 was considered statistically significant).
Table 2 Baseline visceral adipose tissue correlation table (n = 94)
Variables Visceral adipose tissue, mm3
r p Age, years 0.419 < 0.01 Waist circumference, cm 0.794 < 0.01 TSH, mU/L 0.292 0.760 fT4, ng/dL − 0.416 < 0.01 AntiTPO (IU/L) 0.435 < 0.01 Leptin (ng/mL) 0.515 < 0.01 Resistin (ng/mL) 0.004 0.980
TSH thyroid stimulating hormone, T4 thyroxin, TPO thyroid peroxidase (A p-value less than 0.05 was considered statistically significant).
Table 3 Changes in adiposity markers and levels of adipo-kinine and lipid before and after treatment in the subclinical hypothyroid (SH) group Variable SH (before treatment) (n = 51) SH (after treatment) (n = 51) P-value BMI, kg/m2 26.1 ± 5.5 25.7 ± 4.2 0.789 Subcutaneous fat thickness (mm) 22.6 ± 7.6 21.8 ± 9.3 0.435 Abdominal muscle-splenic vein distance (mm) 40.0 ± 12.2 37.6 ± 13.3 0.099 Abdominal muscle-aorta distance (mm) 55.9 ± 19.6 50.6 ± 18.2 0.005 Pararenal fat
thick-ness (mm) 13.0 ± 4.9 12.3 ± 6.0 0.452
Visceral fat volume (mm3) 141.3 ± 44.7 130.7 ± 44.0 0.022 fT4, ng/dL 0.8 ± 0.1 1.2 ± 0.5 < 0.01 TSH, mU/L 6.2 ± 1.3 2.3 ± 0.8 < 0.01 Triglyceride (mg/dL) 111.9 ± 67.6 110.2 ± 42.4 0.752 LDL-cholesterol (mg/dL) 114.3 ± 5.5 110.8 ± 16.2 0.568 hs-CRP (mg/dL) 0.79 ± 0.3 0.58 ± 0.27 < 0.01 Leptin (ng/mL) 19.9 ± 9.6 16.0 ± 9.3 < 0.01 Resistin (ng/mL) 5830.4 ± 2089.9 5380 ± 2131 0.013
Variables are expressed as mean ± standard deviation
BMI body mass index, T4 thyroxin, TSH throid stimulation hormone, LDL low-density lipoprotein, hs-CRP high-sensitivity C-reactive protein (A p-value less than 0.05 was considered statistically significant)
to observe a significant difference in VAT volume across patient and control groups, or a correlation between TSH and VAT. Similarly, Westerink et al. [21] have also failed to demonstrate a significant association between TSH and VAT among patients who were under 66 years of age.
While studies have reported that low fT4 levels were associated with coronary atherosclerosis [33] and that low fT4 levels were associated with increased pericardial fat tissue and VAT even in euthyroid patients, no association was observed between TSH and fat tissue compartments [34]. In this study, we have also failed to demonstrate an association between pre and posttreatment TSH and VAT, but determined a negative correlation between fT4 and VAT. This result suggests that low fT4 levels may increase VAT even when it is in normal reference ranges and leads to an increase in inflammation due to the increase in adi-pose tissue. Moreover, we also believe that autoimmunity may be responsible for the changes in the adipocyte func-tions observed in SH, as we detected a positive correlation between anti-TPO and VAT.
A recent meta-analysis (based on the Cochrane methodology) including 12 randomized, controlled tri-als of 6–14 months of duration showed that significant decreases in LDL-C levels were noticed only in the sub-group of patients with LDL-C values > 155 mg/dl after L-thyroxine treatment [35]. As compared with those indi-viduals with normal or near-normal lipid profiles, those with high lipid levels may have a greater lowering effect on their lipid levels with thyroid hormone treatment. We did not find a significant change in the lipid values of SH patients after treatment; their lipid values were similar to those of the control group. Increased values of carotid artery IMT have been reported in patients with SH com-pared with euthyroid individuals [36], though there is evidence suggesting a beneficial effect of levothyroxine replacement therapy on carotid artery IMT in subjects with SH [37, 38]. In this study BMI, smoking habits, and lipid profiles of the SH group were similar to those in the control group; carotid artery IMT and VAT volume, early indicators of atherosclerosis, were higher in the SH group than in the control group, but the difference was statisti-cally significant for IMT only. After 3 months of euthyroid-ism was achieved, a significant decrease was observed in the VAT volume. Since the follow-up period was relatively short, we did not evaluate the change in IMT.
While there are studies reporting increased hsCRP lev-els among SH patients [39, 40], some studies also reported similar hsCRP levels as well [41–43]. In this study, we determined that hsCRP levels in the SH group were nificantly higher than in the control group, and that sig-nificantly decreased after euthyroidism was achieved.
Prior studies reported normal, decreased, and increased leptin levels in hypothyroid patients [13]. There are also studies reporting L-thyroxin treatment to have caused increased [11, 44], not changed [45, 46], or low-ered [17, 19, 23] leptin levels. We observed a significant decrease in leptin levels after euthyroidism was achieved. Study by Yildiz BO et al. demonstrated a decrease in leptin levels without a change in fat mass after euthyroid-various adipokines and inflammatory cytokines involved
in atherogenesis, atherothrombosis, and arterial plaque rupture [2, 28, 29]. Adipocytes express TSH receptors, and VAT proliferation can take place based on TSH expres-sion in visceral and adipose tissue [30]. TSH may also be capable of increasing adipogenesis in embryonic stem cells [31]. A study has demonstrated that, even within the normal range, increase in TSH in women with no known history of CVD increased fatal coronary incidences [32]. Another study reported that increased TSH levels within the normal range increased visceral adipose thickness among patients over 66 years of age who have a history of vascular diseases [21]. In light of these studies, it can be said that TSH levels can increase in older age popula-tions, which in turn increases the risk of CVD. A positive correlation was detected between age and VAT in this study. Because the mean age of the subclinical hypothy-roid patients in this study are younger, we may have failed
Table 4 Effect of baseline clinical and laboratory character-istics on visceral fat volume (n = 94)
Coefficientsa Model Unstandardized Coefficients Stan-dardized Coef-ficients t Sig. B Std. Error Beta 1 (Constant) − 97.509 57.429 − 1.698 0.096 Age, years − 0.023 0.446 − 0.005 − 0.053 0.958 Gender 26.703 13.855 0.286 1.927 0.06 BMI, kg/m2 0.637 1.738 0.082 0.366 0.716 Waist circum-ference, cm 1.898 0.656 0.549 2.891 0.006 fT3, pg/ml − 4.027 9.269 − 0.052 − 0.434 0.666 fT4, ng/dL − 7.256 23.079 − 0.039 − 0.314 0.755 TSH, mU/L 0.899 2.704 0.052 0.333 0.741 AntiTPO (IU/L) 0.036 0.019 0.207 1.871 0.068 hs-CRP (mg/ dL) − 9.559 9.659 − 0.099 − 0.99 0.328 Resistin (ng/ mL) − 0.002 0.002 − 0.1 − 0.899 0.374 Leptin (ng/mL) 0.796 0.772 0.174 1.031 0.308 Carotid artery IMT (mm) 15.794 17.243 0.099 0.916 0.364 HOMA-IR − 1.358 3.825 − 0.038 − 0.355 0.724 LDL-choles-terol (mg/dL) − 0.132 0.132 − 0.093 − 1.001 0.322 Triglyceride (mg/dL) 0.161 0.068 0.238 2,369 0.022 HDL-choles-terol (mg/dL) 0.323 0.245 0.126 1.318 0.194 BMI body mass index, T3 triiodothyronine, T4 thyroxin, TSH thyroid stimula-tion hormone, TPO thyroid peroxidase, hs-CRP high-sensitivity C-reactive protein, IMT intima-media thickness, HOMA-IR homeostatic model of assessment-insulin resistance, LDL low-density lipoprotein, HDL high-density lipoprotein (A p-value less than 0.05 was considered statistically significant)
degree and duration of thyroid dysfunction, antibody concentrations, the metabolic effects of other hormones, and the possible effects of intermediate metabolism.
This study was designed prospectively, so that we could investigate the changes in VAT and adipokinine within the same patients who achieved euthyroidism following L-thyroxin treatment after an SH diagnosis. However, the small number of patients and the short fol-low-up period after achieving euthyroidism may not be sufficient to fully observe the changes in VAT.
Conflicts of interest
The authors have nothing to disclose.
References
1. Zamboni M, Armellini F, Turcato E, et al. Effect of regain of body weight on regional body fat distribution: comparison between pre- and postmenopausal obese women. Obes Res. 1996;4:555–60.
2. Fain JN, Madan AK, Hiler ML, Cheema P, Bahouth SW. Comparison of the release of adipokines by adipose tis-sue, adipose tissue matrix, and adipocytes from visceral and subcutaneous abdominal adipose tissues of obese humans. Endocrinology. 2004;145:2273–82.
3. Yusuf S, Hawken S, Ounpuu S, et al. Obesity and the risk of myocardial infarction in 27,000 participants from 52 coun-tries: a case-control study. Lancet. 2005;366:1640–9. 4. Hirooka M, Kumagi T, Kurose K, et al. A technique for the
measurement of visceral fat by ultrasonography: compari-son of measurements by ultracompari-sonography and computed tomography. Intern Med. 2005;44:794–9.
5. Cooper DS, Biondi B. Subclinical thyroid disease. Lancet. 2012;379:1142–54.
6. Rodondi N, Bauer DC, Cappola AR, et al. Subclinical thy-roid dysfunction, cardiac function, and the risk of heart failure. The Cardiovascular Health study. J Am Coll Cardiol. 2008;52:1152–9.
7. Rodondi N, den Elzen WP, Bauer DC, Thyroid Stud-ies Collaboration, et al. Subclinical hypothyroidism and the risk of coronary heart disease and mortality. JAMA. 2010;304:1365–74.
8. Fox CS, Pencina MJ, D’Agostino RB, et al. Relations of thy-roid function to body weight: cross-sectional and longi-tudinal observations in a community-based sample. Arch Intern Med. 2008;168:587–92.
9. Hsieh CJ, Wang PW, Wang ST, et al. Serum leptin concentra-tions of patients with sequential thyroid function changes. Clin Endocrinol (Oxf). 2002;57:29–34.
10. Yaturu S, Prado S, Grimes SR. Changes in adipocyte hor-mones leptin, resistin, and adiponectin in thyroid dysfunc-tion. J Cell Biochem. 2004;93:491–6.
11. Corbetta S, Englaro P, Giambona S, Persani L, Blum WF, Beck-Peccoz P. Lack of effects of circulating thyroid hor-mone levels on serum leptin concentrations. Eur J Endo-crinol. 1997;137:659–63.
12. Sreenan S, Caro JF, Refetoff S. Thyroid dysfunction is not associated with alterations in serum leptin levels. Thyroid 1997;7:407–9.
13. Iglesias P, Alvarez FP, Codoceo R, Diez JJ. Serum concen-trations of adipocytokines in patients with hyperthyroid-ism and hypothyroidhyperthyroid-ism before and after control of thyroid function. Clin Endocrinol (Oxf). 2003;59:621–9.
ism was achieved [23], but the fat mass was evaluated via Tanita scales; subcutaneous and adipose tissue were not measured separately in this study, which makes it likely that a failure to detect a decrease in the fat mass may be due to measurement methods. In our study, we sepa-rately examined the fat tissue and the VAT, which is the predominant adipose tissue compartment that produces various proinflammatory cytokines and adipokines, and observed that leptin levels, along with VAT, significantly decreased after treatment, while no change occurred in subcutaneous fat tissue. We identified a positive corre-lation between pre and posttreatment leptin and VAT volume. The posttreatment decrease in leptin levels is suggestive of a possible leptin resistance in SH patients. Leptin sensitivity may increase with the decrease in VAT volume.
Although resistin was first postulated to contribute to insulin resistance, it has recently been shown that resis-tin can trigger a proinflammatory state in vitro as well as in vivo [47]. Resistin’s role in the inflammatory process is defined completely, but resistin has some features of the proinflammatory cytokines and plays a role in inflam-mation and immunity regulation irrespective of its role in insulin resistance [41, 48]. There are studies report-ing increased [18], decreased [10, 13], and similar [20, 41] resistin levels in hypothyroid patients, compared to euthyroid individuals. In the present study, it was observed that resistin levels were higher in the SH group than in the control group without insulin resistance, and they significantly decreased following treatment. We did not detect a correlation between pre and posttreatment VAT and resistin. The changes in energy metabolism, even in SH status, may affect adipokine levels. The thy-rotropin-releasing hormone (TRH)-TSH pathway affects fat metabolism through a complex interaction between hypothalamus, pituitary, thyroid, and adipose tissues [49]. Our results suggest that inflammation and related hsCRP and resistin levels increase in the case of SH; after euthyroidism is achieved, inflammation and related hsCRP and resistin levels decrease.
Limitations of the study
The duration of subclinical hypothyroidism can have an effect on both VAT and adipocytokine levels. One of the limitations of our study was the lack of knowledge of the patients’ duration of subclinical hypothyroidism. In addition, the short follow-up time after achieving euthy-roid levels may have restricted our ability to assess sub-jects’ VAT and adipocytokine levels.
Conclusion
The conflicting results related to the relationship between the thyroid and adipocytokine noted in several studies may be related to gender and patient characteristics, the
31. Lu M, Lin RY. TSH stimulates adipogenesis in mouse embryonic stem cells. J Endocrinol. 2008;196:159–69. 32. Asvold BO, Bjoro T, Nilsen TI, Gunnell D, Vatten LJ.
Thy-rotropin levels and risk of fatal coronary heart disease: the HUNT study. Arch Intern Med. 2008;168:855–60.
33. Bruckert E, Giral P, Chadarevian R, Turpin G. Low free-thy-roxine levels are a risk factor for subclinical atherosclerosis in euthyroid hyperlipidemic patients. J Cardiovasc Risk. 1999;6:327–31.
34. Moon MK, Hong ES, Lim JA, et al. Associations between thyroid hormone levels and regional fat accumulation in euthyroid men. Eur J Endocrinol. 2013;168:805–10. 35. Villar HC, Saconato H, Valente O, Atallah AN. Thyroid
hormone replacement for subclinical hypothyroidism. Cochrane Database Syst Rev. 2007;3:CD003419.
36. Gunes F, Asik M, Temiz A, et al. Serum H-FABP levels in patients with hypothyroidism. Wien Klin Wochenschr. 2014;126:727–33.
37. Monzani F, Caraccio N, Kozakowa M, et al. Effect of levo-thyroxine replacement on lipid profile and intima-media thickness in subclinical hypothyroidism: a double-blind, placebo-controlled study. J Clin Endocrinol Metab. 2004;89:2099–106.
38. Ghasemi M, Mousavi SA, Rezvanian H, Asadi B, Khorvash F, Fatehi F. Carotid intima-media thickness in subclinical hypothyroidism. Int J Stroke. 2010;5:131–2.
39. Tuzcu A, Bahceci M, Gokalp D, Tuzun Y, Gunes K. Subclini-cal hypothyroidism may be associated with elevated high-sensitive c-reactive protein (low grade inflammation) and fasting hyperinsulinemia. Endocr J. 2005;52:89–94. 40. Ozcan O, Cakir E, Yaman H, Akgul EO, Erturk K, Beyhan Z.
The effects of thyroxine replacement on the levels of serum asymmetric dimethylarginine (ADMA) and other biochem-ical cardiovascular risk markers in patients with subclinbiochem-ical hypothyroidism. Clin Endocrinol (Oxf). 2005;63:203–6. 41. Aksoy DY, Cinar N, Harmanci A, et al. Serum resistin and
high sensitive CRP levels in patients with subclinical hypo-thyroidism before and after L-thyroxine therapy. Med Sci Monit. 2013;19:210–5.
42. Peleg RK, Efrati S, Benbassat C, Fygenzo M, Golik A. The effect of levothyroxine on arterial stiffness and lipid pro-file in patients with subclinical hypothyroidism. Thyroid. 2008;18:825–30.
43. Sharma R, Sharma TK, Kaushik GG, Sharma S, Vardey SK, Sinha M. Subclinical hypothyroidism and its association with cardiovascular risk factors. Clin Lab. 2011;57:719–24. 44. Iglesias P, Diez JJ. Influence of thyroid dysfunction on serum
concentrations of adipocytokines. Cytokine. 2007;40:61–70. 45. Ozata M, Ozisik G, Bingol N, Corakci A, Gundogan MA. The effects of thyroid status on plasma leptin levels in women. J Endocrinol Invest. 1998;21:337–41.
46. Sesmilo G, Casamitjana R, Halperin I, Gomis R, Vilardell E. Role of thyroid hormones on serum leptin levels. Eur J Endocrinol. 1998;139:428–30.
47. Bokarewa M, Nagaev I, Dahlberg L, Smith U, Tarkowski A. Resistin, an adipokine with potent proinflammatory prop-erties, J Immunol. 2005;174:5789–95.
48. Filkova M, Haluzik M, Gay S, Senolt L. The role of resistin as a regulator of inflammation: Implications for various human pathologies. Clin Immunol. 2009;133:157–70. 49. Kok P, Roelfsema F, Frolich M, Meinders AE, Pijl H.
Sponta-neous diurnal thyrotropin secretion is enhanced in propor-tion to circulating leptin in obese premenopausal women. J Clin Endocrinol Metab. 2005;90:6185–91.
14. Valcavi R, Zini M, Peino R, Casanueva FF, Dieguez C. Influ-ence of thyroid status on serum immunoreactive leptin lev-els. J Clin Endocrinol Metab. 1997;82:1632–4.
15. Yoshida T, Momotani N, Hayashi M, Monkawa T, Ito K, Saruta T. Serum leptin concentrations in patients with thy-roid disorders. Clin Endocrinol (Oxf). 1998;48:299–302. 16. Diekman MJ, Romijn JA, Endert E, Sauerwein H,
Wiers-inga WM. Thyroid hormones modulate serum leptin levels: observations in thyrotoxic and hypothyroid women. Thy-roid. 1998;8:1081–6.
17. Pinkney JH, Goodrick SJ, Katz J, et al. Leptin and the pitu-itary-thyroid axis: a comparative study in lean, obese, hypothyroid and hyperthyroid subjects. Clin Endocrinol (Oxf). 1998;49:583–8.
18. Botella-Carretero JI, Alvarez-Blasco F, Sancho J, Escobar-Morreale HF. Effects of thyroid hormones on serum levels of adipokines as studied in patients with differentiated thyroid carcinoma during thyroxine withdrawal. Thyroid. 2006;16:397–402.
19. Oge A, Bayraktar F, Saygili F, Guney E, Demir S. TSH influ-ences serum leptin levels independent of thyroid hor-mones in hypothyroid and hyperthyroid patients. Endocr J. 2005;52:213–7.
20. Krassas GE, Pontikides N, Loustis K, Koliakos G, Constan-tinidis T, Kaltsas T. Resistin levels are normal in hypo-thyroidism and remain unchanged after attainment of euthyroidism: relationship with insulin levels and anthro-pometric parameters. J Endocrinol Invest. 2006;29:606–12. 21. Westerink J, van der Graaf Y, Faber DR, Visseren FL; SMART
study group. The relation between thyroid-stimulating hor-mone and measures of adiposity in patients with manifest vascular disease. Eur J Clin Invest. 2011;41:159–66. 22. Korkmaz L, Sahin S, Akyuz AR, et al. Epicardial adipose
tis-sue increased in patients with newly diagnosed subclinical hypothyroidism. Med Princ Pract. 2013;22:42–6.
23. Yildiz BO, Aksoy DY, Harmanci A, et al. Effects of L-thyrox-ine therapy on circulating leptin and adiponectin levels in subclinical hypothyroidism: a prospective study. Arch Med Res. 2013;44:317–20.
24. Pearce SH, Brabant G, Duntas LH, et al. ETA Guideline: management of subclinical hypothyroidism. Eur Thyroid J. 2013;2:215–28.
25. Matthews DR, Hosker JP, Rudenski AS, et al. Homeostasis model assessment: insulin resistance and beta-cell func-tion from fasting plasma glucose and insulin concentra-tions in man. Diabetologia. 1985;28:412–9.
26. Cappola AR, Ladenson PW: Hypothyroidism and athero-sclerosis. J Clin Endocrinol Metab. 2003;88:2438–44. 27. McQuade C, Skugor M, Brennan DM, Hoar B, Stevenson
C, Hoogwerf BJ. Hypothyroidism and moderate subclini-cal hypothyroidism are associated with increased all-cause mortality independent of coronary heart disease risk fac-tors: a PreCIS database study. Thyroid. 2011;2:837–43. 28. Fain JN, Tagele BM, Cheema P, Madan AK, Tichansky DS.
Release of 12 adipokines by adipose tissue, nonfat cells, and fat cells from obese women. Obesity (Silver Spring). 2010;18:890–6.
29. Weiss TW, Arnesen H, Troseid M, et al. Adipose tis-sue expression of interleukin-18 mRNA is elevated in subjects with metabolic syndrome and independently associated with fasting glucose. Wien Klin Wochenschr. 2011;123:650–4.
30. Nannipieri M, Cecchetti F, Anselmino M, et al. Expression of thyrotropin and thyroid hormone receptors in adipose tissue of patients with morbid obesity and/or type 2 diabe-tes: effects of weight loss. Int J Obes (Lond). 2009;33:1001–6.