https://doi.org/10.1007/s11694-019-00166-9 ORIGINAL PAPER
Determination of biologically active phenolic compounds in propolis
by LC–MS/MS according to seasons and altitudes
Ali Sorucu1 · Hasan Hüseyin Oruç2
Received: 2 January 2019 / Accepted: 21 May 2019 / Published online: 29 May 2019 © Springer Science+Business Media, LLC, part of Springer Nature 2019
Abstract
The present study aimed to determine the effect of season and altitude to amount and prevalence of phenolic compounds in propolis. For the aim, 174 propolis samples were collected from 58 stationary apiaries from altitudes of 0–200 m, 200–500 m and above 500 m in spring, summer, and autumn distributed in the Marmara region of Turkey. Ethanol-extracted propolis samples were analyzed by LC–MS/MS to determine nine flavonoids and seven phenolic acids. Significant differences were found in average levels of galangin, naringenin, pinocembrin, quercetin, luteolin, caffeic acid, trans-cinnamic acid, p-cou-maric acid, m-coup-cou-maric acid, and CAPE across the seasons and altitudes (P < 0.05). However, no differences were found levels of rutin, apigenin, kaempferol, ferulic acid and gallic acid (P < 0.05). Most of the significant differences were found between spring and autumn (10 differences). The prevalence of flavonoids was generally lower than phenolic acids. CAPE and pinocembrin had majority of the significant differences in phenolic compounds according to season and altitude. The prevalence of pinocembrin 100%, m-coumaric acid 99.4%, CAPE 99.4%, naringenin 99.4%, caffeic acid 98.9%, p-coumaric acid 98.3%, quercetin 96% and luteolin 95.4% were determined that dominant phenolic compound of Marmara Region of Turkey’s propolis. Furthermore, Salix spp. 75.8%, Quercus spp. 74.4%, Populus spp. 72.4%, and Pinus spp. 53.5% were mainly determined source of propolis around the apiaries. These results show that different sampling of seasons and altitudes effect chemical composition of propolis even from the same area. The study indicated that seasons and altitudes are important factors for standardization of propolis.
Keywords Propolis · Standardization · Phenolic compounds · Season · Altitude · LC–MS/MS
Introduction
Propolis is an important natural product which is collected by honeybees from various plant’s resin and bud exudates [1]. Propolis is used by the honey bees as a building and protection material, for instance, filling holes and cracks,
repairing of honeycombs in the hive, narrowing the hive entrance against intruders and cold weather [2]. Raw prop-olis is generally composed of 50% resin, 30% wax, 10% essential oil and aromatic compounds, 5% pollen, 5% terpe-noids, steroids, amino acids and other compounds [3]. The chemical composition of propolis varies directly depend on the vegetation around apiaries [4]. Propolis has various bio-logical activities owing to chemical composition that has been used for centuries, especially in traditional medicine [3]. Most of its biological activities are related to the pres-ence of phenolic compounds in the resin [5–12].
Propolis standardization is important for global pricing and the determination of scientific effects but standardiza-tion of propolis could not be possible due to variables like regional vegetation, altitudes and seasons. Hence, it should require chemical analysis of different propolis constituents for determination of phenolic compounds [13–16]. Previous studies reported that seasonal variants could effect as a factor of different antioxidant, antibacterial and antitumor activities
Electronic supplementary material The online version of this article (https ://doi.org/10.1007/s1169 4-019-00166 -9) contains supplementary material, which is available to authorized users. * Ali Sorucu
1 Department of Veterinary Pharmacology and Toxicology,
Faculty of Milas Veterinary Medicine, Muğla Sıtkı Koçman University, Beçin neighborhood, University Street, No: 2, 48200 Milas, Muğla, Turkey
2 Department of Pharmacology and Toxicology, Faculty
of Veterinary Medicine, Uludag University, 16059 Nilufer, Bursa, Turkey
of propolis [17–27]. There are few numbers of reports proved effects of different altitude and season to chemical compositions and concentrations of propolis samples [22,
27, 28]. This study indicated influence both of seasons and altitudes on level, constituent, and prevalence of phenolic compounds in propolis. The objective of this study was to determine and quantitate the biologically active nine flavo-noids and seven phenolic acids from 174 propolis specimens collected across the stationary apiaries distributed at differ-ent altitudes in three differdiffer-ent seasons.
Materials and methods
Chemicals and reagents
Galangin (CAS-491-70-3) (CAS: Chemical Abstracts Ser-vice Number), quercetin hydrate (CAS: 849061-97-8), kaempferol (CAS: 520–18-3), gallic acid (CAS: 149–91-7) (±) naringenin (CAS: 67604-48-2), pinocembrin (CAS: 480-39-7), apigenin (CAS: 520-36-5), trans-cinnamic acid (CAS: 140-10-3), luteolin (CAS:491-70-3), p-coumaric acid (CAS: 501-98-4), m-coumaric acid (CAS: 14755-02-3), caffeic acid (CAS: 331-39-5), caffeic acid phenethyl ester (CAPE) (CAS: 104594-70-9), trans-ferulic acid (CAS: 537-98-4) and rutin (CAS: 250249-75-3) were purchased from Sigma-Aldrich® (Steinheim, Germany). HPLC grade ace-tonitrile, methanol, ethanol and analyzes quality formic acid were buy in Merck® (Darmstadt, Germany). Ultrapure water was obtained from ELGA® LabWater, Purelab flex.
Propolis samples
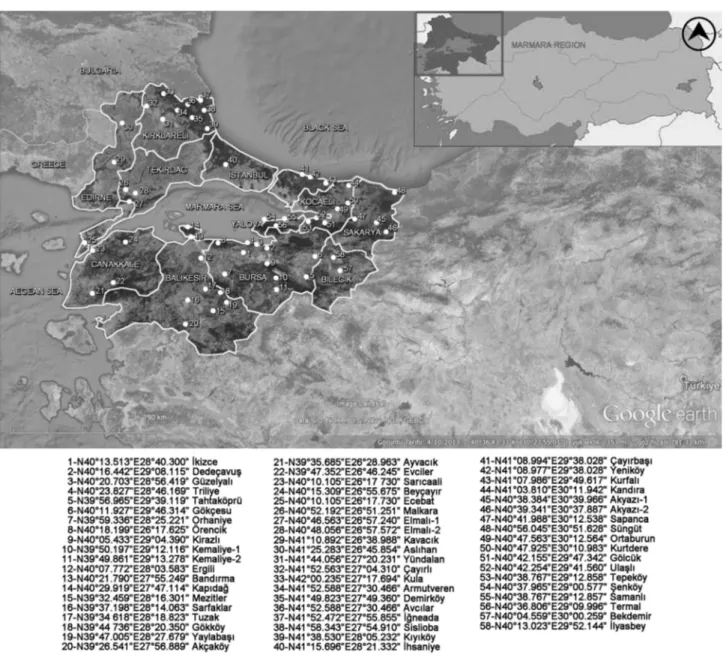
In the current study, 58 selected stationary apiaries located which 28 of them at 0–200 m altitudes, 17 of them between 200 and 500 m altitudes and 13 of them above 500 m alti-tudes. In total, 174 propolis samples were collected in spring (March, April, and May), summer (June, July, and August) and autumn (September, October, and November) from the apiaries in Marmara region of Turkey. Propolis specimens could not be collected during the winter season because of cold weather of sampling region. Coordinates of apiaries are shown in Fig. 1. Vegetation around apiaries was recorded in order to estimate the source of propolis (Supplementary Table 1). Seasonal propolis samples were collected by using plastic propolis traps shown in Supplementary Fig. 1 (Civan Incorporation, Turkey). The propolis samples were stored at + 4 °C until extraction procedure (Supplementary Fig. 2).
Extraction
The extraction method was carry out as defined by Erdogan et al. [29] and Trusheva et al. [30]. Propolis traps
were frozen at − 20 °C in order to remove the propolis from traps. Each sample was classified by color, odor, and amount. A grater was used to break the propolis sam-ples into small pieces and finally, a coffee bean grinder was used for homogenizing propolis (Delonghi Kg 49, UK). Two grams of the propolis were weighed and added to 20 mL 70% Ethanol/water (v/v), shook with using a shaker (Nüve SL-35, Turkey) for an hour, then followed by ultrasonication (Bandelin Sonorex RK100, Germany) for 30 min. The mixture was filtered using filter papers (Watman No: 1, UK) in order to remove wax and bee parts. Finally, the filtrate was poured into glass tubes (tared tube) and evaporated using a vacuum centrifuge (Jouan, RC 10-10) (Supplementary Fig. 3). The obtained dried propolis ethanoic extract (DPEE) was weighed and stored at − 20 °C until LC–MS/MS analyses (Supplementary Fig. 3).
Validation
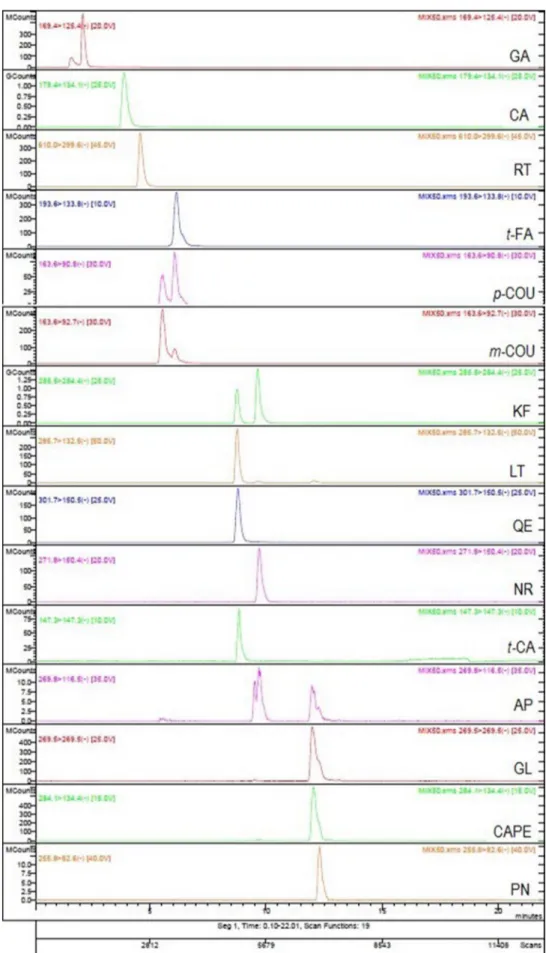
The main stock solution of each phenolic standard pre-pared as 1 mg/mL by dissolving in methanol (0.1 formic acid). In order to determine phenolic compound’s pre-cursor ion (MS), fragment ion (MS/MS), retention time, collision energy and capillary voltage that each phenolic compound was performed by injection to the LC–MS/MS. Mass spectrometry was performed using SIM under a neg-ative ion mode (Fig. 2). Mix phenolic compounds (MFC) solution was prepared from main stock solutions. MFC diluted with the methanol to prepare for 50, 25, 12.5, 6.75, 3.37 μg/mL concentration in order to draw calibration curves. Each phenolic compound’s calibration was curve plotted by linear regression (R2) that shown in Table 1. The limit of detection (LOD) and limit of quantitation (LOQ) of the method realized by MFC serial dilution and by using the equations 3 S/N (signal to noise ratio) and 10 S/N, respectively. Phenolic compound’s LOD ranged from 0.21 to 0.84 μg/mL and LOQ ranged from 0.63 to 2.52 μg/mL in the method. Four different kind of propolis samples were randomly selected for the identification of recovery. This propolis samples spiked which three dif-ferent levels with MFC (20, 10, 5 μg/g). Recovery of the phenolic compounds was found out between 78 and 118% which differences of spike and blank propolis samples by analyzing (Table 1). MFC is analyzed five different days as five times for accuracy and repeatability of the method. The coefficient of variation (relative standard deviation: RSD) in result defined less than 4.3% and in retention time RSD less than 2%. The precision of the method was evalu-ated by repeat the measurements of MFC. Good precision was determined and the results were implemented to the uncertainty budget.
LC–MS/MS analyzes
The analyses were basically conducted as described by Pel-lati et al. [31]. DPEE was dissolved as a 1/60 ratio in metha-nol, filtered with PVDF (polyvinyl difluoride) syringe filter (Millipore Millex-HV, 0.45 µm), and finally 5 μL injected into the LC–MS/MS (n = 3). Analyses were performed using a Zivak HPLC and Zivak Tandem Gold Triple quadruple mass spectrometry equipped with a 460 autosampler, 212 pump and separation with C18 column (150 × 2.1 mm ID,
3 μm, Phenomenex, Germany). The column was eluted using
a linear gradient. Mobile phases with a flow rate of 1.2 mL/ min which are mobile phase A (0.1% formic acid in water)
and mobile phase B (0.1% formic acid in acetonitrile). The gradient elution was applied; 20–30% B at 0–5 min, 30–45% B at 5–6.18 min, 45–50% B at 6.18–10 min, 50–83% B at 10–11.59 min, 83–100% B at 11.59–17.29 min, 100–20% B at 17.29–19 min and 20% B at 19–25 min. The column temperature was set at + 30 °C. Mass spectrometry was per-formed using SIM under a negative ion mode by the Tandem Gold Quan 42 (Thermo Scientific). Helium at 34 psi was used as a drying gas, and nitrogen was used as the nebulizer gas at 55 psi. Details of the, precursor (main) ion, product (fragment) ion and method parameters (collision energy, capillary voltage) were also presented in Table 1, the spec-tra of phenolic compounds presented with Supplementary
Fig. 1 The locations and global positioning system (GPS) coordinates in the Marmara region of Turkey where the propolis samples were col-lected 1-N40°13.513"E28°40.300" lkizce 2-N40°16.442"E29°08.115" Dede9avui; 3-N40°20.703"E28°56.419" Guzelyall 4-N40°23.827"E28°46.169" Triliye 5-N39°56.965'E29°39.119' Tahtak0pru 6-N40°11.927"E29°46.314" Gok9esu 7-N39°59.336'E28°25.221 • Orhaniye 8-N40°18.199'E26°17.625' Orencik 9-N40°05.433'E29°04.390" Kirazll 1 0-N39°50.197"E29°12.116" Kemaliye-1 11-N39°49.861 'E29"13.278" Kemaliye-2 12-N40°07.772'E28°03.583" Ergili 13-N40°21.790'E27°55.249" BandIrma 14-N40°29.919'E27°47.114" Kap1dag 15-N39°32.459"E28°16.301" Mezitler 16-N39°37.198"E28°14.063" Sarfaklar 17-N39°34 618"E28°18.823" Tuzak 18-N39°44 736"E28"20.350" G0kk0y 19-N39°47.005'E28°27.679" Yaylabai;I 20-N39"26.541 "E27"56.889" Ak9ak0y 21-N39°35.685"E26°28.963" AyvacIk 22-N39°47.352"E26°46.245' Evciler 23-N40°10.105"E26"17 730" Saricaali 24-N40°15.309"E26°55.675" Bey9ayIr 25-N40°10.105"E26°17.730' Ecebat 26-N40°52.192"E26°51.251" Malkara 27-N40°46.563"E26°57.240" Elmall-1 28-N40°48.056'E26°57.572" Elmall-2 29-N41°10.892"E26°38.988" KavacIk 30-N41 °25.283"E26°45.854" Asllhan 31-N41 °44.056"E27°20.231 • Yundalan 32-N41 °52.563"E27°04.31 0" yayirlI 33-N42°00.235"E27°17.694' Kula 34-N41 °52.588"E27°30.466" Armutveren 35-N41 °49.823"E27°49.360" Demirk0y 36-N41 °52.588"E27°30.466' AvcIlar 37-N41 °52.472"E27°55.855" lgneada 38-N41 °58.343"E27°54.91 0" Sislioba 39-N41 °38.530"E28°05.232" KIyIk0y 40-N41 °15.696"E28°21.332" lhsaniye 41-N41 °08.994"E29°38.028" c;:ayIrbai;I 42-N41 °08.977'E29°38.028" Yenik0y 43-N41 °07.986'E29°49.617" Kurfall 44-N41 °03.81 0"E30°11.942" KandIra 45-N40°38.384'E30°39.966" AkyazI-1 46-N40°39.341 "E30°37.887" Akyazi-2 47-N40°41.988'E30°12.538" Sapanca 48-N40°56.045"E30°51.628" Sungut 49-N40°47.563"E30°12.564" Ortaburun 50-N40"47.925'E30°10.983" Kurtdere 51-N40"42.155"E29"47.342" G0lcuk 52-N40"42.254"E29"41.560" Ulai;lI 53-N40°38.767"E29"12.858" Tepek0y 54-N40"37.965'E29"00.577" l?enkoy 55-N40°38. 767"E29"12.857" Samanll 56-N40"36.806"E29"09.996" Termal 57-N40"04.559'E30"00.259' Bekdemir 58-N40°13.023"E29"52.144' llyasbey
Fig. 2 Fragment ions spectra of phenolic compounds. CAPE caffeic acid phenethyl ester, GA gallic acid, RT rutin, CA caffeic acid, t-FA trans-ferulic acid, m-COU m-coumaric acid, p-COU p-coumaric acid, LT luteolin, KF kaempferol, QE quercetin, NR naringenin, AP apigenin, GL galangin, t-CA trans-cinnamic acid, PN pinocembrin t-FA n •• ,c 1 -pc c 1 p-COU • • ~c •-: :'"' t> ~c .. • r.c c•.,
NR
t-CA I- C 1 PN.
] 11.:.JS Seo •Fig. 4 and propolis sample spectra were shown in Supple-mentary Fig. 5. Data acquisition was carried out using Var-ian MS Workstation Method Builder 6.9.3 (Walnut Creek, CA, USA).
Statistical analyzes
LC–MS/MS data were analyzed using Mixed Linear Model. Chi-square Test was used to compare prevalence of data. Differences were considered significant probability level of P < 0.05. All statistical analyses were carried out by using SPSS (Version 20.0) software for Windows (SPSS Inc., Chi-cago, IL, USA).
Results and discussion
Sampled propolis specimens had different natural colors such as yellow, green, brown, reddish, orange and black-ish, and their appearances were bright and matt with sticky and not- sticky textures as shown Supplementary Fig. 6. The propolis amounts obtained from a propolis trap ranged from 15 to 285 g for each season. When the propolis sources insufficient, honey bees filled the sides of the traps with resin and filled the middle of the traps with wax (Supplementary Fig. 1). Totally, 15 phenolic compounds were determined in propolis samples and measured by using LC–MS/MS. Statis-tical results and mean of phenolic compounds concentrations of propolis samples across seasons and at different altitudes were presented in Table 2.
Fifteen phenolic compounds result of 174 samples and information of 58 apiaries were presented in Supplementary Table 2. Generally, the highest levels of phenolic compounds were seen the number of 3, 45 and 46 apiaries (Supplemen-tary Table 1).
The prevalence of flavonoids were generally lower than of phenolic acids. Pinocembrin is a flavonoid which was the most common phenolic compound found in all loca-tion. The prevalence (as percentage) of phenolic com-pounds were defined as pinocembrin 100%, m-coumaric acid 99.4%, CAPE 99.4%, naringenin 99.4%, caffeic acid 98.9%, p-coumaric acid 98.3%, quercetin 96%, luteolin 95.4%, ferulic acid 94.8%, galangin 90.8%, trans-cinnamic acid 84.5%, kaempferol 81%, apigenin 57.5%, gallic acid 55.7%, and rutin 44.3% (Supplementary Table 3). The seasonal prevalence of kaempferol and t-cinnamic acid in spring compared to autumn were determined signifi-cantly higher (P < 0.05) (Supplementary Table 3). The seasonal prevalence of naringenin in spring and autumn compared to summer were determined significantly higher (P < 0.05) (Supplementary Table 3). The seasonal preva-lence of rutin in autumn compared to spring were deter-mined significantly higher (P < 0.05) (Supplementary Table 3). Inter-seasonal prevalence of altitudes; rutin in spring according to autumn in 0–200 m, apigenin in sum-mer according to autumn in 500 m and above and gallic acid in spring according to summer and autumn in 500 m and above were determined significantly higher (P < 0.05) (Supplementary Table 3). However, there is no signifi-cant difference according to seasons in 200–500 m altitude
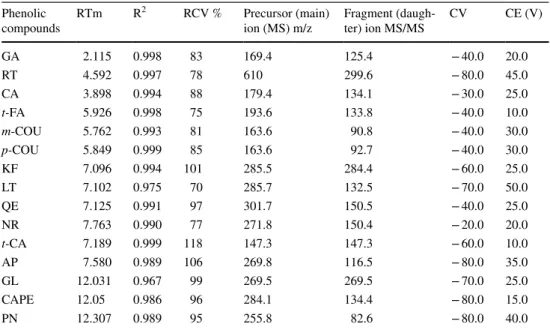
Table 1 The precursor (main) ion, fragment (daughter) ion MS/MS and method parameters of phenolic compounds
GA gallic acid, RT rutin, CA caffeic acid, t-FAtrans-ferulic acid, m-COU m-coumaric acid, p-COUp-cou-maric acid, KF kaempferol, LT luteolin, QE quercetin, NR naringenin, t-CA trans-Cinnamic acid, AP api-genin, GL galangin, CAPE caffeic acid phenethyl ester, PN pinocembrin, RTm retention time, R2 correla-tion coefficients, RCV recovery, CV capillary voltage, CE collision energy
Phenolic
compounds RTm R
2 RCV % Precursor (main)
ion (MS) m/z Fragment (daugh-ter) ion MS/MS CV CE (V)
GA 2.115 0.998 83 169.4 125.4 − 40.0 20.0 RT 4.592 0.997 78 610 299.6 − 80.0 45.0 CA 3.898 0.994 88 179.4 134.1 − 30.0 25.0 t-FA 5.926 0.998 75 193.6 133.8 − 40.0 10.0 m-COU 5.762 0.993 81 163.6 90.8 − 40.0 30.0 p-COU 5.849 0.999 85 163.6 92.7 − 40.0 30.0 KF 7.096 0.994 101 285.5 284.4 − 60.0 25.0 LT 7.102 0.975 70 285.7 132.5 − 70.0 50.0 QE 7.125 0.991 97 301.7 150.5 − 40.0 25.0 NR 7.763 0.990 77 271.8 150.4 − 20.0 20.0 t-CA 7.189 0.999 118 147.3 147.3 − 60.0 10.0 AP 7.580 0.989 106 269.8 116.5 − 80.0 35.0 GL 12.031 0.967 99 269.5 269.5 − 70.0 25.0 CAPE 12.05 0.986 96 284.1 134.4 − 80.0 15.0 PN 12.307 0.989 95 255.8 82.6 − 80.0 40.0
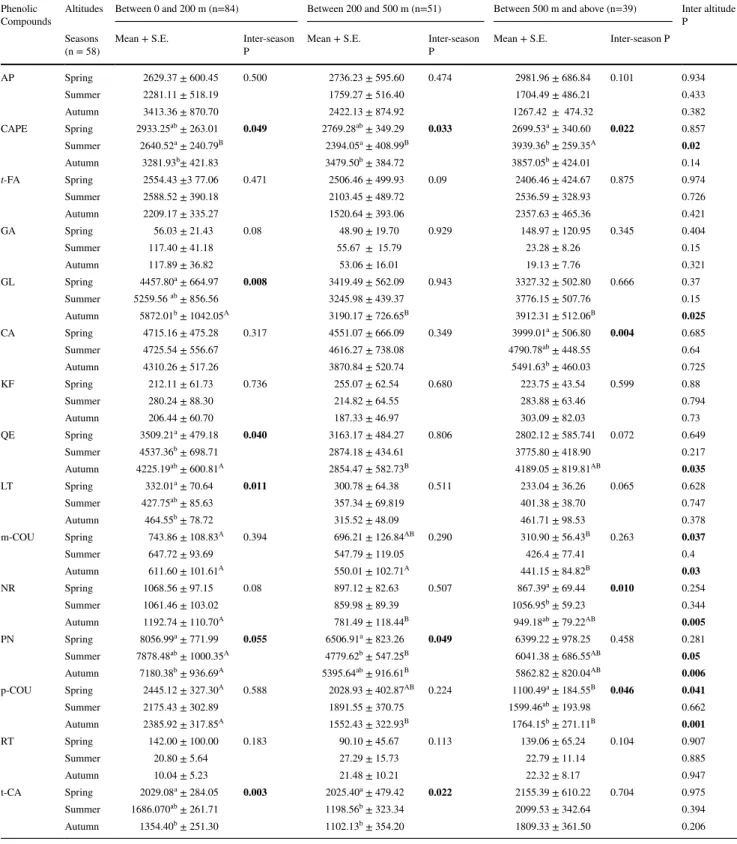
Table 2 Statistical analyses of the average levels of phenolic compounds across seasons and altitudes Phenolic
Compounds Altitudes Between 0 and 200 m (n=84) Between 200 and 500 m (n=51) Between 500 m and above (n=39) Inter altitude P
Seasons
(n = 58) Mean + S.E. Inter-season P Mean + S.E. Inter-season P Mean + S.E. Inter-season P
AP Spring 2629.37 ± 600.45 0.500 2736.23 ± 595.60 0.474 2981.96 ± 686.84 0.101 0.934 Summer 2281.11 ± 518.19 1759.27 ± 516.40 1704.49 ± 486.21 0.433 Autumn 3413.36 ± 870.70 2422.13 ± 874.92 1267.42 ± 474.32 0.382 CAPE Spring 2933.25ab ± 263.01 0.049 2769.28ab ± 349.29 0.033 2699.53a ± 340.60 0.022 0.857 Summer 2640.52a ± 240.79B 2394.05a ± 408.99B 3939.36b ± 259.35A 0.02 Autumn 3281.93b± 421.83 3479.50b ± 384.72 3857.05b ± 424.01 0.14 t-FA Spring 2554.43 ±3 77.06 0.471 2506.46 ± 499.93 0.09 2406.46 ± 424.67 0.875 0.974 Summer 2588.52 ± 390.18 2103.45 ± 489.72 2536.59 ± 328.93 0.726 Autumn 2209.17 ± 335.27 1520.64 ± 393.06 2357.63 ± 465.36 0.421 GA Spring 56.03 ± 21.43 0.08 48.90 ± 19.70 0.929 148.97 ± 120.95 0.345 0.404 Summer 117.40 ± 41.18 55.67 ± 15.79 23.28 ± 8.26 0.15 Autumn 117.89 ± 36.82 53.06 ± 16.01 19.13 ± 7.76 0.321 GL Spring 4457.80a ± 664.97 0.008 3419.49 ± 562.09 0.943 3327.32 ± 502.80 0.666 0.37 Summer 5259.56 ab ± 856.56 3245.98 ± 439.37 3776.15 ± 507.76 0.15 Autumn 5872.01b ± 1042.05A 3190.17 ± 726.65B 3912.31 ± 512.06B 0.025 CA Spring 4715.16 ± 475.28 0.317 4551.07 ± 666.09 0.349 3999.01a ± 506.80 0.004 0.685 Summer 4725.54 ± 556.67 4616.27 ± 738.08 4790.78ab ± 448.55 0.64 Autumn 4310.26 ± 517.26 3870.84 ± 520.74 5491.63b ± 460.03 0.725 KF Spring 212.11 ± 61.73 0.736 255.07 ± 62.54 0.680 223.75 ± 43.54 0.599 0.88 Summer 280.24 ± 88.30 214.82 ± 64.55 283.88 ± 63.46 0.794 Autumn 206.44 ± 60.70 187.33 ± 46.97 303.09 ± 82.03 0.73 QE Spring 3509.21a ± 479.18 0.040 3163.17 ± 484.27 0.806 2802.12 ± 585.741 0.072 0.649 Summer 4537.36b ± 698.71 2874.18 ± 434.61 3775.80 ± 418.90 0.217 Autumn 4225.19ab ± 600.81A 2854.47 ± 582.73B 4189.05 ± 819.81AB 0.035 LT Spring 332.01a ± 70.64 0.011 300.78 ± 64.38 0.511 233.04 ± 36.26 0.065 0.628 Summer 427.75ab ± 85.63 357.34 ± 69.819 401.38 ± 38.70 0.747 Autumn 464.55b ± 78.72 315.52 ± 48.09 461.71 ± 98.53 0.378 m-COU Spring 743.86 ± 108.83A 0.394 696.21 ± 126.84AB 0.290 310.90 ± 56.43B 0.263 0.037 Summer 647.72 ± 93.69 547.79 ± 119.05 426.4 ± 77.41 0.4 Autumn 611.60 ± 101.61A 550.01 ± 102.71A 441.15 ± 84.82B 0.03 NR Spring 1068.56 ± 97.15 0.08 897.12 ± 82.63 0.507 867.39a ± 69.44 0.010 0.254 Summer 1061.46 ± 103.02 859.98 ± 89.39 1056.95b ± 59.23 0.344 Autumn 1192.74 ± 110.70A 781.49 ± 118.44B 949.18ab ± 79.22AB 0.005 PN Spring 8056.99a ± 771.99 0.055 6506.91a ± 823.26 0.049 6399.22 ± 978.25 0.458 0.281 Summer 7878.48ab ± 1000.35A 4779.62b ± 547.25B 6041.38 ± 686.55AB 0.05 Autumn 7180.38b ± 936.69A 5395.64ab ± 916.61B 5862.82 ± 820.04AB 0.006 p-COU Spring 2445.12 ± 327.30A 0.588 2028.93 ± 402.87AB 0.224 1100.49a ± 184.55B 0.046 0.041 Summer 2175.43 ± 302.89 1891.55 ± 370.75 1599.46ab ± 193.98 0.662 Autumn 2385.92 ± 317.85A 1552.43 ± 322.93B 1764.15b ± 271.11B 0.001 RT Spring 142.00 ± 100.00 0.183 90.10 ± 45.67 0.113 139.06 ± 65.24 0.104 0.907 Summer 20.80 ± 5.64 27.29 ± 15.73 22.79 ± 11.14 0.885 Autumn 10.04 ± 5.23 21.48 ± 10.21 22.32 ± 8.17 0.947 t-CA Spring 2029.08a ± 284.05 0.003 2025.40a ± 479.42 0.022 2155.39 ± 610.22 0.704 0.975 Summer 1686.070ab ± 261.71 1198.56b ± 323.34 2099.53 ± 342.64 0.394 Autumn 1354.40b ± 251.30 1102.13b ± 354.20 1809.33 ± 361.50 0.206
SE standard error, AP apigenin, CAPE caffeic acid phenethyl ester, FA trans-ferulic acid, GA gallic acid, GL galangin, CA caffeic acid, KF kaempferol, QE quercetin, LT luteolin, m-COU m-coumaric acid, NR naringenin, PN pinocembrin, p-COUp-coumaric acid, RT rutin, t-CAtrans-cinnamic acid
a,b Different superscripts indicate statistical difference at the same row A,B Different capital letters indicate statistical difference at the same line
(Supplementary Table 3). Although there were differences in the general comparison of seasons and inter-seasonal of the altitudes prevalence, no statistical differences were found general comparison of altitudes and inter-altitudes of the season’s prevalence (P < 0.05) (Supplementary Table 3). Andelkovic et al. [17]. And Goethevac et al. [21] determined higher of prevalence flavonoids in low altitudes and phenolic glycerides in high altitudes. In the current study, there was no difference about prevalence flavonoid or phenolic acid of the low altitudes.
The common determined plants around the apiaries which are probable of propolis sources were Salix spp., Populus spp., Quercus spp., Tilia spp., Pinus spp., Castanea spp. and Juglans spp. as shown in Supplementary Table 1 (respectively). In temperate climate zones which middle of Europe, part of Asia and North America the main sources of propolis are different poplar bud exudate. Moreover, in this zone’s predominant phenolics are flavonoid aglycones (quercetin, pinocembrin, naringenin, kaempferol, galangin etc.) and hydroxycinnamic acids and esters (CAPE, ferulic acid, caffeic acid, p-coumaric acid, m-coumaric acid etc.) [2, 32]. Similarly, Populus spp. (poplar) were identified as one of the most common propolis sources (available 42 of 58 constant apiaries) in the present study (Supplementary Table 1). This parallel finding is probably related to the loca-tion of Turkey as it is between Europe and Asia. In addiloca-tion, the highest levels of among the phenolic compounds were galangin, caffeic acid and pinocembrin (Table 2). When the results of the present study were compared to the previous studies in Turkey; Aliyazıcıoglu et al. [33] indicated the presence of caffeic acid (between 1446.8 and 4658.1 µg/g), p-coumaric acid (between 381.7 and 4579.8 µg/g) and gallic acid (between 8.7 and 70.1 µg/g) levels were lower; ferulic acid (between 223.3 and 7126.9 µg/g) and rutin (between 32.9 and 550.4 µg/g) were similar; and quercetin (between 776.2 and 16,516.8 µg/g) levels were higher than the pre-sent study’s result (Table 2) [33]. In addition, another study reported levels of the following phenolics as: caffeic acid (between 284 and 546 µg/g), p-coumaric acid (between 17 and 88 µg/g), gallic acid (between 13 and 35 µg/g) and luteo-lin (between 31 and 79 µg/g), which were lower than the present study’s result (Table 2).
Significant differences were found in the mean levels of pinocembrin, galangin, naringenin, luteolin, quercetin, caf-feic acid, p-coumaric acid, trans-cinnamic acid, m-coumaric acid and CAPE in propolis across the seasons and altitudes (P < 0.05). However, no differences were found mean levels of rutin, apigenin, kaempferol, ferulic acid and gallic acid as shown in Table 2.
There were 10 significant differences found in same sea-son according to different altitudes which six of them in autumn, two of them in spring and two of them in summer (presented in the inter altitude column of Table 2). There
were 15 significant differences also found in same altitudes according to different seasons which eight of them spring and autumn, five of them between spring and summer, and two of them between summer and autumn (presented in the inter season columns of Table 2). Majority of the significant differences were determined CAPE and PN in the phenolic compounds as shown in Table 2
Evaluation of spring according to altitudes: The amount of m-COU acid and p-COU acid decreased significantly from 0–200 to 500 m and above altitudes (P = 0.037 and P = 0.041, respectively) as shown in Table 2.
Evaluation of summer according to altitudes: There was a considerable increase in the amount of CAPE from 0–200 to between 200–500 and 500 m and above altitudes (P = 0.02); however, PN decreased appreciably from 0–200 m to between 200–500 m altitudes (P = 0.05) as shown in Table 2.
Evaluation of autumn according to altitudes: The amount of m-COU decreased considerably from 0 to 200 and between 200–500 and 500 m and above altitudes (P = 0.03); NR and PN decreased significantly from 0–200 to 200–500 m altitudes (P = 0.005 and P = 0.006, respectively), and in addition GL and p-COU decreased considerably from 0–200 to between 200–00 and 500 m and above altitudes (P = 0.025 and P = 0.001, respectively) as shown in Table 2.
Evaluation of between 0 and 200 m altitudes according to seasons: There was an important increase in the amount of CAPE from summer to autumn (P = 0.049); GL and LT from spring to autumn (P = 0.008 and P = 0.011, respectively), in addition to considerable increase the amount of QE from spring to summer (P = 0.04). Moreover, the amount of PN and t-CA decreased significantly from spring to autumn (P = 0.05 and P = 0.003, respectively) as shown in Table 2.
Evaluation of between 200 and 500 m altitudes according to seasons: There was a considerable increase in the amount of CAPE from summer to autumn (P = 0.033); However, the amount of PN decreased considerably from spring to sum-mer (P = 0.049); t-CA from spring to sumsum-mer and autumn (P = 0.022) as shown in Table 2.
Evaluation of 500 m and above altitudes according to seasons: There was a significant increase in the amount of CAPE and from spring to summer and autumn (P = 0.022); CA from spring to autumn (P = 0.004); NR from spring to summer (P = 0.01); and moreover p-COU from spring to autumn (P = 0.046) as shown in Table 2.
Generally, evaluation of the altitudes according to sea-sons that 0–200 m attitudes in significantly results higher than other altitudes (except CAPE). Besides general evalu-ation of the seasons according to altitudes which 0–200 m altitudes (except PN and t-CA), and 500 m and above alti-tudes in autumn were significant results higher than other seasons but in 200–500 m altitudes of spring was signifi-cantly result higher than other seasons (except CAPE) as shown in Table 2.
There are some reports related to season and altitude (particularly season) and propolis chemical composition and concentrations of phenolic compounds [22–24, 26,
27].
Although these reports have precious scopes and data, they have comparable narrower scope for chemical compo-sition and concentrations of phenolics according to season and altitude (particularly for concentrations of phenolics for altitude). Oruç et al. [14] analyzed two difference altitudes and three seasons of phenolic compounds in 15 samples collected from Bursa in 2012 which 0–600 m and above 600 m, in summer and autumn seasons. Depend on the season; galangin, naringenin, and p-coumaric acid, CAPE phenolic compounds values were found to be higher in the autumn than in the summer. These results differ from the present study’s results except for CAPE. Depend-ing on the altitude, galangin, narDepend-ingenin and p-coumaric acid were determined to be higher than values of above 600 m; these results are generally similar to the present results. Cinnamic acid was found to be higher than the values of above 600 m. In the current study, there was no difference in cinnamic acid values depending on altitude.
Nunes and Guerreiro [23] and Teixeira et al. [26] stud-ies similar to present study result that seasonality influ-ences the chemical composition of propolis. Moreover, Isla et al. [22] stated that the antioxidant activity of propolis depended on the collection month and they detected that propolis had the highest antioxidant capacity in November in Argentina. Nunes et al. [34] also reported that phenolic content of Brazilian red propolis had the highest amounts in February, June, and October, respectively. The study’s results concur with the changes of propolis chemical amounts depending on the collection seasons. Besides season, we found out that there were remarkable changes in phenolic compound levels of propolis related to changes in the altitudes. On the other hand, Valencia et al. [27] reported that seasons did not have a significant effect on the major chemical constituents of Sonoran propolis in Mexico, but they reported that seasons influenced anti-proliferative and antioxidant activity. Sforcin et al. [24] also reported that seasons did not affect the antibacterial activity of propolis.
Conclusion
The study indicated that amounts of CAPE, quercetin, luteolin, trans-cinnamic acid, pinocembrin, caffeic acid, naringenin and p-coumaric acid were significantly changed seasonally and m-coumaric acid, p-coumaric acid, CAPE, pinocembrin, galangin, quercetin and naringenin amounts were changed related by altitudes. While the amounts of CAPE, quercetin, pinocembrin, naringenin, and p-coumaric
acid were significantly changed depending both of the alti-tude and seasons, there was not a significant change in the amounts of apigenin, ferulic acid, gallic acid, kaempferol, and rutin. The effect of seasons or altitudes on phenolic compounds may be related to the synthesis of the phenolic compounds in the vegetation process of the plant. This should be clarified by new future studies. Main phenolic compounds determined were pinocembrin, m-coumaric acid, CAPE, caffeic acid, p-coumaric acid, naringenin, quercetin, ferulic acid, luteolin, and galangin in Marmara region of Turkey. Although certain chemical standardiza-tion of propolis could not be possible due to the variants of propolis sources, the study claim that is possible to partially standardize of propolis to detect propolis components and their amounts regarding seasons and altitudes. In addition, if propolis is to be used for medical and research purposes, it should be analyzed with the different analytical method in order to determine its biologically active compounds and their concentrations.
Acknowledgements The authors would like to thank all the Marmara
region’s Beekeeper Associations and the beekeepers who helped us collect propolis samples from their hives and also thanks helping us for analyses Hasan Hüseyin Ünal and Erol Kabil from Istanbul Pendik Veterinary Control Institute.
Funding The project was supported by TÜBİTAK (1120017).
References
1. E. Ghisalberti, Bee world 60, 59 (1979)
2. V.S. Bankova, S.L. de Castro, M.C. Marcucci, Apidologie 31, 3 (2000)
3. M.I. Isla, J.F. Paredes-Guzman, M.I. Nieva-Moreno, H. Koo, Y.K. Park, J. Agric. Food Chem. 53, 1166 (2005)
4. S. Kumazawa, J. Nakamura, M. Murase, M. Miyagawa, M.R. Ahn, S. Fukumoto, Naturwissenschaften 95, 781 (2008)
5. A.H. Banskota, Y. Tezuka, S. Kadota, Phytother. Res. 15, 561 (2001)
6. A. Borges, C. Ferreira, M.J. Saavedra, M. Simoes, Microb. Drug Resist. 19, 256 (2013)
7. T.W. Chung, S.K. Moon, Y.C. Chang, J.H. Ko, Y.C. Lee, G. Cho, S.H. Kim, J.G. Kim, C.H. Kim, Faseb. J. 18, 1670 (2004) 8. T.P.T. Cushnie, A.J. Lamb, Int. J. Antimicrob. Ag. 26, 343 (2005) 9. K.H. Janbaz, S.A. Saeed, A.H. Gilani, Fitoterapia 73, 557 (2002) 10. R. Liu, M. Gao, Z.H. Yang, G.H. Du, Brain Res. 1216, 104 (2008) 11. K.S.D. Mota, G.E.N. Dias, M.E.F. Pinto, A. Luiz-Ferreira, A.R.M.
Souza-Brito, C.A. Hiruma-Lima, J.M. Barbosa, L.M. Batista, Molecules 14, 979 (2009)
12. E.N. Quiroga, D.A. Sampietro, J.R. Soberon, M.A. Sgariglia, M.A. Vattuone, J. Appl. Microbiol. 101, 103 (2006)
13. V. Bankova, J. Ethnopharmacol. 100, 114 (2005)
14. H.H. Oruc, A. Sorucu, H.H. Unal, L. Aydin, Vet. J. Ankara Univ.
64, 13 (2017)
15. M. Popova, S. Silici, O. Kaftanoglu, V. Bankova, Phytomedicine
12, 221 (2005)
16. L. Stan, L.A. Mărghitaş, D. Dezmirean, Sci. Papers Anim. Sci. Biotechnol. 44, 137 (2011)
17. B. Andelkovic, L. Vujisic, I. Vuckovic, V. Tesevic, V. Vajs, D. Godevac, J. Pharmaceut. Biomed. 135, 217 (2017)
18. B. Bueno-Silva, A. Marsola, M. Ikegaki, S.M. Alencar, P.L. Rosalen, Nat. Prod. Res. 31, 1318 (2017)
19. M.A. Calegari, A. Prasniewski, C. da Silva, R.Y. Sado, F.M.C. Maia, L.M.S. Tonial, T.L.C. Oldoni, An Acad. Bras. Cienc. 89, 45 (2017)
20. M.L. Castro, J.A. Cury, P.L. Rosalen, S.M. Alencar, M. Ikegaki, S. Duarte, H. Koo, Quim. Nova. 30, 1512 (2007)
21. D. Goðevac, B. Anðelković, V. Vajs, V. Tešević, Planta Med. 82, 215 (2016)
22. M.I. Isla, I.C. Zampini, R.M. Ordonez, S. Cuello, B.C. Juarez, J.E. Sayago, M.I.N. Moreno, M.R. Alberto, N.R. Vera, E. Bedascar-rasbure, A. Alvarez, F. Cioccini, L.M. Maldonado, J. Med. Food.
12, 1334 (2009)
23. C.A. Nunes, M.C. Guerreiro, J. Sci. Food Agric. 92, 433 (2012) 24. J.M. Sforcin, A. Fernandes, C.A.M. Lopes, V. Bankova, S.R.C.
Funari, J. Ethnopharmacol. 73, 243 (2000)
25. E.A. Souza, R. Zaluski, N. Veiga, R.O. Orsi, Braz. J. Biol. 76, 396 (2016)
26. E.W. Teixeira, D. Message, G. Negri, A. Salatino, P.C. Stringheta, Evid Based Complement Altern. Med. 7, 307 (2010)
27. D. Valencia, E. Alday, R. Robles-Zepeda, A. Garibay-Escobar, J.C. Galvez-Ruiz, M. Salas-Reyes, M. Jimenez-Estrada, E.
Velazquez-Contreras, J. Hernandez, C. Velazquez, Food Chem.
131, 645 (2012)
28. M.P. Popova, V.S. Bankova, S. Bogdanov, I. Tsvetkova, C. Naydenski, G.L. Marcazzan, A.G. Sabatini, Apidologie 38, 306 (2007)
29. S. Erdogan, B. Ates, G. Durmaz, I. Yilmaz, T. Seckin, Food Chem. Toxicol. 49, 1592 (2011)
30. B. Trusheva, M. Popova, V. Bankova, S. Simova, M.C. Marcucci, P.L. Miorin, F.D. Pasin, I. Tsvetkova, Evid Based Complement. Altern. Med. 3, 249 (2006)
31. F. Pellati, G. Orlandini, D. Pinetti, S. Benvenuti, J. Pharm. Biomed. Anal. 55, 934 (2011)
32. M.C. Marcucci, F. Ferreres, C. Garcia-Viguera, V.S. Bankova, S.L. de Castro, A.P. Dantas, P.H.M. Valente, N. Paulino, J. Eth-nopharmacol. 74, 1052 (2001)
33. R. Aliyazicioglu, H. Sahin, O. Erturk, E. Ulusoy, S. Kolayli, Int. J. Food. Prop. 16, 277 (2013)
34. L.C. Nunes, A.B. Galindo, S.R. Lustosa, M.T. Brasileiro, A.A. Do Egito, R.M. Freitas, K.P. Randau, P.J. Rolim Neto, Adv. Stud. Biol. 5, 119 (2013)
Publisher’s Note Springer Nature remains neutral with regard to