Kastamonu Education Journal
September 2018 Volume:26 Issue:5
kefdergi.kastamonu.edu.tr
Synthesizing Mind Skills Scale: Synthesizing Mind and Academic
Achievement In 7
thGrade Math & Science
1Sentezleyen Zihin Ölçeği: 7’nci Sınıf Matematik ve Fen Bilimleri
Derslerinde Sentezleyen Zihin ve Akademik Başarı
Mustafa ALTINDAĞ
a, Nuray SENEMOĞLU
aaHacettepe Üniversitesi, Eğitim Fakültesi, Ankara, Türkiye.
Öz
Bu araştırmada, yedinci sınıf öğrencilerinin sentezleyen zihin beceri düzeyleri ile Matematik ve Fen Bilimleri dersleri akademik başarı düzeyleri arasındaki ilişki; yüksek, orta ve düşük akademik başarı düzeyindeki öğrencilerin sentezleyen zihin beceri düzeyleri arasındaki fark incelenmiştir. Araştırmanın çalışma grubunu; SBS puanlarına göre belirlenen yüksek (n=74), orta (n=75) ve düşük (n=59) başarı düzeyinde 3 okulun 208 yedinci sınıf öğrencisi oluşturmuştur. Araştırma verileri; araştırmacılar tarafından geliştirilen sentezleyen zihin algı ölçeği, Matematik ve Fen Bilimleri başarı testleri ile toplanmıştır. Veri analizinde ortalama, standart sapma ve Pearson Momentler Çarpımı Korelasyon Katsayıları hesaplanmış, açıklayıcı faktör analizi, tek yönlü varyans analizi (ANOVA) ve Scheffe Testi uygulanmıştır. Araştırma sonucunda; hem sentezleyen zihin beceri düzeyi ile akademik başarı düzeyleri arasında anlamlı düzeyde ilişki bulunduğu, hem de farklı akademik başarı düzeyindeki öğrencilerin sentezleyen zihin beceri düzeyleri arasında yüksek akademik başarı düzeyindeki öğrenciler lehine anlamlı farklar olduğu görülmüştür.
Abstract
In this study, the relation between synthesizing mind behaviors and academic achievement levels; the difference of synthesizing mind behaviors levels in different achievement levels were investigated. The study group consisted of 208 7th grade students in three schools (59 from below average, 75 from average
and 74 from above average school) located in the central district of Ankara. The data was gathered by synthesizing mind scale and math & science examinations, developed by the researchers. For data analysis; the mean, standard deviation and Pearson correlation coefficient were calculated and explanatory factor analysis, one way analysis of variance (ANOVA) and Scheffe Test were performed. In the end, there were significant relations between the levels of students’ synthesizing mind behaviors and academic achievements in math & science and the significant differences between the students’ synthesizing mind behaviors in favor of above average students.
Anahtar Sözcükler beş zihin alanı sentezleyen zihin matematik dersi fen bilimleri dersi Keywords
five minds synthesizing mind math science
Received: 27.11.2017 To Cite: Altındağ, M., & Senemoğlu, N. (2018). Synthesizing mind skills scale: Synthesizing mind and academic
1. Introduction
Scientists, who have realized that it is impossible to catch the age with traditional methods in the world where infor-mation is changing rapidly, have given importance to studies to develop mental skills. Future minds will be formed by education. What kind of minds we need in the future? Gardner (2006) answers the question by five minds: disciplined, synthesizing, creating, respectful and ethical minds.
Disciplined mind: Disciplines are important achievements of human being. They are the perfect answers to the basic
questions about who the individual is physically, biologically and socially. It is difficult and time-consuming to be an expert or master on them (Gardner, 2004). Having knowledge of memorization does not ensure that the individual has a disciplined mind. On the contrary, the disciplined mind is to understand that the historical description of an event is different from the scientific explanation, and that the facts of mathematics are different from the facts of history (Gard-ner, 2009). Respectful mind: It is not possible to remove differences between people and societies. Apart from that, separating societies by building barricades is not the solution. At this point, we must start to leave behind the hate and to disregard people’s differences, to learn to live with them, and to value those outside our own group. This compromi-se can only be achieved through respect. Conflicts can be avoided by respecting different cultures and different ideas (Gardner, 2006). Ethical mind: One of the aims of education is to prepare the individual for the real life, and therefore to prepare for the business life. In business there are many people who are experts in the field but do not act professio-nally. They keep their interests in front. On the other hand, without having any diplomas there are many people who act professionally enough to earn the appreciation of the society. These people have ethical minds. Those with ethical minds are skilled, have responsibility, depend on their work, exhibit an ethical orientation and deserve respect. Being a good citizen, not just for business life, requires an ethical orientation (Gardner, 2006). Creating mind: Creativity, one of the high-level thinking skills, is the ability to produce new ideas valued by all people. Individuals, groups and organizations have to be creative in order to find new and effective approaches to problems and to understand the interaction with the organization’s environment (Allen and Gerras, 2009). The creating mind, often punished by conservative mentality in the past, is one of the most sought-after and praiseworthy features of our time. Organizations that have experts with creating minds can survive (Gardner, 2006). Whenever a domaspecific study of an individual or group is viewed in-novator by the public and has had real impact on the field for many years, it can be considered as creative.
Synthesizing mind
The synthesizing mind is a mind that can investigate a wide range of data sources, decide which information is wor-thy of attention and integrate this information for himself/herself and for other people in a meaningful way (Gardner, 2009). Today it is very important to integrate the information obtained from many different sources into a meaningful whole. The sources of information are diverse and mankind wants everything to be consistent and integral. The infor-mation obtained from wide range of sources can be meaningfully combined and transformed into a coherent structure of human need only by the synthesizing minds (Gardner, 2006).
Gardner (2006) explains the synthesis types as follows. Narratives: The synthesizing mind can combine the infor-mation obtained from different sources and turn it into a narrative. Taxonomies: Facts can be classified according to specific characteristics and expressed in tables or charts. For example, Mendeleyev’s periodic table. Complex concepts: Some of the newly created concepts are related or blended with more than one phenomenon. For example, Darwin’s theory of natural selection. Rules and proverbs: Most of the wisdom in society is converted into short sentences in order to be easily memorized and transmitted to future generations. Strong simulations, images and themes: Individuals can simulate concepts using simulations. For example, Freud simulates Id as horse, and Ego as horse rider. Non-verbal
ex-pressions: Strong syntheses can also exist in works of art. Picasso’s famous man Guernica, for example, put the Spanish
civil war in a wall picture. Theories: Concepts can be brought together in a meaningful way into a theory. Meta theories: They can be called as the top frame for knowledge, in other words the theory of theories.
According to Gardner (2009), the characteristics of synthesizing mind are; Ability to investigate a wide range of
data sources (Taking into account any stimuli in the environment, not satisfied with the school textbook, investigating
information from different sources), Ability to distinguish important information from negligible (Realizing that he/ she reached important information, neglecting trivial information, stopping occasionally and checking if he/she is far from important information), Ability to transfer information between disciplines (Practicing learned information in a different course; when a new rule is learned, giving examples of practice in different courses; giving an example to daily life applications of the information learned), Ability to express an idea originally in different ways (Taking unique notes from the teacher’s speech, converting the information into tables or schemas while taking notes, supporting
informa-tion with tables or schemas while presenting a topic, to present learned informainforma-tion in a different way), Ability to solve
problems with new methods (Questioning other solutions of a problem, questioning teacher’s solution, questioning the
solution suggested in the book, offering a different solution to the problems).
Synthesis in education
The synthesis skills that exist in the pre-school period, although not exhibited for a certain period of time, may reappear at any time, because the preformed schemes are permanent. It is of great importance to have a positive review of students’ synthesis, re-lations made by them and all their meaningful combinations. During middle childhood, teachers should allow students to establish interdisciplinary relationships and reward appropriate ideas. At the same time, the teachers should identify the syntheses that are inadequate and have one dimension. Different solutions, different methods used during the process and evaluation of these solutions with distinctive criteria will help students have a synthesizing mind. Two important conditions must be fulfilled in order to succeed in synthesizing mind development efforts. First; there is a need for role models with multi-disciplinary perspectives and synthesis capabilities. It is important for schools to have role model teachers. Second, specific criteria are needed to distinguish high, average and low-level syntheses. Teachers should encourage high level synthesis and take measures to improve those at lower levels by using these criteria (Gardner, 2006; Senemoğlu, 2013). Although a limited number of studies have been undertaken on synthesizing mind skills, previous studies have reported that there are significant relationships between higher order thinking skills and students’ academic achievements and the quality of the teaching-learning environment is a determining factor on enhancing higher order thinking skills (Koray, 2004; Aktamış ve Ergin, 2006; Özerbaş, 2011; Teemant, Hausman and Kigamwa, 2016; Tanujaya, Mumu and Margono, 2017). In his study Yeşilyurt (2004) has found that employing activities with experiment and game has a positive signifi-cant effect on remembering, analyzing and synthesizing skills of 4th and 5th grades. For this reason, to be able to have enough infor-mation about thequality of the teaching-learning environments in terms of development of synthesizing mind skills there is a need to determine the level of students’ synthesis skills and to examine the relationship between academic achievement and synthesis skills.
The aim of the research
The aim of this research was twofold: (1) to examine the relationship between the level of synthesizing mind skills of seventh grade students and their academic achievement levels in Math and Science and (2) to determine whether there is a significant difference between the levels of the synthesizing mind skills of students at above average, average and below average academic achievement levels. Students’ synthesizing mind skills were designated by Synthesizing Mind Skills Scale (SMSS), academic achievement levels were identified by Math and Science Achievement Tests. At the end of the research, the relationships between the synthesizing mind skills and the academic achievements are specified and the precautions towards synthesizing mind skills development are highlighted.
2. Method Research design
Descriptive correlational study design is used to identify the relationship between the level of synthesizing mind skills and academic achievement and the difference between the levels of synthesizing mind skills of students at different academic achievement levels (Karasar, 2010).
Study group
The study group consisted of seventh grade students in three state schools (which are determined by achievement levels; above average, average, and below average) located in the central district of Ankara. The schools achievement levels were designated according to Level Determination Examination (SBS) scores of math and science in 2012. A total of 208 students participated in the research, 59 from below average, 75 from average and 74 from above average school.
Data Collection Tools
Synthesizing Mind Skills Scale (SMSS)
In the first phase of the development process of the SMSS, the relevant literature was deeply examined (Altındağ, 2015). The synthesizing mind features set out by Gardner (2006) were used to establish the frame of the scale. Later, tho-se items obtained from relevant literature were investigated for their appropriateness to the level of the working group. For this purpose, the items were firstly reviewed by a Turkish language expert and necessary adjustments were made. Subsequently, the items were read aloud by five seventh-grade students from each school and were simplified again so that they could be understood by the working group. In the next stage, the item pool (54 items) was presented to experts. Feedbacks from five of the seven experts were received. In the light of their opinions a trial form was created (35 items). Respondents were asked to select the most appropriate one of the five choices of “Min 1”, “2”, “3”, “4” and “Max 5”. The items were randomly placed in the trial form. A total of 560 seventh grade students from 4 state secondary schools
in Ankara participated in the trial test and seven of them left the items empty. For this reason, the data obtained from 553 students were analyzed. The responses given to the items were rated as 1 point for “Min 1”, 2 points for “2”, 3 points for “3”, 4 points for “4” and 5 points for “Max 5”. The minimum score is 35 and the maximum score is 175. The statistics related to the pilot implementation of test are given in Table 1.
Table 1. Descriptive statistics of the pilot implementation of test
N Mean
Standard Error of Mean Median Mode Standard Deviation Variance 553 126.65 1.14 131 130 26.77 716.68 Skewness Kurtosis Range Minimum Maximum
Cronbach’s Alpha Coefficient of Reliability
-0.69 -0.29 122 52 174 0.95
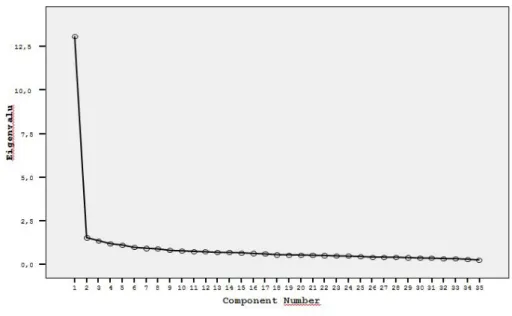
Taking the high variance, wide range of distribution of scores, similar value of mean, median and mode confirms that the scores obtained from the trial test had an almost normal distribution. The reliability coefficient, calculated as Cron-bach’s Alpha, was .95, which indicated high internal coherence. The Kaiser-Meyer-Olkin (KMO) test was conducted to test whether the size of the study group was sufficient for factor analysis and the KMO value was calculated as .96. The Bartlett test result was 8491.56 (p <.01). The significance of the test result suggested that the data measured was from a highly variable universe parameter and was suitable for factor analysis (Tonta, 2007). The line graph of eigenvalues of trial test generated as a result of the explanatory factor analysis is given in Figure 1.
Figure 1. Line graph of eigenvalues of pilot implementation of test
According to the eigenvalues in Figure 1, the scale is unidimensional. According to Büyüköztürk (2002), important factors need to explain 2/3 of the total variance. In practice, however, it is not possible to reach this ratio in behavioral sciences and it is sufficient to have a variance of 30% or more explained on one-factor scales. The trial test in the present study explains 37.37% of the total variance. In order to test the validity based on the internal criterion, the difference between the scores of 27% of the top and bottom groups was calculated. There was a significant difference between the two groups (t (298) = 45.25, p <.01). The factor loads, item test correlations and communalities of the items were examined in the selection of the items that will form the final scale. Büyüköztürk (2002) suggests the use of three measures in item selection at the end of factor analysis. Selection of items (1) with a factor load of .45 or higher, (2) with a high load value in a single factor (the difference between the factor loads should be at least 0.10), (3) with communalities close to 1.00 or above .66 (but in practice it is very difficult to meet). On the other hand, Tezbaşaran (1996) suggests correlation based analysis in item selection. Hence, the correlation between each item and the scale was calculated. The high correlation of an item score with the general test score meant that the item measured what the test in general aimed to measure. In the end, 28 items were selected to form the final form of the/resulting scale.
The raw data obtained from the trial test is used to estimate the statistics of the final scale. For this purpose, descrip-tive statistics of the SMSS with 28 items were estimated; the whole scale was examined by factor analysis and the items
were analyzed based on correlation. The meaningfulness of the difference between the item and scale scores of the top and bottom groups of 27% were examined with a t-test. The statistics of the final scale are presented in Table 2.
Table 2. Statistics of the final scale
N Mean
Standard Error of Mean Median Mode Standard Deviation Variance 553 101.85 0.94 106 116 22.10 488.55 Skewness Kurtosis Range Minimum Maximum
Cronbach’s Alpha Coefficient of Reliability
-0.72 -0.25 97 43 140 0.94
According to the values in Table 2; the presence of high variance, the wide range of distribution of scores, similar mean, median and mode values confirm the scores’ almost normal distribution. The reliability coefficient was calculated as Cronbach’s Alpha .94, indicating internal coherence. The line graph of eigenvalues of final scale generated as a result of the explanatory factor analysis is given in Figure 2.
Figure 2. Line graph of eigenvalues of final test
When the line graph of the final scale is examined, it is seen that the scale is unidimensional and the factor structure explains 40.05% of the total variance. The statistics of the items of the final scale are presented in Table 3.
Table 3. The statistics of the items of the final scale
Items FactorLoads Correlations CommunalityItem-Test
t The Difference Of Top&Bottom
Groups 27%* It is important for me to find new ideas and integrate them in a
meaning-ful way during learning. 0.68 0.65 0.48 16.96
I search for new ideas during learning. 0.60 0.56 0.47 16.40
I take into account any source that will support learning. 0.63 0.59 0.52 15.34 I continuously make an effort to understand the information deeply and
make it self-specific. 0.66 0.62 0.57 19.21
I continuously make an effort to understand the nature of the information. 0.61 0.58 0.62 16.69 I distinguish the resources that I need to look for to find the information I
need. 0.57 0.53 0.42 13.55
While studying on a subject, I distinguish important information and
in-tegrate it with my former knowledge in a self-specific way. 0.64 0.60 0.48 18.27 I identify the similarities and differences of the rules I have learned and
Items FactorLoads Correlations CommunalityItem-Test
t The Difference Of Top&Bottom
Groups 27%* I continuously make an effort to reach the right information. 0.71 0.67 0.61 19.53 I choose the important information from the data obtained from many
different sources and integrate it a self-specific way. 0.58 0.54 0.44 16.59 I effectively use discipline-specific information in the other disciplines. 0.54 0.51 0.52 14.75 When I learn a new rule, I give an example to the practice of this rule in
different disciplines in a self-specific way. 0.60 0.57 0.60 16.75
I give unique examples to the daily life practice of the facts learned at
school. 0.65 0.62 0.61 17.24
In daily life, I use the information learned at school in a self-specific way. 0.63 0.59 0.59 16.18 I explain a subject-matter in a self-specific way by using figure, table or
graph. 0.57 0.54 0.46 15.57
I explain a problem by making it understandable in a self-specific way. 0.70 0.67 0.54 20.81 I explain the result of a research/problem in a self-specific way. 0.65 0.62 0.48 17.84 I explain a graphic, a figure or a poster in a self-specific way with my
own words. 0.63 0.59 0.51 18.54
I integrate the information I learned from tables, charts, diagrams and
texts in a meaningful and self-specific way. 0.64 0.60 0.54 16.73
I clearly identify the objective/objectives I want to achieve during
lear-ning. 0.65 0.61 0.51 17.24
When solving the problem, I make a self-specific plan that will provide
access to the solution. 0.69 0.65 0.56 19.96
I identify additional information that I need to solve the problem. 0.63 0.60 0.46 17.40 I explain the nature of the solution I employed for the problem. 0.67 0.63 0.52 19.10 When solving the problem, I check if I am on proper way during the
so-lution. 0.64 0.60 0.50 17.09
I make an effort to solve the problems in more than one way. 0.63 0.59 0.55 17.25 I make an effort to solve the problems in a self-specific way. 0.68 0.65 0.58 20.78
I solve the problems in a self-specific way. 0.64 0.61 0.55 17.20
I use the solution of a problem to solve the new problems that I have
en-countered. 0.63 0.59 0.44 18.48
* P<.01
According to Table 3, the factor loadings vary between .54-.71, item-test correlations are between .51-.67, communalities vary between .42- .62 and t values that show a significant difference between 27% top and bottom groups are between 13.55- 20.81 (p <.01). This data confirms the unidimensionality of the scale. Tezbaşaran (1996) emphasizes that the items of a scale should be able to distinguish the top and bottom groups’ scores. As a result of the t test, it is seen that all of the items are sufficiently distinguishing two groups.
Content validity of the scale was provided by surveying related literature and expert opinions. Construct validity of the scale was tested with an explanatory factor analysis of data derived from the trial test. The data in Figure 2 and Table 3 show that validity of structure was provided at a sufficient level. The criterion validity of the final scale was tested based on the internal criterion. For this purpose, 27% of the top and bottom groups were examined by analyzing the differences in the scores received from the final scale. There was a significant difference between scores of two groups (t (298) = 44.48, p <.01), hence, confirming its sufficient internal criterion.
Science achievement test
During the development process of the science achievement test, a multiple-choice 35-item pool covering the se-venth-grade fall-semester content was created. In terms of content validity and conformity to the students’ level, the item pool was reviewed by three science teachers and a 32-item trial form was created. The items were read by a Turkish Language expert and necessary adjustments were made. Subsequently, the items were read aloud by four seventh-gra-de stuseventh-gra-dents from above and below average schools and were structured again so that they could be unseventh-gra-derstood by the working group.
The trial form was administered to 118 eighth grade and 111 sixth grade students in the middle of fall-semester in 2014. The trial version of test was administered to the eighth graders who had already covered the subject in their previ-ous year and to the sixth graders who had not studied the subject yet. Item difficulty index (pj) and discrimination index (rb: biserial correlation coefficient) were calculated.
The reliability coefficient (KR-20) of the pilot implementation of test was found as.81. According to Özçelik (1981), item difficulty index should be between .20-.80 with an average of .50 and discrimination index should be positive and at least over .20, if possible over .30 or above. According to trial test results, 10 items were removed from the test taking the selection criteria. The final test consisted of 22 items. When all the selected items were examined, a significant dif-ference (p<.05) was found between the scores of eighth and sixth graders.
Math achievement test
For the development the math achievement test, a multiple-choice 40-item pool covering the seventh-grade fall-se-mester content was created. In terms of content validity and conformity to the students’ level, the item pool was re-viewed by three math teachers and a 35-item trial form was created. The items were read by a Turkish Language expert and necessary adjustments were made. Subsequently, the items were read aloud by four seventh-grade students from above and below average schools and were simplified to suit students’ level and comprehension.
The trial form was administered to 129 eighth grade and 73 sixth grade students in the middle of fall-semester in 2014. The trial application was administered to the eighth graders and sixth graders Item difficulty index (pj) and disc-rimination index (rb: biserial correlation coefficient) were calculated.
The reliability coefficient (KR-20) of the trial test was found as .81. Because they have difficulty index below .35, discrimination index below .27 and have no significant difference (p> .05) between 8th and 6th grade scores, 9 items were removed from the test. The final test consisted of 26 items.
Administration of data collection tools and data analysis
The data collection tools were administered at the end of Fall-Semester in 2014-2015 academic year. SMSS, Math and Science achievement tests were used to find out the relationships between students’ academic achievement and synthesizing mind skills levels.
The Pearson correlation coefficient was calculated for the relationship between SMSS and academic achievement, factor analysis was performed for the validity of the SMSS and the reliability coefficient Cronbach Alpha was calculated for reliability. For the analysis of the data obtained from the scale, the mean and standard deviation were calculated and one way analysis of variance (ANOVA) was performed to identify the difference between the students with different academic achievement levels. The Levene test was used to find out whether there was a significant difference between the variances. The Scheffe Test was used for post-hoc analyses.
The KR-20 was calculated for the reliability of the achievement tests. For item selection, the mean, standard devi-ation, item difficulty index (pj) and discrimination index (rb: biserial correlation coefficient) were calculated and t-test was utilized to determine if there was a significant difference between sixth and eighth graders’ scores. SPSS 15.0 was used for analyses.
3. Findings and Discussion
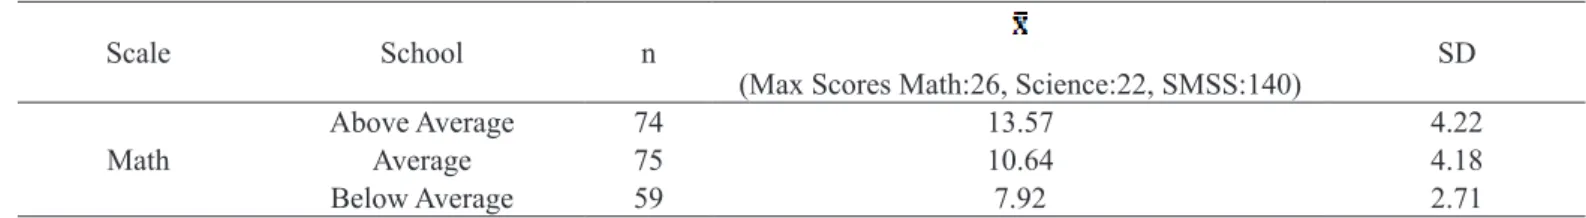
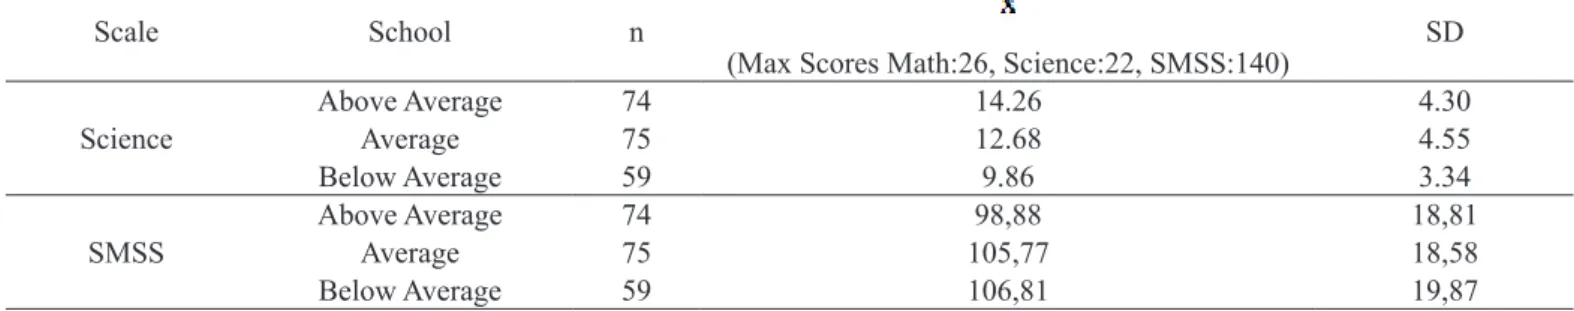
Descriptive statistics of above average, average and below average schools’ students’ math & science achievement tests and SMSS Scores are presented in Table 4.
Table 4. Descriptive statistics of math & science achievement tests and SMSS scores
Scale School n
(Max Scores Math:26, Science:22, SMSS:140) SD
Math Above AverageAverage 7475 13.5710.64 4.224.18
Scale School n
(Max Scores Math:26, Science:22, SMSS:140) SD
Science Above AverageAverage 7475 14.2612.68 4.304.55
Below Average 59 9.86 3.34
SMSS Above AverageAverage 7475 105,7798,88 18,8118,58
Below Average 59 106,81 19,87
When Table 4 is examined, it is seen that the mean scores of math and science are in accordance with the academic achievement levels of the schools but the scores of SMSS are not compatible with the schools’ academic achievement levels. The reason of these results might be that the perceptions of above average school students towards their synt-hesizing mind skills levels were below the real level and they might be unhappy with their level and thought that they should be at a better level. Conversely the perceptions of below average school students towards their synthesizing mind skills levels were above the real level and they might be unaware of their level and thought that their level was enough. Math & science tests and SMSS were administered to all students in average (3 classes) and below average (4 classes) schools. Because there were more than 4 classes in above average school, 4 classes were randomly selected for the tests and scale administrations. The results of Pearson’s Product-Moment Correlation coefficients showing the significance of the relationships between academic achievements and SMSS scores are presented in Table 5.
Table 5. The relations between math & science achievement scores and SMSS scores
School SchoolScales Above AverageSMSS AverageSMSS Below AverageSMSS Above Average ScienceMath .43**.27*
Average ScienceMath .44**.28*
Below Average ScienceMath -.09.15
nAbove Average =74, nAverage =75, nBelow Average =59, * p< .05, ** p< .01.
Examining Table 5, it is seen that in above average and average school seventh grade students, there were significant relationships between math & science scores and SMSS scores at p <.05 and p <.01 levels, but there was no significant relationship between below average school students’ scores (p> .05). Specifically in above average school the signifi-cance of the relationship between math and SMSS scores and in average school the signifisignifi-cance of relationship between science and SMSS scores were found at p <.01 level. The research also showed that in the teaching-learning environ-ment, the math teacher of the above average school and the science teacher of the average school spent more time to the activities that activated the synthesizing mind skills of the students and that the students showed a lot of effort for participation and they were observed to be more willing (Altındağ, 2015). It was asserted that high level significances (p <.01) were results of math (at above average school) and science (at average school) teachers’ efforts and students’ active participation in the teaching-learning environment. At below average school, observations showed that math and science teachers didn’t spend much time to instigate students’ synthesizing mind skills and students didn’t have the op-portunity to present their synthesizing mind skills. The teachers’ excuse for this kind of teacher-centered environment was to discipline the classroom. According to them, having students freely express their ideas would damage the class-room discipline (Altındağ, 2015). As a result, it can be said that the management of the teaching-learning environment to activate the synthesizing mind skills of students increases the relationship between academic achievement and syn-thesizing mind skills and the academic achievement level itself.
Additionally, another point of examination was to find out if there was a significant difference in synthesizing mind skills perception levels of students in different academic achievement levels. Considering the different academic levels in all type of schools, the groups were graded according to the scores in Math and Science achievement tests, rather than the school achievement levels. Firstly, Math and Science achievement scores were converted into T scores (Karasar, 2010). Secondly, for each student the mean of sum of Math and Science T scores calculated for achievement scores. Then, the students were ranked from highest to lowest according to their average achievement scores. The highest group of 27% (n = 57), the lowest group of 27% (n = 57) the remaining 46% (n = 94) were set as the average success level.
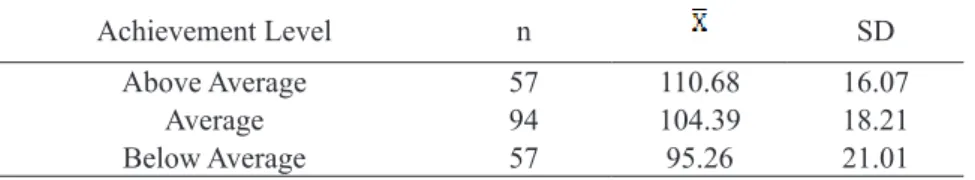
The descriptive statistics of the above average, average and below average achievement levels students’ SMSS scores are presented in Table 6.
Table 6. The descriptive statistics of SMSS scores of the students in different achievements (max score 140)
Achievement Level n SD
Above Average 57 110.68 16.07
Average 94 104.39 18.21
Below Average 57 95.26 21.01
According to values in Table 6, as student achievement level increases, the mean of SMSS scores also increases. One way analysis of variance (ANOVA) was performed to test the significance of the relationship (Table 7).
Table 7. ANOVA results for SMSS scores
Sum of Squares df Mean Square F Sig.
Between Groups 6881.43 2 3440.71 10.07 0.00
Within Groups 70025.81 205 341.59
Total 76907.23 207
ANOVA results (Table 7) revealed the significant difference in SMSS scores of students with different achievement levels (F = 10.07, p <.01). The Scheffe Test was used for post-hoc analysis (Table 8).
Table 8. Scheffe test results for SMSS scores
GROUP (I) GROUP (J)
I - J Sig.
Above Average Average 6.29 0.131
Above Average Below Average 15.42 0.000
Average Below Average 9.13 0.014
According to Scheffe analysis results, differences between the level of above average and below average students’ synthesizing mind behaviors in favor of above average students (p<.01) and between the level of average and below average students’ synthesi-zing mind behaviors in favor of average students (p<.05) were found. Although there was a difference between SMSS score means of above average and average students ( Above Average = 110.68, Average = 104.39) in favor of above average students, it was not sig-nificant (p>.05). Owing to these findings, it can be asserted that the synthesizing mind properties are one of the factors influencing learning process, because the synthesizing mind skill levels have similar characteristics with the academic achievement levels of students. It can also be suggested that spending more time for the activities activating students’ synthesizing mind skills in the teac-hing-learning environment can have positive impact on the academic achievement levels of the students.
In the light of these findings; it can be suggested that there are significant relationships between the level of synthesizing mind skills and academic achievement levels of students. It can also be said that there are significant differences between the synthesizing mind skills of students from different academic achievement levels. It is also thought that the SMSS developed by researcher can be reliably employed by teachers who need to find out students’ synthesizing mind skill deficiencies and help teachers take measures to train the synthesizing minds, one of the most important minds in the future world.
4. Results
In this study, 28-item SMSS with Cronbach’s Alpha .94 is developed. The factor loadings vary between .54-.71, item-test cor-relations are between .51-.67, communalities vary between .42- .62 and t values that show a significant difference between 27% top and bottom groups are between 13.55- 20.81 (p <.01). The scale is unidimensional and the factor structure explains 40.05% of the total variance. Content validity of the scale was provided by surveying related literature and expert opinions. Construct validity of the scale was tested with an explanatory factor analysis of data derived from the pilot test. The data in Figure 2 and Table 3 show that validity of structure was provided at a sufficient level. The criterion validity of the final scale was tested based on the internal criterion. For this purpose, 27% of the top and bottom groups were examined by analyzing the differences in the scores received from the final scale. There was a significant difference between scores of two groups (t (298) = 44.48, p <.01), hence, confirming its sufficient internal criterion (Tezbaşaran, 1996; Büyüköztürk, 2002; Altındağ and Senemoğlu, 2013). The findings indicate that a reliable and valid scale is developed to measure the synthesizing mind skills of students. By SMSS, researchers will be able to have enough information about the quality of the teaching-learning environments in terms of development of synthesizing mind skills and the precautions towards synthesizing mind skills development.
As a result; in above average and average school seventh grade students there are significant relationships between math & sci-ence scores and SMSS scores at p <.05 and p <.01 levels, but there is no significant relationship considering below average school students’ scores (p> .05). In addition, there are significant differences between the level of above average and below average stu-dents’ synthesizing mind behaviors in favor of above average students (p<.01) and between the level of average and below average students’ synthesizing mind behaviors in favor of average students (p<.05).
In math and science, it is observed that especially academic achievement is significantly related to the synthesizing mind skills and as the level of academic achievement increases, the level of synthesizing mind skills increases. Although a limited number of studies have been undertaken on synthesizing mind skills, previous studies have reported that there are significant relationships between higher order thinking skills and students’ academic achievementsand the quality of the teaching-learning environment is a determining factor on developing higher order thinking skills (Koray, 2004; Aktamış ve Ergin, 2006; Özerbaş, 2011; Teemant, Haus-man and Kigamwa, 2016; Tanujaya, Mumu and Margono, 2017). The synthesizer must have enough information about the requisite disciplines to be able to synthesize well for themselves and the others (Gardner, 2008). In his study Yeşilyurt (2004) has found that employing activities with experiment and game has a positive significant effect on remembering, analyzing and synthesizing skills of 4th and 5th grades. After having enough information related to previous steps of taxonomy (Bloom et al, 1956) and providing teach-ing-learning environment adequate for developing synthesizing minds, students will be ready for new synthesis. Each of synthesiz-ing results will be the first step for the next synthesis. This cycle will last till the end of life. People lacksynthesiz-ing of synthesizsynthesiz-ing mind skills will not be able to participate this cycle and future world. By employing the necessary strategies and activities to help students improve their synthesizing mind skills in teaching-learning environments, teachers will be able to create the future synthesizer.
5. Recommendations
In a follow-up research, the curriculums can be designed to develop the synthesizing mind skills of students and it is possible to investigate the academic achievement level differences between the experimental group taught with newly designed curriculum and control group taught with normal curriculum for a specific time period. Similar research can be conducted in different disciplines and at different levels to investigate the level of synthesizing mind skills and the level of academic achievement. It is also possible to investigate how much of the academic achievement can be explained by synthesizing mind skills.
6. References
Allen, C.D. and Gerras, G.S. (2009). Developing creative and critical thinkers. Military Review, November-December 2009.
Altındağ, M. and Senemoğlu, N. (2013). Metacognitive skills scale. Hacettepe Üniversitesi Eğitim Fakültesi Dergisi (H. U. Journal of Education) 28(1), 15-26. Altındağ, M. (2015). Yedinci sınıf öğrencilerinin matematik ve fen bilimleri derslerinde sentezleyen zihin özelliklerinin incelenmesi [An investigation
of 7th grade students’ synthesizing mind in math & science]. Unpublished doctoral thesis, Hacettepe Üniversitesi, Eğitim Bilimler Enstitüsü, Ankara. Aktamış, H. ve Ergin, Ö.(2006). Fen eğitimi ve yaratıcılık [Science and creativity]. Dokuz Eylül Üniversitesi Buca Eğitim Fakültesi Dergisi, 20, 77-83. Bloom, B. S., Englehart, M. D., Furst, E. J., Hill, W. H. and Krathwohl, D. R. (1956). The taxonomy of educational objectives, handbook I: The cognitive
domain. New York: David McKay Co., Inc.
Büyüköztürk, Ş. (2002). Faktör analizi: Temel kavramlar ve ölçek geliştirmede kullanımı [Factor analysis: Basic concepts and using to development scale]. Eğitim Yönetimi Dergisi, 32, 470–483.
Gardner, H. (2004). Discipline, understanding and community. Journal of Curriculum Studies, 36 (2), 233–236. Gardner, H. (2006). Five minds for the future. USA: Harvard Business School Press.
Gardner, H. (2008). The five minds for the future. Schools: Studies in Education, 5, ½ Spring/Fall, 17–24. Gardner, H. (2009). The five minds for the future. School Administrator, 66, (2), 16–21.
Karasar, N. (2010). Bilimsel araştırma yöntemi [Scientific research method]. Ankara: Nobel Yayınevi.
Koray, Ö. (2004). Fen eğitiminde yaratıcı düşünmeye dayalı öğrenmenin öğretmen adaylarının yaratıcılık düzeylerine etkisi [The influence of science education based on creative thinking on creativity of preservice teachers]. Kuram ve Uygulamada Eğitim Yönetimi Dergisi, 40, 580-599.
Özçelik, D.,A. (1981). Okullarda ölçme ve değerlendirme [Measurement and evaluation in schools]. Ankara: ÜSYM-Eğitim Yayınları3.
Özerbaş M.A.(2011). Yaratıcı düşünme öğrenme ortamının akademik başarı ve bilgilerin kalıcılığa etkisi [The effect of creative thinking teaching envi-ronment on academic achievement and retention of knowledge]. Gazi Eğitim Fakültesi Dergisi, 31, (3), 675-705.
Senemoğlu, N.(2013). Gelişim, öğrenme ve öğretim: Kuramdan uygulamaya [Development, learning and teaching: From theory to practice]. Ankara: Yargı Yayınevi. Tanujaya, B., Mumu, J. and Margono, G. (2017). The relationship between higher order thinking skills and academic performance of student in
mathe-matics ınstruction. International Education Studies, 10, (11), 78–85.
Teemant, A., Hausman C.S. and Kigamwa, J.C. (2016). The effects of higher order thinking on student achievement and english proficiency. INTESOL Journal, 13, (1), 1–22.
Tezbaşaran, A. A. (1996). Likert tipi ölçek geliştirme kılavuzu [Guide for developing likert scale]. Ankara :Türk Psikologlar Derneği.
Tonta, Y. (2007). Faktör analizi [Factor analysis]. Retrieved from http://yunus.hacettepe.edu.tr/~tonta/courses/fall2007/sb5002/sb5002-12-faktor-anali-zi.pdf. on April 28, 2008.
Yeşilyurt, S. (2004). İlköğretim 4. ve 5. sınıf öğrencilerinin terazi dengesi ve çözünmeyi hatırlayarak analiz ve sentez yapmada deney ve oyunun etkisi [A study on the effects of experiment and game in remembering, analyzing, and synthesizing balance and dissolution concepts at 4th and 5th grades]. İlköğretim-Online, 3 (1), 11-19.