MODELING OF MICRO TOOL FABRICATION PROCESS USING WIRE ELECTRO DISCHARGE GRINDING
A THESIS
SUBMITTED TO THE DEPARTMENT OF INDUSTRIAL ENGINEERING AND THE GRADUATE SCHOOL OF ENGINEERING AND SCIENCE
OF BILKENT UNIVERSITY
IN PARTIAL FULLFILLMENT OF THE REQUIREMENTS
FOR THE DEGREE OF
MASTER OF SCIENCE
BY
ALİ CAN ERGÜR
1
I certify that I have read this thesis and that in my opinion it is full adequate, in scope and in quality, as a dissertation for the degree of Master of Science.
___________________________________ Asst. Prof. Yiğit Karpat (Advisor)
I certify that I have read this thesis and that in my opinion it is full adequate, in scope and in quality, as a dissertation for the degree of Master of Science.
______________________________________ Asst. Prof. Alp Akçay
I certify that I have read this thesis and that in my opinion it is full adequate, in scope and in quality, as a dissertation for the degree of Master of Science.
______________________________________ Asst. Prof. Melih Çakmakcı
Approved for the Graduate School of Engineering and Science
____________________________________ Prof. Levent Onural
2
ABSTRACT
MODELING OF MICRO TOOL FABRICATION PROCESS USING WIRE ELECTRO DISCHARGE GRINDING
Ali Can Ergür
M.S. in Industrial Engineering Supervisor: Assist. Prof. Yiğit Karpat
December, 2013
Fabrication of micro tools made from tungsten carbide and polycrystalline diamond is a difficult and time consuming process. Quality of the tool directly affects the dimensional integrity of the fabricated micro products. In this thesis, fabrication of micro end mills using wire electro discharge grinding (WEDG) process, a variation of electro discharge machining process, is considered. The advantage of this process is that very small micro tools (less than 0.1 mm diameter) can be produced by eroding the tool material through electrical discharges. It is preffered over traditonal grinding process since no forces are transmitted to the tool body during fabrication. However, it takes a very long time to fabricate micro tools with this method. Therefore, it is important to understand the influence of process parameters on material erosion rate in order to be able to model the process. In this study, the relationship between process input parameters and process outputs (material erosion rate and surface roughness) is investigated using experiments. A parametric formulation which allows the estimation of tool fabrication time as a function of WEDG process parameters and given tool geometry has been developed. The developed model can be used in tool geometry design optimization studies.
Keywords: Wire Electro Discharge Grinding, Micro Tool Fabrication, Experimental Modeling, Process Modeling.
3 ÖZET
TEL EREZYONLA TAŞLAMA YÖNTEMİ İLE MİKRO TAKIM ÜRETİMİ İŞLEMİNİN MODELLENMESİ
Ali Can Ergür
Endüstri Mühendisliği, Yüksek Lisans Tez Yöneticisi: Yrd. Doç. Dr. Yiğit Karpat
Aralık, 2013
Poli-kristal elmas ve tungsten karbürden yapılmış olan mikro takımların üretilmesi zor ve zaman alıcı bir süreçtir. Kullanılan takımın kalitesi ise üretilecek olan mikro ürünlerin boyutsal hassasiyetini doğrudan etkilemektedir. Bu tezde mikro uç frezelerinin, elektroerezyon metodunun bir çeşidi olan tel erezyonla taşlama yöntemi ile üretilmesi incelenmiştir. Bu yöntem ile çok küçük çapa sahip (0,1mm’den küçük) mikro takımlar, takım malzemesini elektriksel boşalmalar sayesinde eriterek üretilebilinir. Bu yöntem takım gövdesine hiçbir kuvvet iletmediğinden geleneksel taşlama yöntemlerine tercih edilmektedir. Ancak bu yöntem ile mikro takım üretmek çok zaman almaktadır. Bu sebeple, tel erezyonla taşlama yöntemini modelleyebilmek için işleme sürecinde madde kaldırma oranına etkisi olan parametreleri anlayabilmek önem taşımaktadır. Bu çalışma, sürece girdi olan parametrelerle süreç çıktısı parametreler (madde kaldırma oranı, yüzey pürüzlülüğü) arasındaki ilişkiyi deneysel yöntemlerle incelemektedir. Takım işleme zamanını öngörmek için süreç parametrelerinin ve tanımlanan takım geometrisinin bir fonksiyonu olan parametrik bir formulasyon geliştirilmiştir. Geliştirilen bu model, takım geometrilerinin dizaynını iyileştirme çalışmalarında da kullanılabilir.
Anahtar Sözcükler: Tel Erezyonla Taşlama, Mikro Takım Üretimi, Deneysel Modelleme, Süreç Modellemesi.
4
ACKNOWLEDGEMENT
I would like to express my sincere gratitude to my advisor Asst. Prof. Yiğit Karpat for his valuable guidance and support during my graduate study. He has supervised me with everlasting patience and encouragement throughout this thesis. He motivated me with his enthusiasm and immense knowledge. I consider myself lucky to have a chance to work with him.
I am also grateful to Asst. Prof. Alp Akçay and Asst. Prof. Melih Çakmakcı for accepting to read and review this thesis.
I would like to give my special thanks to my family, especially my sister H. Sevil Ergür for her endless support, encouragement and experience. I also would like to thank to my lovely mother and dedicate this thesis to my father who passed away long time ago.
Last but not least, I would like to thank to my precious friends Can Eyüp Çekiç, Gizem Sevinç, Ece Zeliha Demirci and Ali Yağmur Aydınlı for their endless support and motivation. Life and the graduate study would have not been bearable without them.
Finally, I would like to extend my sincere appreciation to the members of Department of Industrial Engineering of Bilkent University and all friends I failed to mention here for their friendship and support.
5
Contents
Chapter 1 ... 10
Introduction ... 10
1.1. General View for Micro Machining ... 10
1.2. Basic Principles of Electro Discharge Machining (EDM) ... 13
1.3. Types of EDM Methods ... 15
1.4. Goal of Thesis ... 19
1.5. Organization of Thesis ... 21
Chapter 2 ... 22
Literature Review ... 22
2.1. Introduction ... 22
2.2. Literature Review on Statistical Analysis, Modeling and Optimization of EDM Process Parameters ... 23
2.3. Discussion... 35
Chapter 3 ... 36
Experimental Setup ... 36
3.1. Block EDM Process (Rough EDM)... 36
3.2. Wire Electro Discharge Grinding Process (WEDG) ... 37
3.3. Experimental Setup ... 39
Chapter 4 ... 43
Modeling of Wire Electro Discharge Grinding (WEDG) Process ... 43
4.1. Introduction ... 43
4.2. General Effects of WEDG Process Parameters ... 43
6
4.2.2. Capacitance ... 44
4.2.3. Spindle Speed ... 45
4.2.4. Feed Length and Feed Rate ... 46
4.3. Process Parameter Definitions ... 47
4.4. Modeling of effective wire radius as a function of process parameters ... 50
4.5. Finish machining time estimation for micro end mills having complex geometries 55 4.6. Process Planning for WEDG Process: A Numerical Example ... 61
Chapter 5 ... 65
Conclusion and Future Work ... 65
Appendix ... 69
7
List of Figures
Figure 1.1 Applications for Different Types of Micro Products [Karpat et al. (2012)]... 11 Figure 1.2 General Classification of Micro Manufacturing Processes [Rajurkar et al. 2006] ... 12 Figure 1.3 Sparking Phenomena and Material Removal Process in EDM: a) Sparks ocur at closest points b) Vaporization of materials during Spark ON c) Vaporized cloud of materials stay in dielectric fluid during Spark OFF d) Material removal occurs and new sparking phenomena starts.[Jameson (2001)] ... 14 Figure 1.4 Different Variants of WEDM Technique: a) Conventional WEDM b)
Material Removal machanism for WEDM c) Cyclindrical wire electro discharge turning [Haddad & Tehrani (2008)] ... 17 Figure 1.5 WEDM Process Inputs and Outputs ... 18 Figure 1.6 Micro Tools Fabricated by FIB Method [Vasile et al. (1996)] ... 19 Figure 1.7 Different Types of Micro Tools: (a) 50m Tool by WEDG Method [Fleischer et al. (2008)], (b) Micro Tools by WEDG + FIB Method [Ali and Ong (2006)], (c) Micro Ball End PCD Tool [Cheng et al. (2009)] ... 20 Figure 2.1 Plots of parameter effects as a result of experimentation table. [Mohammadi et al. (2008)]... 24 Figure 2.2 Evaluation of Optimal Parameters (X1: Discharge Current, X2: Pulse
Duration, X3: Pulse Frequency, X4:Wire speed, X5:Wire Tension, X6: Dielectric flow rate), [Datta and Mahapatra (2010)] ... 25 Figure 2.3 Graphical representation of the relation of various WEDM process
8
Figure 2.4 Maximized cutting speed versus Ra [Sarkar et al. (2006)]... 28
Figure 2.5 Plot of predicted values for each of the output parameters [Shabgard and Shotorbani (2010)] ... 30
Figure 2.6 Plots for the investigation of mutual effect between MRR, SR and process parameters [Sadeghi et al. (2011)] ... 32
Figure 2.7 Fixed parameters and effects of selected parameters on MRR [Haddad et al. (2009)] ... 33
Figure 2.8 Effects of selected parameters on Ra and Roundness [Haddad et al. (2009)] 34 Figure 3.1 Machining of a micro tool by block EDM technique [Perveen et al. (2012)] 37 Figure 3.2 Representation of WEDG Method [Masuzawa et al. (1985)] ... 38
Figure 3.3 Sacrificial wire in WEDG process [Vallance et al. (2006)] ... 39
Figure 3.4 DT 110 MICROTOOLS ... 40
Figure 3.5 DT 110 MICROTOOLS multipurpose machining center ... 40
Figure 4.1 Schematical view of WEDG process ... 48
Figure 4.2 Modeling of WEDG process [Qu et al. (2002)] ... 50
Figure 4.3 Response surface methodology for effective wire radius ... 54
Figure 4.4 (a) A commercial PCD micro tool, (b) PCD micro tool fabricated at Bilkent ... 55
Figure 4.5 A general representation of micro end mill geometry ... 56
Figure 4.6 Linear and circular tool path formulations [Su and Chen (1999)] ... 57
Figure 4.7 Theoretical model for surface roughness prediction ... 58
9
List Of Tables
Table 2.1 Process factors and their levels [Yang et al. (2012)] ... 29
Table 3.1 Properties of Tungsten Carbide (WC) ... 41
Table 3.2 Properties of Polycrystalline Diamond (PCD)... 41
Table 3.3 Properties of the pure tungsten (W)... 41
Table 3.4 Properties of the brass wire ... 42
Table 3.5 Properties of EDM fluid 108 MP-S ... 42
Table 4.1 Process parameters and their ranges ... 51
Table 4.2 Experimental process parameters ... 52
Table 4.3 Process Plan ... 61
10
Chapter 1
Introduction
1.1. General View for Micro Machining
Manufacturing of high value added parts has become a crucial component of many countries' economies. As a result, the development of micro manufacturing technologies and precision of micro scale parts have attracted significant attention among researchers not only in academia but also in industry over the past 15 years. These miniature products, tools, components, and machines have smaller footprints, lower power consumption and higher heat transfer because of their high surface-to-volume ratio. Due to these advantages, the micro-nano scale miniature parts and tools have been widely used in many industrial areas such as aerospace, automotive, electronics, etc. Hence, micro manufacturing techniques can be utilized in order to obtain high value added and highly precise micro components and tools. Figure 1.1 depicts the applications for various types of micro products.
11
Figure 1.1 Applications for Different Types of Micro Products [Karpat et al. (2012)]
In order to fabricate these high value added and high precision micro features, new micro machining techniques are required. Manufacturing processes which are to fabricate parts in nano scale are different those used in macro scale. Lithography, electro discharge machining, laser machining, focused ion beam, etc. are widely used nano-micro manufacturing methods. Each process has its own pros and cons. Optical lithography techniques, which are suitable for fabricating silicon based parts in micro nano scale, cannot be used to produce micro parts from engineering materials such as steels, aluminum, and titanium alloys etc. Mechanical processes are common in practice but due to mechanical nature of the process hard materials cannot be machined easily. Energy based methods such as laser beam are gaining importance but these methods are limited in terms of finished part geometry. The subject of this thesis is electro discharge machining (EDM) which offers unique properties in terms of process flexibility and end part quality. In EDM, there is no direct contact between workpiece and the tool which
12
means no force is acting on workpiece. This property results in higher accuracy and good surface finish. The general view for the micro machining process is shown in Figure 1.2.
Figure 1.2 General Classification of Micro Manufacturing Processes [Rajurkar et al. 2006]
13
1.2. Basic Principles of Electro Discharge Machining (EDM)
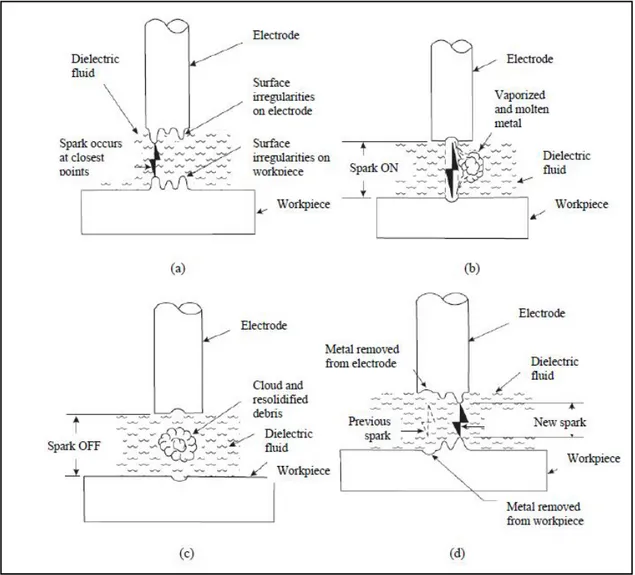
In EDM, the material removal basically occurs through discharges between an electrode and a workpiece that stay in dielectric fluid. The electrical discharges happen when the electric field exceeds a critical value so that electrical energy turns into thermal energy and each discharge makes contribution to this thermal energy. By the help of each discharge between workpiece and electrode, a micro scale amount of material is melted [Vallance et al. (2006)]. In other words, EDM is a thermoelectric process that erodes workpiece materials by a series of discrete electrical sparks between the workpiece and an electrode. Figure 1.3 describes the sparking phenomena in EDM method. The sparks occur at the closest point between workpiece and electrode tool. The materials from both workpiece and electrode are melted and vaporized molten metal occurs during spark on. Then, the dielectric fluid encloses these vaporized molten debris while spark off. Finally material removal takes place by the help of dielectric fluid and the process originates a new sparking phenomena.
14
Figure 1.3 Sparking Phenomena and Material Removal Process in EDM: a) Sparks ocur at closest points b) Vaporization of materials during Spark ON c) Vaporized cloud of materials stay in dielectric fluid during Spark OFF d) Material removal occurs and new
sparking phenomena starts.[Jameson (2001)]
In EDM method, hardness or strength of material is not dominating factors. Electrical conductivity and melting temperature are important properties of the materials. Therefore, difficult to machine workpiece materials can be machined by EDM easier
15
than other traditional methods. Also, complex and irregular shapes can be appropriately machined by the EDM method which has precise machining capability through CNC systems. Thus EDM technique can be easily adapted to fabrication of miniature parts [Mohammadi et al (2008)].
1.3. Types of EDM Methods
There are two major EDM methods used in practice. These methods can be stated as die-sinking EDM and wire-EDM. Also there has been some other variations of EDM techniques such as stationary block-EDM, wire electro discharge grinding (WEDG), wire electro discharge turning (WEDT), etc.
In die-sinking EDM, the electrode is shaped in the form which will be machined on the workpiece surface. Therefore, preparation of an electrode is required before the process. The working principle of die sinking EDM was explained in Figure 1.3. Similarly, electrode and work material are placed in the dielectric medium and electric voltage is applied which initiaes the EDM process as described above.
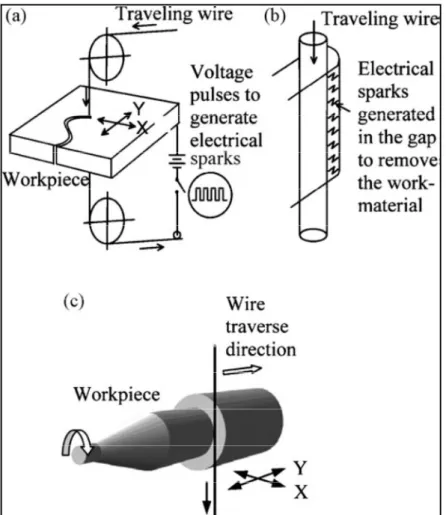
The wire-EDM (WEDM) is another type of EDM machining method. This process, shown in Figure 1.4, uses a thin travelling wire which is fed through the workpiece.
The main advantages of WEDM process can be stated as follows:
1) No direct contact between the workpiece and the wire 2) No direct mechanical forces in the process
16
4) Fine, precise cutting, close tolerances which result higher surface quality 5) Highly accurate positioning capability during machining
6) Machining ability for difficult-to-cut materials
7) Complex 3D shapes can be machined easier than traditional machining techniques
8) Deformation and deflection during the machining can be eliminated
However, the main disadvantages of WEDM process can be specified as follows:
1) Lower material removal rates 2) Higher machining times
3) Tool (wire) breakage problem due to electrode wear may occur 4) Higher setup times
17
Figure 1.4 Different Variants of WEDM Technique: a) Conventional WEDM b) Material Removal machanism for WEDM c) Cyclindrical wire electro discharge
turning [Haddad & Tehrani (2008)]
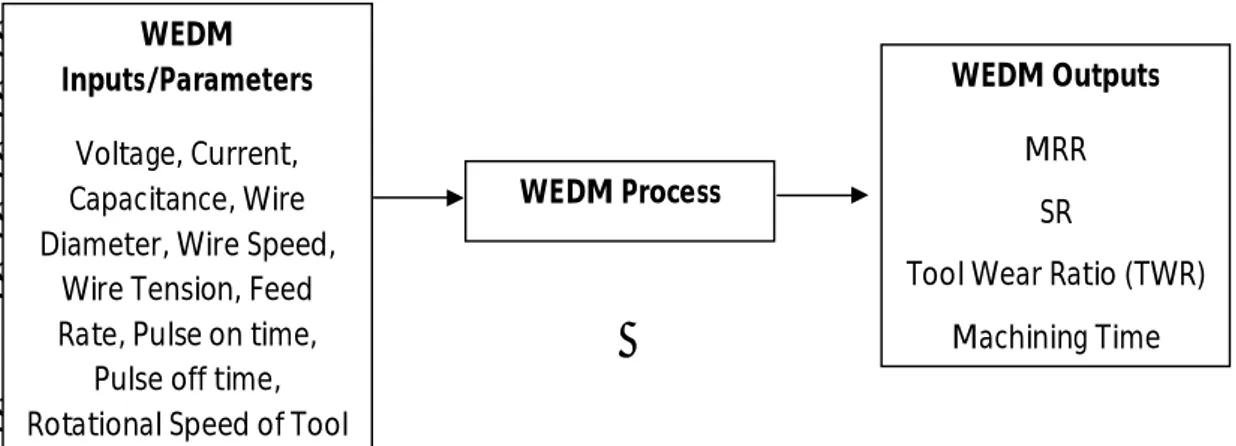
Moreover in WEDM technique, there are some important process parameters which have direct influence on the machining. The most significant factors that affect the WEDM process are voltage, current and capacitance. These parameters determine the energy level which is required for thermo-electrical material removal in WEDM machining. When these parameters are increased in the process, the specified energy
18
also increases. Therefore, more material can be removed during the process. Hence, the material removal rate (MRR) increases and total machining time decreases. However increasing the energy level by increasing voltage, current, capacitance settings may yield poor surface quality on the work material. Thus, the surface roughness (SR) value rises when the energy level is increased during the WEDM process. For this reason, one can obtain higher MRR and higher SR when the energy level increases in the process. Furthermore the wire material, wire diameter, wire tension, rotational speed, feed length and feed rate can also be stated as the other parameters that influence WEDM machining process. The mentioned WEDM process parameters is shown in Figure 1.5 and important parameters’ effects will be discussed in Chapter 4. In this study, WEDM method will be used in the micro electrode fabrication process.
Figure 1.5 WEDM Process Inputs and Outputs
As mentioned previously, in this study WEDM method will take place in order to manufacture high precision micro cutting tools with optimized process parameters. Therefore, in the next heading a brief overwiew of micro cutting tools will be given.
WEDM Inputs/Parameters
Voltage, Current, Capacitance, Wire Diameter, Wire Speed,
Wire Tension, Feed Rate, Pulse on time,
Pulse off time, Rotational Speed of Tool
WEDM Process
WEDM Outputs MRR
SR
Tool Wear Ratio (TWR) Machining Time
19 1.4. Goal of Thesis
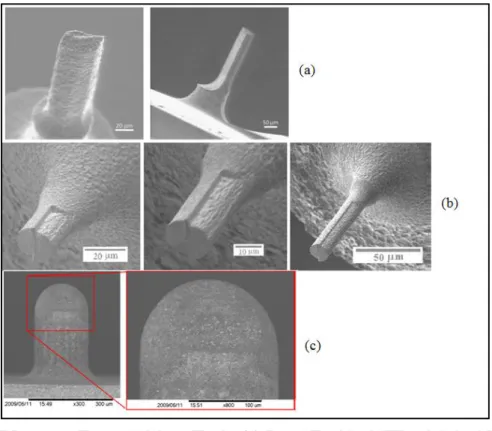
In this thesis, the main goal is to fabricate micro cutting tools from tungsten carbide (WC) and polycrystalline diamond (PCD) by employing WEDM technique. Micro cutting tools have diameters typically less than 1 milimeter. Tungsten carbide micro tools with diameters down to 0.1 mm can be obtained from tool manufacturers. PCD micro tools, however, cannot be fabricated through grinding process. Therefore, EDM based methods are usually used to produce these tools. In addition to EDM, focused ion beam (FIB) method has also been used to fabricate micro cutting tools. Some micro cutting tools from literature are shown in Figure 1.6 and 1.7.
20
Figure 1.7 Different Types of Micro Tools: (a) 50m Tool by WEDG Method [Fleischer et al. (2008)], (b) Micro Tools by WEDG + FIB Method [Ali and Ong (2006)], (c) Micro
Ball End PCD Tool [Cheng et al. (2009)]
The challenge in the fabrication of these micro tools is to reach high material removal rate and low surface roughness values by attaining the required tool geometry and dimensions. Material removal rate affects the processing time and cost of the product (cutting tool) and surface roughness influences the performance of the product and machining process.
Generally, the initial diameter of the blank tool material is 3 mm. Therefore, a rough EDM operation is required to reduce this diameter to required level. Once it is reached, surface quality of the tool becomes important. This whole process should be performed
21
in less machining time and low cost; producing high surface quality and exact diameter values as a result. In order to reach these goals, a process plan for WEDM process must be developed. In order to be able to do that, the influence of WEDM parameters on the process must be understood. Experimental techniques are used for that purpose. Analytical time and cost estimatation models are developed based on experimental findings.
1.5. Organization of Thesis
In Chapter 2 the literature review for modeling, statistical analysis and parametric optimization approaches for EDM / WEDM / WEDG will be given. In Chapter 3, the experimental setup information will be shown. Chapter 4 will include the modelling of WEDM / WEDG process by considering the experimental results and selected variables. In Chapter 5, the conclusions are given and the possible future work will be discussed.
22
Chapter 2
Literature Review
2.1. IntroductionThis chapter presents the previous studies about modeling, statistical analysis and optimization of Electro Discharge Machine (EDM) process. EDM method is a thermo-electrical machining technique that erodes the workpiece material by employing high spark energy between the workpiece and the electrode within a special dielectric fluid. The outstanding property of EDM is the ability to machine difficult to cut and geometrically complex materials easier than other machining techniques without of any contact between electrode and workpiece. The selection of process parameters in EDM method becomes an important issue for manufacturing research. Appropriate selection of parameters will yield lower machining time, cost and higher productivity for EDM applications. However, it is very challenging to model the EDM process and optimize the parameters because of the excessive number of process parameters and the stochastic nature of this machining technique. Therefore, many of the researches choose a set of input parameters in their models and optimize the EDM process within the range of the
23
specified parameters. This chapter presents present previous works on WEDM machining.
2.2. Literature Review on Statistical Analysis, Modeling and Optimization of EDM Process Parameters
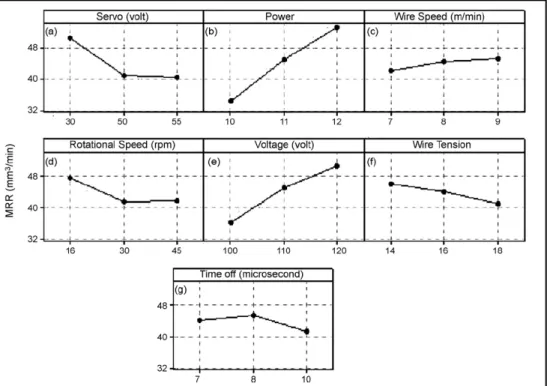
Mohammadi et al. (2008) investigated the effects of machining parameters on material removal rate (MRR) using statistical methods. The analysis of variance (ANOVA) method was applied in order to evaluate the effect of input parameters on process outputs. Power, off-time, voltage, servo voltage, wire tension, wire speed, and rotational speed are used as input parameters and material removal rate is considered as process output. Each process parameter has three levels. Taguchi orthogonal arrays was adopted for the experimental design of the process. The authors stated that the procedure of Taguchi method is to find a standard array which its number of rows is at least one more than the number of degrees of freedom, and its columns are assignable to the factors in the experiments. Mohammadi et al. (2008) did not include the constant parameters such as wire diameter, machining length, etc. in their analysis. As a result, a second order polynomial equation between process parameters and process output was derived. Figure 2.1 shows the effects of parameters on the material removal rate [Mohammadi et al. (2008)]. The servo and rotational speed are inversely proportional to MRR. Moreover, MRR increases with increasing the power and voltage in machining. However, wire speed and wire tension and time-off parameters were negligible. Thus, voltage, servo and power are the most effective parameters for MRR.
24
Figure 2.1 Plots of parameter effects as a result of experimentation table. [Mohammadi et al. (2008)]
Another study was conducted by Datta and Mahapatra (2010) on WEDM. The process variables were selected as discharge current, pulse duration, pulse frequency, wire speed, wire tension and dielectric flow rate. The experimental data were utilized to engage the quadratic models (Response Surface Model (RSM)). Process outputs material removal rate (MRR), surface finish (SF), and cutting width (Kerf). For the experiments, a 0.25mm zinc coated copper wire was selected as cutting wire. A 200 x 25 x 10mm D2 steel block were chosen as a workpiece material. Figure 2.2 shows the main effect plot as a result of experimental study. Datta and Mahapatra (2010) claimed that the most important factor in WEDM process in their study was pulse duration.
25
Figure 2.2 Evaluation of Optimal Parameters (X1: Discharge Current, X2: Pulse Duration, X3: Pulse Frequency, X4:Wire speed, X5:Wire Tension, X6: Dielectric flow
rate), [Datta and Mahapatra (2010)]
The optimal parametric set was obtained by the predicted data from these RSM models through Taguchi’s Orthogonal Array design. These multi objective (maximizing MRR, minimizing SF and Kerf) optimization problem was then reduced to single objective function and the optimal parameters were evaluated through Grey based Taguchi technique. In this technique, experimental data is normalized ranging from zero to one and next the grey relational coefficients are calculated to represent the correlation between the actual and experimental data. Hence, a multiple response optimization problem is converted into a single response optimization problem through this approach. The authors obtained a second order response surface model without considering the interaction effect of other parameters. The mathematical models for MRR, SF and Kerf
26
further reduced into linear regression models. MINITAB statistical software was used for the evaluation of the coefficients of linear regression model and ANOVA technique at %95 confidence interval was performed in order to check the level of significance of the factors.
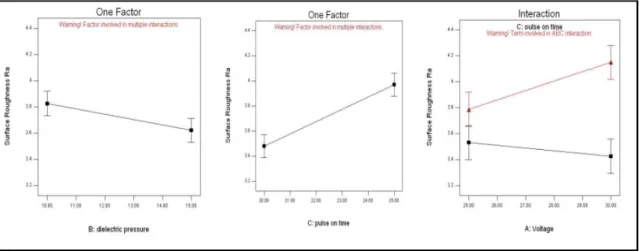
Kuriachen et al. (2012) investigated pulse on time, pulse off time, voltage and dielectric fluid pressure as WEDM parameters in order to find an optimal solution for surface roughness (Ra). The authors chose the respective parameters through design of experiment approach. Sixteen experiments and two confirmation tests were completed. In order to determine the significant factors and the mathematical relationship, ANOVA was performed. The ANOVA showed that the most important factor that affects Ra was pulse on time. At the minimum value of pulse on time, the Ra decreases with the increase in voltage; however, at maximum value of pulse on time, Ra increases with the increase in voltage. Furthermore, it can be claimed that, Ra decreases with the increase in the dielectric pressure. As a result of experimental investigation and analysis results, the mathematical formulation for Ra was obtained. Figure 2.3 gives the relationship between the effective process parameters and output variable, SR.
27
Figure 2.3 Graphical representation of the relation of various WEDM process parameters [Kuriachen et al. (2012)]
Consequently, Kuriachen et al. (2012) claimed that minimum Ra would be obtained by choosing a low value of pulse on time (20µs) and a high value of dielectric pressure. Moreover, it was also stated that unsuitable parameter values might result as wire breakage which increases the machining time and disturbs the process. Finally for that study, the marginal error between prediction and confirmation tests was less than %7.
Sarkar et al. (2006) presented a machining strategy by performing parametric optimization of WEDM model through using ANN method. The performance measures were chosen as cutting speed, surface roughness and wire offset. On the other hand, the process parameters were pulse on time, pulse off time, peak current, wire tension, dielectric flow rate and servo voltage. The other parameters were set as constant in order to observe the main parameter effects. The workpiece material was selected as titanium alloy. A factorial design experiment that includes 18 experiments was performed in order to model the WEDM process. Sarkar et al. (2006) claimed that higher cutting speed was associated with higher Ra and wire offset values. It was also stated that the Ra
28
value decreases as the maximum cutting speed increases and this relation seems linear up to a point. After this point, the increase in the cutting speed results with a decrease in the slope as shown in Figure 2.4.
Figure 2.4 Maximized cutting speed versus Ra [Sarkar et al. (2006)]
Yang et al. (2012) performed the back propagation neural network (BPNN) and RSM approach for evaluating the optimal parameter set of MRR, Ra and corner deviation (CD) with respect to WEDM process parameters. The BPNN approach is used to model the compelx systems with the training data. The data is given to the model as process parameters (input layer); the interaction of input layer can be obtained by hidden layer and the outputs of the system can be observed from the output layer of BPNN model. The process parameters as factors and their levels are given at Table 2.1 for this research.
29
ANOVA method was used in order to analyze the parameter effects in this work. The mathematical models were obtained from the regression analysis and BPNN model.
Table 2.1 Process factors and their levels [Yang et al. (2012)]
According to the authors, higher pulse-on-time increased the MRR while decreased the Ra. Similarly increase in the wire tension resulted as a decrease in the CD. Finally, Yang et al. (2012) stated that the BPNN model had better predictions of the confirmation results than RSM method while optimizing relevant model.
Shabgard and Shotorbani (2010) also modeled EDM parameters mathematically for a welded steel workpiece material. In their work, not only some of the important EDM parameters such as peak current (I), pulse-on time (Ton) and voltage (V) but also the process outputs such as MRR, tool wear ratio (TWR) and Ra were modeled by employing DOE, RSM and multi linear regression techniques. The workpiece material was welded steel whereas tool material was selected as graphite. Output parameters of
30
this process were also fitted into a second-order polynomial equation. Figure 2.5 gives the predicted models for these outputs.
Figure 2.5 Plot of predicted values for each of the output parameters [Shabgard and Shotorbani (2010)]
As seen from Figure 2.5, Ra has a tendency to increase with an increase in current value and Ra is also proportional with voltage parameter. Furthermore, MRR output increases with a decreasing slope when there is an increase in voltage and current values. However, TWR value has an increasing slope while voltage and current are increasing. Shabgard and Shotorbani (2010) concluded their work by emphasizing the importance of reaching optimal parameter settings in terms of economical industrial machining.
Kuppan et al. (2008) also studied on the optimization of EDM process parameters. The experiments were investigated for drilling small deep holes on Inconel 718 with pure copper electrodes. In that work the output response were again MRR and depth average surface roughness (DASR) with the process parameters of electrode speed, duty factor, peak current and pulse-on time. In order to reach the optimal response of process parameters RSM method was used. The MRR increased with an increase in peak current, duty factor and electrode speed whereas the DASR increases with the increase of peak current and pulse-on time. However, when the electrode speed was raised, the
31
MRR also increases although the DASR decreases to its minimum value. Finally, for the Inconel 718 workpiece material the pulse-on time was insignificant on MRR whereas it has strong effects on DASR. Therefore, in order to reach better values of surface roughness, the pulse-on time should be low enough.
Sadeghi et al. (2011) also studied the optimization of WEDM cutting parameters through RSM method and Tabu Search (TS) algorithm. The authors stated that the main obstacle for WEDM parameter optimization is the diversity performance of attributed parameter settings because of the case specific feature of processes. Therefore, each research and experiment should be handled as separate case studies with different parameter settings and approaches. Moreover, for the WEDM applications MRR and SR outputs were the most useful characteristics. Therefore, after successful implementation of RSM method and several regression analyses, the effective process parameters were chosen as current, pulse interval, OC voltage and servo voltage. The MRR was fitted into a quadratic function, whereas the Ra was fitted into an exponential function. ANOVA was performed in order to evaluate the pairwise effects of parameters. Finally, TS algorithm was used in order to determine the optimal parameters for this WEDM application. The related plots for MRR and SR after ANOVA are depicted in Figure 2.6.
32
Figure 2.6 Plots for the investigation of mutual effect between MRR, SR and process parameters [Sadeghi et al. (2011)]
A different study was considered by Haddad et al. (2009) on the cylindrical wire electrical discharge turning process (CWEDT) in terms of selection and optimization of machining parameters through Taguchi's robust design for MRR, Ra and roundness outputs. ANOVA analysis was performed to determine the effective parameters. Also, the authors determined the relationship between these parameters by regression analysis. Finally the signal to noise ratio (SNR) analysis were used to find the optimal set of these effective parameters during the CWEDT process on the AISI D3 tool steel. Haddad et al. (2009) chose machining parameters as power (P), pulse off time (T), voltage (U) and spindle speed (W). The authors claimed that P and U are the most influential effects whereas W had the least significant effect on MRR that can be seen in Figure 2.7.
33
Figure 2.7 Fixed parameters and effects of selected parameters on MRR [Haddad et al. (2009)]
Haddad et al. (2009) also discussed the process parameters effects on Ra and roundness outputs. Figure 2.8 gives the relationship between the selected parameters and these outputs. Again, power and voltage were directly proportional to Ra and these two parameters were the most significant ones. It can be also seen that, the increase in the pulse of time and spindle speed result in a decrease in Ra value. Furthermore for the roundness, the pulse off time and spindle speed were the most important factors.
34
Figure 2.8 Effects of selected parameters on Ra and Roundness [Haddad et al. (2009)]
Qu (2002) studied cylindrical-WEDM (CWEDM) process in terms of MRR, Ra and roundness. MRR was modeled based on the part geometry for CWEDM. Carbide and brass work materials were used in the experiments. Different types of cutting configurations were tried with the objective of maximizing MRR. It was found that brass has higher MRR than carbide. Also CWEDM configuration has better MRR result than 2D-WEDM cutting configuration because of the flushing conditions of the process. The author claimed as a final result that the wire breakage may occur more likely when a steeper cutting angle was used. Qu (2002) also investigated the parameters which effect the surface roughness (Ra) and roundness. After conducting necessary experiments, Qu (2002) stated that the most important parameters for the Ra value are pulse on time and wire feed rate. It is also mentioned that obtaining higher MRR and achieving better Ra value are conflicting objectives for CWEDM and WEDM processes. Therefore, the author reached high MRR and poor Ra values in the first experimentation although lower MRR and better Ra values were obtained in the second experimentation.
35 2.3. Discussion
In the light of the findings summarized above, mainly the material removal rate (MRR), surface roughness (Ra), tool wear ratio (TWR), machining speed (Vc), and cutting width (Kerf) are considered as outputs. The important EDM/WEDM process parameters are given as power, servo voltage, wire tension, rotational speed, pulse on time, pulse off time, dielectric pressure, dielectric flow rate, peak current, feed rate, etc. Different statistical methods were used in order to determine the effective parameter sets.
Generally, the EDM / WEDM process parameters have direct or indirect effects on the process outputs. Power, current, voltage, pulse on time, pulse off time have direct influence on MRR and Ra, therefore they are the most significant process outputs. It can be claimed that, an increase in the current, voltage, power and pulse on-time results with an increase over the MRR and Ra values. The other parameters such as cutting speed, wire tension, feed rate, wire speed, spindle speed, dielectric pressure, etc. have less influence over the MRR and Ra values.
On the other side, an increase in the MRR values results with the decrease in machining times, which also incurs less machining cost. However, higher Ra values mean that the surface roughness detoriates during the process. Therefore, there is a trade-off between machining time and the quality of the surface. Hence, in this thesis study, this trade-off between MRR and Ra will be the main consideration.
36
Chapter 3
Experimental Setup
In this chapter, experimental setup used in this study is explained. The micro EDM machine used in this study allows performing die sinking EDM, wire EDM, block-EDM, and wire EDG processes. As a result, hybrid processing of tungsten or PCD blanks is possible without any setup changes. Possible EDM processes and their setups are shortly explained in this chapter.
3.1. Block EDM Process (Rough EDM)
The rough EDM process can be performed using a stationary tungsten (W) block as shown in Figure 3.1. This methodology is proposed by Perveen et al. (2012) for rough machining of tungsten carbide electrodes. The setup consists of rotating or moving tool electrode and a stationary electrode which is made from pure tungsten.
37
Figure 3.1 Machining of a micro tool by block EDM technique [Perveen et al. (2012)]
The goal of this process is to increase material removal rate by utilizing the high melting temperature of pure tungsten electrode. Therefore, the tool electrode diameter can be decreased in shorter machining times. The important issue here is the placement of pure tungsten block on the machine. Special care must be given to ensure parallelism between the side of the tungsten electrode and the tool electrode tool path. The cylindrical tool electrode is moved relative to the stationary tungsten block and desired tool shapes are achieved.
3.2. Wire Electro Discharge Grinding Process (WEDG)
WEDG (wire electro discharge grinding) technique is a special version of the micro WEDM method that was introduced firstly by Masuzawa et al. (1985). The WEDG process is considered as a finishing process where the purpose is to obtain good surface quality. The process parameters are selected such that the material removal rate is low
38
but the resulting surface quality is high. The polarity of the EDM process is set so that the wire is sacrified during the process. In every spark, a new part of the sacrificial wire is used therefore surface quality on the tool electrode is increased. It can be seen as an EDM - turning process where wire acts like a cutting tool. The basic representation of WEDG method is given in Figure 3.2.
Figure 3.2 Representation of WEDG Method [Masuzawa et al. (1985)]
Figure 3.3 is the top view of the WEDG system which shows the pulley system that directs wire during the process. The speed and tension of the wire in this system may affect the process quality therefore they must be controlled as well.
39
Figure 3.3 Sacrificial wire in WEDG process [Vallance et al. (2006)]
3.3. Experimental Setup
Figure 3.4 depicts the DT 110 - MICROTOOLS machine center whereas Figure 3.5 shows the hybrid WEDG and block-EDM setup which was used for the fabrication of micro tools in this study. On the left, block-EDM setup is seen. The WEDG setup is seen on the right hand side of the machine. The process is realized as submerged into the oil. DT 110 - MICROTOOLS is used for the micro tool fabrication.The micro EDM device is capable of 1 micrometer positioning accuracy. It employs necessary oil filtering system for a successful EDM process.
40
Figure 3.4 DT 110 MICROTOOLS
41
The blank micro PCD or WC tools are placed on the spindle system. The machine is programmed using necessary CNC codes. The spindle speed can be set between 100-5000 rpm. The machine allows users to set gap voltage, capacitance, and rotational speed of the tool electrode. It is equipped with a RC type transistor to generate sparks during process. A special EDM oil (108 MP-S) was used during the EDM processes. The properties of the materials are given below from Table 3.1 to Table 3.5.
Table 3.1 Properties of Tungsten Carbide (WC) Density (g/cm3) Melting Point (°C) Thermal Expansion Coefficient (K−1) Max.Compressive Strength(Mpa)
Max. Heat Fusion (kJ/kg)
15.63 2870 °C 5.8x10⁻⁶ 6833 560
Table 3.2 Properties of Polycrystalline Diamond (PCD) Density (g/cm3) Specific Heat Capacity (J/gK) Thermal Expansion Coefficient (K−1) Max.Compressive Strength(Mpa) Thermal Conductivity (W/mK) 3.52 0.52 1.0x10⁻⁶ 16530 2000
Table 3.3 Properties of the pure tungsten (W) Density (g/cm3) Melting Point (°C) Thermal Expansion Coefficient (K−1) Max.Compressive Strength(Mpa) Thermal Conductivity (W/mK) 19.25 3422 °C 4.5x10⁻⁶ 1150 173
42
Table 3.4 Properties of the brass wire Density (g/cm3) Melting Point (°C) Thermal Expansion Coefficient (K−1) Ultimate Strength(MPa) 8,4 940 18,7 550
Table 3.5 Properties of EDM fluid 108 MP-S
Material Density (kg/l) Flash point (°C) Aromatic hydrocarbon Distillation range IBP/FBP Kinetic viscosity at 20°C 108 MP-S 0.767 108 0,001 245/250 3 cSt
43
Chapter 4
Modeling of Wire Electro Discharge
Grinding (WEDG) Process
4.1. Introduction
In this chapter, wire electro discharge process will be modeled. First, WEDG process parameters will be defined and then machining time expressions will be derived. Finally, a process plan will be discussed with respect to the obtained WEDG process results. Experimental data from literature will be used to model material erosion rate and an analytical expression will be derived for surface roughness. We will extend the model for complex micro tool shapes.
4.2. General Effects of WEDG Process Parameters
There exists many important parameters that affect the WEDG process in general. However, in this thesis, the most important process parameters are selected as variables which are voltage, capacitance and feed rate through experimental knowledge.
44 4.2.1. Voltage
Voltage stands as an important parameter in deciding required discharge energy for WEDG applications especially for this kind of a micro study. Discharge energy is the electrical energy which turns into thermal energy during the process and determines the material removal process and surface roughness. Discharge energy can be controlled either by voltage or capacitance parameters during the fabrication process of micro tools. In this regard, voltage is one of the most important parameter which mainly affects material removal rate, machining time and surface roughness.
On one hand, from the experimental knowledge of EDM machine usage, one can claim that discharge energy is directly proportional to material removal rate and surface roughness. If open circuit voltage is increased, material removal rate increases. Small region of material is simultaneously worn both from the workpiece and micro tool. At the same time, the surface roughness values become higher when the open circuit voltage is excessive. In these kinds of situations, higher voltage means that the production of lower quality of electrodes due to high surface roughness which is undesirable for the end user of micro tools.
On the other hand voltage value is inversely proportional to machining time. The machining time will decrease in case of high voltage values because within a specified time the electrode will be worn and lose more material which decreases fabrication time.
4.2.2. Capacitance
Capacitance parameter is the second factor that affects discharge energy during the WEDG processes. Therefore previously mentioned relations between the energy, MRR,
45
machining time and surface roughness are also valid for capacitance parameter as well as the voltage parameter.
High capacitance values decrease the machining time, however this gives higher surface roughness because of high electrode wear. However, for large surfaces high capacitance value is needed, but as mentioned, it diminishes the surface quality of micro tool. Thus, lower capacitance values result with better surface qualities. Since this thesis needs precision, the capacitance values should be low enough at finishing stage. However at roughing process the capacitance can be used with its higher values in order to reduce the machining time.
Furthermore, when capacitance level is increased to its excessive levels during the fabrication of micro tool process, the particles resulting from the discharges may create undesirable arcs. Hence, these arcs may cause unwanted short circuit problems which decrease the quality, time and effectiveness of micro machining process. Thus, the capacitance value which affects directly the amount of energy per discharge should be carefully arranged.
4.2.3. Spindle Speed
Spindle speed is another parameter that has effects on the electrode fabrication process. Spindle speed affects indirectly the material removal rate; however, from experimental knowledge it has considerable effects on surface roughness.
In general for a micro EDM operation if the spindle speed increases, the MRR value decreases over time. The reason for this phenomenon is the turbulence of EDM fluid between the workpiece and the tool. When the spindle speed is increased the turbulence
46
increases in this region and the plasma channel occurrence was partially cancelled. Therefore the debris between work-piece and electrode was flushed away and removed which also prevents short circuits in the fabrication process. For the MRR issue, the spindle speed should be high enough over a determined range to remove the chips in this micro electrode fabrication study.
Spindle speed has further affects on surface roughness phenomenon. Generally, surface roughness has a decreasing trend if the spindle speed increases. However very high spindle speeds may cause saturation or unstability over the surface roughness values during the machining process.
4.2.4. Feed Length and Feed Rate
Feed length can be described as the offset distance of electrode inside the work-piece through the horizontal axis. The feed length is directly proportional to the material removal rate and inversely proportional to machining time. If the electrode feed length increases, MRR will also increase. Simultaneously, machining time will decrease because more material will be discharged and tool diameter will be reduced more drastically for a determined time interval. Moreover, feed length parameter also affects surface roughness because of the worn regions of tools and workpiece.
The feed rate is another important parameter. Feed rate is described as the speed of tool over the workpiece surface. Therefore feed rate is stated as the distance per time over the workpiece by the tool. Basically feed rate has impacts on machining time directly. If feed rate is increased then the machining time will decrease. However higher feed rates may cause undesirable short circuits. Therefore appropriate feed rate range should be selected while considering other effective parameters.
47 4.3. Process Parameter Definitions
As mentioned previously, the selected parameters for WEDG process are voltage, capacitance, and feed rate. In addition to those, wire diameter, wire tension, wire feed rate, tool rotational speed can also be selected. We will include all the process parameters in the model but only the voltage, capacitance, and feed rate will be considered as variables. Figure 4.1 shows the schematical view of WEDG process.
The machining time per piece, T (min) is given in Eq. (4.1) as follows:
= ( ×) (4.1)
=
By eq. (4.1), T can be calculated where D is the initial diameter of the micro electrode. V (mm/min) represents the cutting speed of micro electrode and L is the length of electrode (mm), N (rev/min) is the rotational speed of micro tool and f (mm) is the feed per revolution of the micro electrode with respect to the wire.
48
Figure 4.1 Schematical view of WEDG process
It must be noted that the length of wire, L (mm) and wire speed, V (mm/min) will determine how many tools can be prepared. If the wire runs out, the wire spool must be changed. Therefore, useable duration of the wire (T ) can be found as
= (4.2)
Number of tools that can be machined with one wire spool can be written as
49
The number of pieces per spool (n ) is used to find the spool change time per piece by dividing spool change time (T ) to n . Therefore, the total time per unit product, T (min) can be written as:
= + + (4.4)
where denotes handling and setup time, denotes actual WEDG time and tool change time per unit production . Substituting equation (4.1), (4.2) and (4.3) into (4.4), total time equation as a function of cutting speed is obtained. It must be noted that the length of wire on a spool is quite long. It can be assumed that the length of the wire is long enough to finish the fabrication of a micro tool. In this case, the last term in equation (4.5) can be neglected.
= + ( )
× +
[ ( ) ]
[ × × ] (4.5)
Equation (4.5) gives the machining time for only a single pass of the cylindrical shape electrode. As mentioned earlier, depending on the EDM parameters, the diameter reduction must be calculated. The parameter is defined as the depth of cut d and it is represented as follows:
= (4.6)
where is the initial diameter and the is the final diameter after single pass of the WEDG process. It must be noted that d is a function of voltage, capacitance, and feed rate of the electrode along the wire. In order to express the relationship between process
50
parameters and the depth of cut, wire electro discharge grinding process is modeled as shown below (Qu et al. 2002). According to the proposed model, a virtual circle with
radius exists around the wire which has a radius of . The radius mainly depends
on the selection of voltage and capacitance values. As the voltage and capacitance values increase, the radius increases and as a result more material is eroded from the surface. Figure 4.2 explains the influence of on the WEDG process. In order to proceed, the relationship between the process parameters and effective wire radius must be obtained experimentally.
Figure 4.2 Modeling of WEDG process [Qu et al. (2002)]
Hence, the depth of cut parameter, d, can also be represented by effective wire radius and the wire radius as shown below;
= -
4.4. Modeling of effective wire radius as a function of process parameters
The experimental data used in this section is taken from the work of Periyanan et al. (2011) where an identical EDM machine was used. The authors conducted an experimental study considering three factors with three levels each. Feed rate, capacitance and voltage are used as process parameters. Spindle speed, wire speed, wire
51
tension and wire diameter process parameters are kept constant. The selected levels for each factor are shown in Table 4.1. The values of fixed process parameters used in the experiment are also shown in Table 4.1.
Table 4.1 Process parameters and their ranges Levels
Low (0) Medium (1) High (2)
A: Feed rate (µm/sec) 2 4 6
B: Capacitance (nF) 0.1 1 10 C: Voltage (V) 80 100 120 Fixed Parameters Spindle Speed (rpm) Wire Speed (rev/hr)
Wire Tension Wire Diameter
(µm)
200 81 50% 200
A fractional factorial design was used in their experimental study. The levels of each factor are represented by a ‘0’ or a ‘1’ or a ‘2’ in the matrix. The experimental conditions with corresponding material erosion rate are shown in Table 4.2. Material erosion rate is measured by considering the weight change in the tools before and after the experiments.
52
Table 4.2 Experimental process parameters Exp. No. A B C Material Erosion Rate (mg/min) 1 0 0 0 0,02 2 0 1 1 0,06 3 0 2 2 0,15 4 1 0 0 0,05 5 1 1 1 0,14 6 1 2 2 0,39 7 2 0 0 0,05 8 2 1 1 0,13 9 2 2 2 0,14 10 0 0 1 0,03 11 0 1 2 0,07 12 0 2 0 0,06 13 1 0 1 0,07 14 1 1 2 0,32 15 1 2 0 0,09 16 2 0 1 0,08 17 2 1 2 0,14
53 18 2 2 0 0,11 19 0 0 2 0,06 20 0 1 0 0,03 21 0 2 1 0,1 22 1 0 2 0,12 23 1 1 0 0,06 24 1 2 1 0,33 25 2 0 2 0,1 26 2 1 0 0,07 27 2 2 1 0,13
The relevant outputs and conclusions of Periyanan (2012)’s research will be given in Appendix.
Based on the measurements, maximum material erosion rate was obtained at 6th experimental condition where the feed rate was set at medium level and capacitance and voltage were set at high levels. It must be noted that, according to the WEDG model shown in Figure 4.2, the material erosion rate measurement must be converted to effective wire radius, in millimeters. This can be easily done by considering the volume of the eroded tungsten carbide rod and its density. It is possible to use response surface methodology to represent the relationship between process inputs and process outputs using a quadratic model based on above given data set. Figure 4.3 shows that as voltage and capacitance increase material erosion rate increases as expected. However, material erosion rate is maximized at the medium level of feed rate. Equation 4.7
54
represents the relationship between process parameters and effective wire diameter using a quadratic model using coded process variables.
= 0.1891 + 0.0531 + 0.01244 + 0.0173 − 0.0238 + 0.0006 − 0.0016 (4.7)
By using the quadratic model for effective wire radius given in equation (4.7), the machining time required for reducing the tool diameter can be calculated. However, the micro end mills usually have more complicated shapes than a circular blank. In addition to that WEDG is usually considered as a finishing EDM operation. Therefore, complex shapes of micro end mills are considered in the next section.
Figure 4.3 Response surface methodology for effective wire radius
0.20.4 0.60.8 1 1.21.4 1.61.8 0.19 0.2 0.21 0.22 0.23 0.24 0.25 0.26 0.27 0.28 0.29 0.20.4 0.60.8 1 1.21.4 1.61.8 0.20.4 0.60.8 1 1.21.4 1.61.8 Voltage Capacitance Feed Rate
55
4.5. Finish machining time estimation for micro end mills having complex geometries
In order to satisfy an acceptable performance under micro machining/grinding conditions, the shapes of the micro end mills should satisfy certain conditions. The geometry of the micro end mill can be designed for a certain range of machining forces acting on the tool tip. They usually employ the tool body and a tapered section followed by a cylindrical section and finally the ball end mill section at the end of the blank. Some examples of the micro end mills are shown in Figure 4.4.
Figure 4.4 (a) A commercial PCD micro tool, (b) PCD micro tool fabricated at Bilkent
Figure 4.5 represents the general micro end mill tool geometry and the wire that travels along the surface to give the part its finished geometry. The effective wire radius is also shown again in the figure.
56
Figure 4.5 A general representation of micro end mill geometry
The surface speed of wire traveling along the tool is usually kept constant to obtain ideal surface quality as a result of EDM machining. The parametric representation of each geometrical segment on the tool body can be represented separately. The machining time calculation for the straight segment is already given in equation (4.5). The machining times for tapered and circular parts can be written according to Su and Chen (1999).
57
Figure 4.6 Linear and circular tool path formulations [Su and Chen (1999)]
= ∫ . . . = ∫ . . . . = . ‖ ‖ = ∫ . . . . = ∫ . . . ( + . sin ) = .. ‖ ( − ) − (cos − cos ) ‖ (4.8)
58
and are the machining time for linear (tapered) and circular sections, respectively. Therefore, the total machining time for the finish pass for the generalized micro end mill geometry is given as:
= .. ( (cos − cos )) + . .. + . + . .. (4.9)
Another important process output is the surface quality. It depends on the wire diameter used in machining and the feed value. As a result of the selection of these process parameters, a wavy surface is obtained on the surface which determines the surface roughness value. The actual surface roughness obtained as a result of EDM process may be different than a theoretical surface roughness due to lack of stability of the EDM process and material imperfections, wire vibrations, EDM fluid flushing imperfections etc. The theoretical calculation of surface roughness is shown in Figure 4.7.
Figure 4.7 Theoretical model for surface roughness prediction
59
2 2 2 / f r r h e e (4.10)It must be noted that the finishing pass machining time formulation for generalized end mill geometry does not depend on depth of cut. As a result, EDM parameters must be set at a level which will give the best surface quality. The effective wire radius for that condition must be selected. Based on our experience, the case where material removal rate is minimized, the best surface finish can be expected. This corresponds to 1st experimental case in Table 4.1 where process parameters are kept at their low levels. The effective wire diameter can be estimated from this case.
In the case of rough EDM machining, the general shape of the micro tool can be obtained by taking multiple passes as shown in Figure 4.8.
60
Depending on number of passes (n) and taper angle (Ɵ ), the total length can be calculated and the total machining time can be easily calculated by assuming constant feed rate. The total length of rough machining of the surface can be estimated as equation (4.11).
3 3 2 cos w e total r r n L L n L (4.11)Note that, is the same notation for the length of electrode in equation 4.5. Therefore, the total length of the rough machining surface can be used in equation 4.5 during the calculation of multi pass process time for rough machining.
The number of passes can be estimated according to equation (4.12). It must be noted that n must be an integer. Therefore, in order to reach the desired diameter, in some cases it is desirable to select EDM parameters so that unequal depths of cuts are taken.
re rw
D D n / 2 2 1 (4.12)In the roughing operation, the surface quality is not important therefore maximum material erosion rate conditions can be used. The amount of the material that will be left on the surface must be calculated according to the finishing pass parameters that will be used in that operation.
61
4.6. Process Planning for WEDG Process: A Numerical Example
A numerical example is given here to calculate the total machining time for a micro cutting tool. It is assumed that the micro tool will have a general geometry shown in Figure 4.8. The shaft diameter is given as 4 mm. The tool diameter is given as 0.5 mm. The length of the tool body is 5 mm, and the length of the tool tapered region is 5 mm. The process plan for this operation can be written as shown below in Table 4.3. It is assumed that the tool stock material already has a diameter of 4 mm, therefore only the tip section of the tool will be machined.
Table 4.3 Process Plan Operation
#
Name EDM Process
Parameters
EDM strategy Number of
passes 1 Straight EDM Voltage: High Capacitance : High Feed rate: Medium Roughing 35 2 Circular EDM Voltage: High Capacitance : High Feed rate: Medium Roughing 1
62 3 Straight EDM Voltage: High Capacitance : High Feed rate: Medium Roughing 1 4 Tapered EDM Voltage: High Capacitance : High Feed rate: Medium Roughing 1 5 Circular EDM Voltage: Low Capacitance : Low
Feed rate: Low
Finishing 1 6 Straight EDM Voltage: Low Capacitance : Low
Feed rate: Low
63 7 Tapered EDM Voltage: Low Capacitance : Low
Feed rate: Low
Finishing 1
The first operation is rough EDM operation where the EDM parameters corresponding to maximum material erosion rate is selected. These parameters are high levels of voltage and capacitance and medium level of feed rate. At this condition the effective wire radius is 0.25 mm, where the nominal wire radius is 0.2 mm. Therefore, the depth of cut for each pass is 0.05 mm. The diameter of 4 mm will reduced to 0.5 mm. The total depth of cut can be calculated as 1.75 mm. Consequently, the number of passes can be calculated as 1.75/0.05=35 during roughing pass. The machining time for each operation can be calculated according to Equations (4.8) and (4.9). These are shown in Table 4.4, below.
64
Table 4.4 Estimated Machining Times
Operation # Estimated Time (min)
1 1450 2 1.63 3 20.8 4 21.75 5 3.26 6 41.6 7 43.5
Total Time 1582.5 min (26 hours)
It can be seen that most of the time is spent during reduction of the tool diameter. It takes nearly a day to fabricate a micro tool. In order to decrease the total time, the first operation must be considered. It is obvious that wire discharge grinding method is not suitable for roughing operations therefore a hybrid methodology consisting of block- EDM and WEDG methods must be used in micro tool fabrication. The block-EDM methodology was described in Özdemir (2013).
65
Chapter 5
Conclusion and Future Work
In this thesis study, some aspects of the wire electro discharge grinding method have been investigated in order to obtain the suitable machining conditions and machining times for the fabrication of micro tools. During this study, the micro tools were processed by an electro dishcharge machine that is also capable of WEDG process. Commercially available blank tools were machined with the aim of reducing the diameter of these tools to micro levels with good surface roughnesses and lower machining times. In this study, the investigated process parameters, namely the variables, were selected as voltage, capacitance and feed rate.
The fabrication of micro tools includes a rough machining which was performed for the straight segments of the blank tool. The rough machining process will be followed by a finish machining stage that was performed for the circular and tapered parts of the micro tools.
A mathematical formulation of machining time for a single pass machining of a cylindrical shape electrode has been modeled for the rough machining stage. This
66
mathematical model can be used during the machining for straight segments of micro tools.
Furthermore in this study, the modeling of WEDG process was handled in terms of modeling effective wire radius as a function of selected process parameters. The experimental set from the study of Periyanan et al. (2011) was used. The experimental set was investigated by the fractional factorial design technique. The aim of modeling the effective wire radius was to calculate the total machining time including finish machining stages for tapered and circular segments of micro tools. The model of effective wire radius was then performed by using response surface methodology which was performed to represent the relationship between the process inputs and outputs through a quadratic model. The effective wire radius model can be used in the finishing stage of WEDG applications.
Moreover, a model for the estimation of general surface roughness during the micro tool fabrication was also studied in this thesis. With the help of these mathematical models, the total machining time and surface roughness value can be estimated by considering the effective process parameters which were voltage, capacitance and feed rate.
In this thesis, a process plan was studied in the lights of above mentioned model estimations. The total machining time for the fabrication of a micro tool was calculated. Performing only the WEDG operation results with a very long machining time. Therefore a suitable conclusion to this process plan can be suggested as using the WEDG process only in finishing operations. Hence, a hybrid EDM method was suggested in order to obtain a micro tool with a high precision. The suggested hybrid method consists of a block-EDM method and the WEDG process consequtively. The block-EDM method which is used in rough machining stage is investigated in Özdemir
![Figure 1.1 Applications for Different Types of Micro Products [Karpat et al. (2012)]](https://thumb-eu.123doks.com/thumbv2/9libnet/5883501.121498/12.892.170.795.218.531/figure-applications-different-types-micro-products-karpat-et.webp)
![Figure 1.6 Micro Tools Fabricated by FIB Method [Vasile et al. (1996)]](https://thumb-eu.123doks.com/thumbv2/9libnet/5883501.121498/20.892.198.758.549.863/figure-micro-tools-fabricated-fib-method-vasile-et.webp)