J Food Process Preserv. 2019;43:e13850. wileyonlinelibrary.com/journal/jfpp
|
1 of 14 https://doi.org/10.1111/jfpp.13850© 2018 Wiley Periodicals, Inc. Received: 15 May 2018
|
Revised: 28 September 2018|
Accepted: 2 November 2018DOI: 10.1111/jfpp.13850 O R I G I N A L A R T I C L E
The investigation of bioactive compounds of wine, grape juice
and boiled grape juice wastes
Mehmet Gülcü
1| Nurhan Uslu
2| Mehmet Musa Özcan
2| Fatma Gökmen
3|
Mustafa Mete Özcan
4| Tijana Banjanin
5| Sait Gezgin
3| Nesim Dursun
3|
Ümit Geçgel
6| Durmuş Ali Ceylan
7| Viktar Lemiasheuski
8 1Ministry of Food, Agriculture and Livestock Viticultural Research Station, Tekirdag, Turkey 2Faculty of Agriculture, Department of Food Engineering, Selcuk University, Konya, Turkey 3Agricultural Faculty, Department of Soil Science and Plant Nutrition, Selcuk University, Konya, Turkey 4Faculty of Veterinary Medicine, Selçuk University, Konya, Turkey 5Department of Horticulture, East Sarejova University, Sarekova, Bosnia-Herzegovia 6Faculty of Agriculture, Department of Food Engineering, Namık Kemal University, Tekirdağ, Turkey 7Çumra High Vocational College, Selçuk University, Konya, Turkey 8International Sakharov Environmental Institute of Belarusian State University, Minsk, Belarus Correspondence Mehmet Musa Özcan, Faculty of Agriculture, Department of Food Engineering, Selcuk University, 42031 Konya, Turkey. Email: [email protected]Abstract
In this study, bioactive compounds, oil, sugar, fatty acid, and mineral contents of grape wastes (pomace, skin, and seeds) obtained from wine, grape juice, and boilled grape juice production were investigated. Total phenol and tannin contents of grape by-products varied between 31.2 mgGAE/g (molasses skin) and 98.97 mgGAE/g (wine seed); 96.93 mgTAE/g (grape juice pomace) and 138.67 mgTAE/g (molasses pomace), respectively. The highest (377.57 g/kg) and lowest (20.00 g/kg) total sugars were determined in molasses and wine skin wastes, respectively. Epicatechin con-tents of samples were found between 439.67 mg/kg (molasses skin) and 3,444.57 mg/ kg (molasses seed). The lowest and highest linoleic acids were determined in molas-ses skin oil (40.00%) and grape juice skin oil (51.10%). α-Tocopherol contents of wine by-product oils changed between 3.35 mg/kg (seed) and 6.42 mg/kg (pomace). The lowest and highest P contents were determined in molasses skin (17,563 mg/kg) and wine seed (29,634 mg/kg), respectively.
Practical applications
The residue may represent from 13.5 to 14.5% at the total volume of grapes, and may reach 20%. The most abundant phenolic compound in wine pomace is anthocyanins concentrated in the skin, and flavonols present mostly in the grape seed (56–65% total flavonol). Grape is a phenol-rich plant, and these phenolics are mainly distrib-uted in the skin, stem, leaf, and seed of grape, rather than their juicy middle sections. Skins and seeds of grapes are produced in large quantities by the winemaking indus-try. These by-products have become valuable raw materials due to their high content of polyphenols, tocols, and other macro- and micronutrients. Seed and skins of grape produced in large quantities by the wine making industry have become valuable raw materials for extraction of polyphenols.1 | INTRODUCTION
The grape (Vitis vinifera L.) which has a long history of cultivation and utilization is one of the most important commercial fruit crops world-wide (Hussein & Abdrabba, 2015). Grape production is considered to be one of the most important agro economic activities in the world. Grape products such as wine, juice, and boiled juice are considered the most abundant fruit crop of world (Baydar, Özkan, & Yasar, 2007; Selçuk et al., 2011). The residue may represent from 13.5 to 14.5% at the total volume of grapes, and may reach 20% (Ahmad & Ali Siahsor, 2011; Rockenbach et al., 2011). The most abundant phenolic com-pounds in wine pomace are anthocyanins concentrated in the skin, and flavonols present mostly in the grape seed (56–65% total flavo-nol) (García-Lomillo & González-SanJosé 2017). Skins and seeds of grapes are produced in large quantities by the winemaking industry. These by-products have become valuable raw materials due to their high content of polyphenols, tocols, and other macro- and micro-nutrients (Yılmaz & Toledo, 2006). Therefore, grape seed, pomace, skin, and wine have a growing interest in recent years as nutritional supplements and easily accessible sources of natural antioxidants. Grape processing industry leads to the generation of large quanti-ties of wastes and serious environmental problem for disposal. The use of these wastes in feed or food supplements can contribute to lower production costs and to creating new feed mixtures and sources to improve the nutritive value of the animal or human nutri-tion (Fontana, Antoniolli, & Bottini, 2013). The grape byproducts are traditionally used as source of various products, such as alcoholic beverages (Arvanitoyannis, Ladas, & Mavromatis, 2006). The parts of grape are waste products of wineries and are often referred as im-portant agricultural and industrial waste with potentials to be used in pharmaceutical, food, and cosmetic applications (Freitas, Jacques, Richter, Loviane da Silva, & Caramao, 2008). The aim of this study was to investigate the bioactive properties and composition of grape wastes such as pomace, seed, and skin obtained from wine making, grape juice, and boiled grape juice production.
2 | MATERIAL AND METHODS
2.1 | Material
In this research, grape pomaces which was waste material of grape juice, wine, and boiled grape juice processing using Merlot grape variety was provided by Viticultural Research Institute, Tekirdag, Turkey. Grapes were harvested when in technological maturity (September 2017). The grapes harvested were washed, separated from stalks and shredded. A vertical basket press was used to press the grapes.
2.1.1 | Wine pomace
Crushed grapes were taken to the fermentation vessels. The mash was sulphating with 50 mg/L of 5% liquid SO2, and incubated with 30 g/L of Saccharomyces cerevisiae (Oenoferm Bouquet, Erbslöh
Geisenheim AG, Germany) yeast for 7–10 days under temperature controlled at room conditions for maceration/fermentation (macera-tion). At the end of this time, the remaining pomace to be left in fresh wine was used for research.
2.1.2 | Grape Juice pomace
In order to ensure passage of the color substances in the crust into the juice, crushed grapes were placed in the heating boiler and heated at 50°C for 1 hr. At the end of this period the grape juice was pressed and the remaining wet pomace will be used for the research.
2.1.3 | Boiled grape juice/mollases pomace
The grapes, which were separated from the bunches and ripened into mash, were squeezed with a basket of hydraulic press and then the remaining waste was used for research.
Raw pomaces was dried (at 50°C, 1 m/s air velocity) in a labo-ratory-scale tray dryer (EKSIS Industrial Drying Systems, Isparta, Turkey). The molasses seed, the wine seed and the grape juice seeds were obtained by manual separation after drying of the above-men-tioned pomaces. In addition, molasses skin, grape juice skin and wine skin parts are the remaining part after the seeds are separated from the dry pomaces.
2.2 | Methods
2.2.1 | Dry matter analysis
Grape pomace samples were weighed to empty drying cap. They dried at 70°C in the vacuum oven to until constant balance. Then they put to the desicator for cooling to room temperature and weighed. The moisture content of the samples was determined by dividing the difference between the initial weighing and the final weighing (Association of Official Analytical Chemists [AOAC], 1990).
2.2.2 | Water activity analysis
The water activities of the samples were measured with the Decagon AquaLab (4 TE Series Decagon Device, Pullman WA, ABD) water ac-tivity instrument. The samples (2–3 g) were weighed and placed in the chambers of instrument. When the temperatures of the samples were balanced by the instrument, the water activity value was read from the screen of the instrument.
2.2.3 | Determination of sugar content
Water extraction was used to obtain residual sugars. Dry and milled sample material was weighed in a capped tube, and at 80°C ultra pure water was added. The tubes were shaken with rotary shaker (Rotator, Dragon Laboratory Instruments) at 50 rpm for 1 hr at room tempera-ture. Then sample tubes were centrifuged at 4,500 rpm at 4°C for 10 min and supernatant was filtrated with 0.45 μm membrane filter
and transferred into a vial and used for analysis. Analysis of sugars was performed by Shimadzu-HPLC (isocratic program) equipped with a refractive index (RID-10A) detector. Separation of the sugars was performed on an Inertsil NH2 (5 μm, 250 × 4.6 mm I.D.) column, operating at 30°C column temperatures using acetonitril/water mix-ture (80/20 v/v) as a mobile phase in 1 ml/min flow rate. The cal-culation of concentrations was based on standards prepared in the laboratory.
2.2.4 | Sample Extraction
Grape pomace, skin, and seed samples were ground in a grinder. Pomace and seed powders were de-oiled with hexane as described by Yılmaz and Toledo (2006). Extraction of phenolic compounds and antioxidants or analysis was performed according to solid–liquid ex-traction method. Samples was weighed into a capped tube followed by addition of extraction solvent (80% aqueous methanol acidi-fied with 0.1% HCl). Solid-–liquid ratio for extraction was selected 1/10. The resulting mixture in tubes was shaken with rotary shaker (Rotator, Dragon Laboratory Instruments) at 70 rpm for 2 hr at room temperature. Then, the extracts were centrifuged at 4,500 rpm at 4°C for 10 min, after which the supernatants were collected into amber bottle. All extractions were conducted in triple.
2.2.5 | Determination of total phenolic content
The total phenolic contents of by products of grapes were deter-mined using the Folin-Ciocalteu method with micro scaleprotocol as described by Waterhouse (2002). Briefly, the methanolic solu-tion (40 μl) of extractor gallic acid standarts (50–500 mg/L), 3.16 ml water and 200 μl of Folin–Ciocalteau reagent were added to a 4 ml plastic cuvette. After 1–8 min, 600 μl solution of Na2CO3 (20%) were added. The content was mixed and held for 2 hr at room tempera-ture, the absorbance of the sample was measured at 765 nm against a blank using spectrophotometer (Shimadzu UV–Vis Mini 1240, Tokyo, Japan). The results were given as mg gallic acid equvalent per gram dry weight of sample (mg GAE/g dw).2.2.6 | Antioxidant activity
1,1-diphenyl-2-picrylhydrazil (DPPH) radical scavenging activity assay was used based on the methods of Brand-Williams, Cuvelier, and Berset (1995), as modified by Xu and Chang (2007). The different volume of extracts (25–50–75 μl), was mixed with 1.95 ml of 0.1 mM DPPH methanolic solution. The reaction mixture was left in the dark at room temperature for 30 min, and the absorbance was then measured at 517 nm against a blank. The percentage scavenging effect was calcu- lated as Scavenging rate (A0−A1/A0) × 100, where A0 was the absorb-ance of the control (without extract) and A1 was the absorbance in the presence of the extract. The free radical scavenging activity of sample was expressed as micromoles trolox equvalent per gram of dry weight (μmol TE/g dw) using the calibration curve of Trolox (20–1,000 μM).
2.2.7 | Total anthocyanin content
Total monomeric anthocyanin content was determined by the pH differential method as described by Giusti and Wrolstad (2001). Determinations were perfomed on a spectrophotometer (Shimadzu UV–Vis Mini 1240, Tokyo, Japan), measurements at 520 and 700 nm. Total monomeric anthocyanin concentration was expressed as mg malvidin 3-glucozid/g dw using a molar absorptivity of 28,000 and a molecular weight of 493.5.
2.2.8 | Total tannin content
The total tannin content was determined by a colorimetric assay based on procedures described by Associationof Official Analytical Chemists (AOAC) (1998). Briefly, methanolic solution (40 μl) of tannic acid standarts (100–1,000 mg/L), 3.36 ml water and 200 μl of Folin-Denisreagent were added to a 4 ml plastic cuvette. After 3–5 min, 400 μl saturated solution of Na2CO3 were added. The content was mixed and held for 30 min at room temperature, the absorbance of the sample was measured at 760 nm against a blank using spectro- photometer (Shimadzu UV–Vis Mini 1240, Tokyo, Japan). Total tan-nin content was calculated as mg tannic acid equvalent per gram of dry weight (mg TAE/g dw).
2.2.9 | Total flavonoid content
Total flavonoid contents of the grape by-product samples were determined according to the method described by Dewanto, Wu, Adom, and Liu (2002). The extract (1 ml) was mixed with 0.3 ml of 5% NaNO2 solution. After 5 min, 0.3 ml of 10% AlCl3 was added. At the 6th min, 2 ml of 1 M NaOH was added to the mixture. Immediately, 2.4 ml of distilled water was added and vortexed. The absorbance of the mixtures was recorded at 510 nm using a spectrophotometer. The results were calculated and expressed as catechin equivalents (mg CE/g dw) using the calibration curve of catechin.
2.2.10 | Determination of phenolic compounds
Phenolic compounds of samples were determined by a Shimadzu-HPLC equipped with a PDA detector and an Inertsil ODS-3 (5 μm; 4.6 × 250 mm) column. As mobile phases, 2% acetic acid in water (A) and acetonitrile (B) mixture were used. The flow rate of the mobile phase and the injection volume were 1 ml/min at 30°C and 20 μl, respectively. The gradient program was as noted: 0–10 min 5% B; 10–25 min 15% B; 25–30 min 15% B; 30–45 min 40% B; 45–50 min 80% B; and 50 to 100 min 5% B. The total running time for each sample was 60 min. The peak records were carried out at 280, 320, and 360 nm. Phenolic compounds were determined according to the retention time and absorption spectra of peaks of Standard com- pounds. The total are under the peak was used to quantify the phe-nolics (Halisçelik & Turmuş, 2017).2.2.11 | Oil content
Oil contents of grape waste samples were determined according to AOAC (1990). Total oils from grape waste samples were extracted by Soxhlet Apparatus for 5 hr using petroleum benzine (Merck, Darmstad, Germany) which was later removed using rotary evapora-tor at 50ºC. Oil was kept at the −18°C till analyses.
2.2.12 | Determination of Fatty Acids
Oil of grape wastes was esterificated according to ISO-5509 (2004) method. Fatty acid methyl esters of samples were analysed gas chromatography (Shimadzu GC-2010) equipped with flame-ioni-zation detector and capillary column (Tecnocroma TR-CN100, 60 m × 0.25 mm, film thickness: 0.20 µm). The temperature of in-jection block and dedector was 260ºC. Mobile phase was nitrogen with 1.51 ml/min flow rate. Total flow rate was 80 ml/min and split rate was also 1/40. Column temperature was programmed 120ºC for 5 min and increased 240ºC at 4ºC/min and held 25 min at 240ºC. Commercial mixtures of fatty acid methyl esters were used as refer-ence data for the relative retention times (AOAC, 1990).
2.2.13 | Tocopherol content
Tocopherol content of oil samples was performed according to Spika et al. (2015). The oil (0.1 g) was dissolved in 10 ml of n-hexane and filtered through a 0.45 µm nylon fitler. HPLC analyses of tocopherols were determined using Shimadzu-HPLC equipped with PDA detec-tor and LiChroCART Silica 60 (4.6 × 250 mm, 5µ; Merck, Darmstadt, Germany) column. Tocopherols were separated by isocratic chro-matography using a mobile phase of 0.7% propan-2-ol in n-hexane. The flow rate of the mobile phase was 0.9 ml/min, and the injec-tion volume was 20 µl. The peaks were recorded at 295 and 330 nm with PDA detector. The total running time per sample was 30 min. Standard solutions of tocopherols (α, β, γ, and δ-tocopherol) were constructed in the concentrations of 0–100 mg/L. All analyses were made in triplicate.2.2.14 | Determination of mineral
Grape waste samples were dried at 70ºC in a drying cabinet with air-circulation until they reached constant weight. The dried and ground samples (0.5 g) were digested by 5 ml of 65% HNO3 and 2 ml of 35% H2O2 in a closed microwave system (Cem-MARS Xpress). The volumes of the digested plant samples were completed to 20 ml with ultra-deionized water, and mineral contents were determined by ICP AES (Varian-Vista, Australia). Measurements of mineral con- centrations were checked using the certified values of related miner-als in the reference samples received from the National Institute of Standards and Technology (NIST; Gaithersburg, MD, USA) (Skujins, 1998). RF Power was 0.7–1.5 kw (1.2–1.3 kw for Axial), Plasma gas (Ar) and auxilary gas (Ar) flow rates were 10.5–15 L/min. (radial) and
1.5-15L/min″ (Axial), respectively. Viewing height was 5–12 mm. Copy and reading time was 1–5 s (max. 60 s)
2.2.15 | Statistical Analysis
A complete randomized split plot block design was used, and analy-sis of variance (ANOVA) was performed using JMP version 9.0 (SAS Inst. Inc., Cary, N.C. USA). All analyses were carried out triplicate and the results are mean ± SD (MSTAT C) of 25 independent grape by-products and grape processing method (Püskülcü & İkiz, 1989).
3 | RESULTS AND DISCUSSION
Physico-chemical properties and sugar contents of grape wastes (by-products: pomace, skin and seed) obtained from processed ripen Merlot grape fruits are illustrated in Table 1. While dry matter con-tents of waste samples change between 91.99% (molasses skin) and 95.56% (wine pomace), water activity values of waste products of processed grape fruits were 0.42% (molasses pomace) and 0.52% (grape juice seed). Also, total phenol and total tannin contents of grape by-products varied between 31.2 mg GAE/g (molasses skin) and 98.97 mgGAE/g (wine seed) to 96.93 mg TAE/g (grape juice pomace) and 138.67 mgTAE/g (molasses pomace), respectively. In addition, while total anthocyanin contents of wastes vary between 0.53 mg/g (grape juice pomace) and 2.17 mg/g (wine skin), total fla-vonoid contents of grape wastes changed between 10.33 mg CE/g (molasses skin) and 36.73 mg CE/g (molasses seed). Antioxidant activity values of grape fruit wastes changed between 31.97 TEAC µmol trolox/g (grape juice skin) and 49.73 TEAC µmol trolox/g (wine pomace) depending on processing and processed grape by-products. The highest total phenolic content was observed in seeds of molas- ses, wine and grape juice (especially wine seed, 98.97 mg/g) in com-parison pomace and skin of grape. Similarly, total flavonoid content of seeds (particularly molasses seed, 36.73 mg/g) had the maximum level. However, the highest total tannin content and antioxidant ac-tivity were observed in molasses pomace (138.67 mg/g) and wine pomace (49.73 μmol/g), respectively. In addition, total anthocyanin was not determined in molasses seed, wine seed, and grape juice seed samples. The grape pomace extract showed a significant radi-cal scavenging activity. The bioactive compound amount of grape skin was lower than other parts, such as pomace and seed.
Katalinic, Milos, Modun, Music, and Boban (2004) determined 739 mg/g total anthocyanins in the grape skin extract (fresh weight). Iacopini, Baldi, Storchi, and Sebastiani (2008) reported that the total anthocyanins content of the skin extracts for 10 studied grape va- rieties changed between 5.94 and 39.29 mg/g (dry weight). In addi-tion, total anthocyanin contents of grape pomaces were determined between 1.55 and 9.97 mg/g (dw) (Ky, Lorrain, Kolbas, Crozier, & Teissedre, 2014). Anthocyanin pigments were presented in the grape skin and their concentrations varied from 30 to 750 mg/100 g fruit (Bridle & Timberlake, 1997), in agreement with the values found in
this study. Anđelković et al. (2015) determined 67.40 mg/g (dw) total phenolic, 1.89 mg/g (dw) flavonols, 17.90 mg/g (dw) total antho-cyanins, and 1.160 EC50 (mg/ml dw) antioxidant activity in Vranac wine pomace. While the total phenolic contents of several grape seed extracts change between 522.49 and 546.50 mgGAE/g, the total phenolic contents of grape skin extracts varied between 22.73 and 43.75 mgGAE/g (Baydar, Babalık, Türk, & Çetin, 2011). While total tannin contents of grape pomaces change between 31.77 and 55.30 mg/g (dw), total phenol contents of pomaces varied between 17.14 and 31.59 mgGAE/g (dw) (Ky et al., 2014). Bail, Stuebiger, Unterweger, and Buchbauer (2008) reported a total phenol con-tent ranging from 59 to 115.5 mg/g as gallic acid in grape seed. In red grape pomace from vinification of four Brazilian varieties, the lowest total phenol content was found in the range of 32.32 g/kg (dw) (Isabel)–74.75 g/kg (dw) (Cabernet sauvingnon) (Rockenbach et al., 2011). Bozan, Tosun, and Özcan (2008) reported that grape seed contained 79.2–154.6 g/kg total phenol. In the seeds of four Greek varieties relatively high total polyphenols content has been recently determined ranging between 8.26 and 33.14 g/kg (dw) and seeds were particularly rich in monomeric flavan-3-ols and di-meric procyanidins (Anastasiadi, Pratsinis, Kletsas, Skaltsounis, & Haroutounian, 2010). Grape pomace extract contained 8.33 mg GAE/100 g total phenol (Pourali, Afrouziyeh, & Moghaddaszadeh-Ahrabi, 2014). Total phenol contents of grape pomaces ranged from 985 to 2,122 mg GAE/g (Lingua, Fabani, Daniel, Wunderlin, & Baroni, 2016). Goloshvili, Akhalkatsi, and Badridze (2018) reported that anthocyanin, total phenol and antioxidant activity values of grape seed and berry skins were determined between 1.74 (skin) and 8.64 mg/100 g (seed), 83.56 mg/100 g (skin) and 567.43 mg/100 g (seeds) and 12.45 mg/100 g (skin) and 91.33 mg/100 g (seeds), re-spectively. Total phenolic contents of skin extracts were lower than those of seeds as reported before by Iacopini et al. (2008). Total phenol contents of grape skin extracts changed between 34.8 mg GAE/g and 52.3 mg GAE/g (dw) (Ky et al., 2014). Sheng et al. (2017) reported that grape pericarp’s total phenol, proanthocyanidin and antioxidant activity (DPPH) values were determined between 38.12 and 85.61 mg GAE/g, 8.6 and 14.5 mg/g (dw) and 59.64 and 78.43%, respectively. In vitro ABTS radical scavenging activity values of dif-ferent grape wastes oils changed between 9.2 and 58.0 mg/100 µl (El Gengaihi, Aboul Ella, Hassan, Shalaby, & Abou Baker, 2013). Generally, total phenol content in seed extracts is higher than in skin extract for grapes and pomaces. Therefore, grape pomace poten-tially constituents a very abundant and relatively inexpensive source of a wide range of polyphenols including monomeric and oligomeric flavan-3-ols (Ky et al., 2014). Many authors have reported that the total phenolic content of grape seed was higher than that of the peel and pomace. So, grape seeds could be a valuable source of phenolics and antioxidants (Xu, Zhang, Cao, & Liu, 2010). Flavonoids are the most common and widely distributed group of plant phenolic com-pounds (Guo et al., 2012) and are generally categorized as phenolics depending on their chemical structure (Sung & Lee, 2010). Gonzalez-Manzano, Rivas-Gomzalo, and Santos-Buelag (2004) observed that the longer time used for macerating obtained the more phenolics
T A B LE 1 Ph ys ic o-ch em ic al p ro pe rt ie s an d su ga r c on te nt s of g ra pe w as te s (b y-pr od uc ts : p om ac e, s ki n, a nd s ee d) o bt ai ne d fr om p ro ce ss ed M er lo t g ra pe fr ui ts Sam ple s D ry m at te r ( % ) W at er A ct iv it y (% ) To ta l p he no l (m gG A E/ g dw ) To ta l t an ni n (m gT A E/ g dw ) To ta l an th oc yan in (m g/ g dw ) To ta l f la vo no id (m gC E/ g dw ) A nt io xi da nt ac tiv it y (T EA C µ m ol tr ol ox /g dw) Fr uc to se (g /k g dw ) G lu co se (g /k g dw ) Sa cc ha ro se (g /k g dw ) Σ S ug ar q ua nt ifi ed ( g/ kg d w ) M ola ss es p om ac e 93 .3 0 ± 0. 18 *c 0. 42 ± 0 .0 2 g 37 .6 ± 5 .0 9e f 13 8. 67 ± 4 .3 5a 1. 47 ± 0 .0 6c 15 .4 3 ± 0. 67 e 46 .5 3 ± 7. 11 b 145 .2 3 ± 2. 75 c 19 9. 8 ± 2. 3b – 345 .0 3 W in e po m ac e 95 .5 6 ± 0. 27 a* * 0. 48 ± 0.0 2e 58 .9 7 ± 1. 42 de 10 7. 23 ± 2 .0 5e 1. 30 ± 0 .1 0d 26 .9 3 ± 1. 76 c 49 .7 3 ± 3. 41 a 14 .1 7 ± 0. 06 h 14 .4 7 ± 0. 25 h – 28 .6 3 G ra pe ju ic e po m ac e 95 .1 5 ± 0.1 8a 0. 49 ± 0.0 3d 59 .6 ± 1 6. 37 d 96 .9 3 ± 7. 16 g 0. 53 ± 0.0 6f 20 .5 ± 1 .5 5d 46. 7o ±2 .6b 96 .8 7 ± 0. 06 d 10 2. 4 ± 0. 4d – 19 9. 23 Mo la sse s se ed 93 .8 7 ± 0. 40 c 0. 51 ± 0.0 1a b 94 .5 3 ± 5. 30 b 12 6. 07 ± 3 .7 1c – 36 .7 3 ± 0. 78 a 46 .6 7 ± 1. 81 b 27 .5 ± 0 .1 e 32 .1 7 ± 0. 45 e 12 .5 0 ± 0. 00 b 72 .2 W in e se ed 94 .1 7 ± 0. 21 b 0. 50 ± 0.0 1c 98 .9 73 .35 a 127 .1 3 ± 5. 75 b – 34 .6 ± 1 .5 6b 43 .0 3 ± 5. 15 c 17 .1 3 ± 0. 15 g 15 .2 ± 0 .4 g 10 .5 0 ± 0. 10 c 42 .8 7 G ra pe ju ic e se ed 94 .7 9 ± 0. 14 b 0. 52 ± 0.0 1a 92 .9 ± 2 .21 c 12 5. 2 ± 15 .7 5d – 36 .0 ± 1 .6 4a 41 .7 7 ± 3. 10 19 .3 3 ± 0. 15 f 21 .4 ± 0 .6 f 16 .7 7 ± 0. 55 a 57. 50 M ola ss es sk in 91 .9 1 ± 0. 17 d 0. 46 ± 0.0 1f 31 .2 ± 5 .7 7 h 96 .9 7 ± 4. 95 g 1. 80 ± 0 .1 b 10 .3 3 ± 1. 02 g 39 .4 ± 5 .8 0e 16 0. 1 ± 0. 90 b 21 7. 5 ± 2. 9a – 37 7. 57 W in e sk in 95 .5 2 ± 0. 17 a 0. 50 ± 0.0 2c 35 .3 ± 4 .9 7 g 97 .5 7 ± 5. 58 g 2. 17 ± 0 .0 6a 15 .8 7 ± 2. 11 e 40 .9 3 ± 4. 37 d 9. 3 ± 0. 0i 10. 73 ± 0.0 6i – 20.0 0 G ra pe ju ic e sk in 94 .2 6 ± 0. 09 b 0. 45 ± 0 .0 1 fg 36 .8 3 ± 5. 92 f 10 4. 93 ± 5 .2 3f 1. 0 ± 0. 1e 13 .4 ± 0 .7 f 31 .97 ± 1 .3 6f 16 8. 4 ± 0. 0a 17 4. 4 ± 1. 8c – 342 .7 7 *M ea n ± SD . * *V al ue s w ith in e ac h c ol om n f ol lo w ed b y d iff er en t l et te rs a re s ig ni fic an tly d iff er en t ( p < .0 5) .
and flavonoids. Therefore, the quantitative differences from pheno-lic profile among varieties are indicative of influence of genotype in the content of these metabolites (Liang et al., 2014). The chemi-cal composition of by-products generated by the wine industry can be influenced by environmental factors such as planting, harvest-ing, grape variety and also by the process to which it was subjected (Arnous & Meyer, 2009; Kammerer, Claus, Carle, & Schieber, 2004). Total phenolic content of grape skins and seeds varied with cultivar, genotypes, soil composition, climate, geographic origin, extraction procedures and cultivation practices or exposure to diseases, such as fungal infections (Bruno & Sparapano, 2007; Xu et al., 2010).
The highest (377.57 g/kg) and lowest (20.00 g/kg) total sugars were determined in molasses and wine skin wastes, respectively. Also, while fructose contents of grape by-products vary between 9.3 g/kg (wine skin) and 168.4 g/kg (grape juice skin), glucose con-tents of grape by-products were determined between 10.73 g/kg (wine skin) and 199.8 g/kg (molasses pomace). In addition, saccha-rose was determined in only molasses, grape juice and wine seeds wastes. Saccharose contents of grape by-products changed between 10.5 g/kg (wine seed) and 16.77 g/kg (grape juice seed). Saccharose content of molasses seed was 12.5 g/kg. Ovcharova et al. (2016) reported that grape fruits contained 3.9– 7.9% fructose, 5.9–18.7% glucose, 2.4–9.5% galactose, 0.3–1.1% xy-lose, and 0.3 and 2.3% rhamnose. Yamaguchi, Yoshimura, Nakazawa, and Ariga (1999) determined 7.79% glucose, 8.85% fructose, and 2.66% other sugars in grape seed extracts. Grape pomace contained 29.20% g/100 g carbohydrate, 8.91 g/100 g fructose, 7.95 g/100 g glucose, 46.17 g/100 g total dietary fibers, and 131.0 mg/100 g total anthocyanin (Sousa et al., 2014). Razuvaev (1980) shows that the composition of grape seeds before drying includes: 30–40% water, 8–10% oil, 3–7% tannin, 1–2% minerals and 8–10% oil, 44–57% cellulose.
The phenolic compounds of grape by-products (pomace, skin, seed) are given in Table 2. The abundant phenolic compounds was epicatechin, and followed by (+)-catechin, gallic acid, syringic, caftaric acid, and quercetin. While epicatechin contents of samples change between 439.67 mg/kg (molasses skin) and 3,444.57 mg/kg (molasses seed), (+)-catechin contents of grape by–products varied between 313.03 mg/kg (molasses skin) and 2,406.3 mg/kg (molas-ses seed). Gallic acid contents of grape wastes were determined between 42.5 mg/kg (grape juice skin) and 205.37 mg/kg (molasses seed). In addition, syringic acid contents of grape wastes varied be-tween 41.1 mg/kg (grape juice pomace) and 176.7 mg/kg (wine skin). In addition, trans-resveratrol contents of grape wastes changed be-tween 4.0 mg/kg (wine seed) and 42.47 mg/kg (grape juice skin). While caftaric acid contents of grape by-products change between 17.8 mg/kg (wine skin) and 178.73 mg/kg (grape juice skin), querce-tin contents of grape wastes were determined between 13.33 mg/ kg (molasses seed) and 63.6 mg/kg (wine skin). The kaempferol contents of samples changed between 0.37 mg/kg (wine seed) and 67.13 mg/kg (molasses skin). Grape seed wastes’s kaempferol con-tents were found lower compared to kaempferol results of other grape wastes tested. The highest chlorogenic (42.43 mg/kg) and TA
B LE 2 Ph en ol ic c om po un ds o f g ra pe b y-pr od uc ts (p om ac e, s ki n, a nd s ee d) o bt ai ne d fr om p ro ce ss ed M er lo t g ra pe fr ui ts (m g/ kg d w ) Sam ple s G alli c (+ )-ca te ch in V an illi c Sy rin gic Epic at ech in C af ta ric C hl orog eni c C af feic Fe rul ic t-re sv er at ro l Ru tin tr ih yd rate K ae mp fe ro l− 3-gl uc os id e Q uer ce tin M ola ss es p om ac e 55 .0 ± 4 .9 5* g 71 7. 8 ± 6. 76 f 47 .0 ± 6 .8 6 g 11 3. 83 ± 5 .1 1 b 90 3. 33 ± 7 0.0 5f 39 .6 7 ± 3. 69 c 6. 67 ± 0 .4 9d e 4. 9 ± 0. 6d 2. 9 ± 0. 0b c 18 .8 3 ± 1. 36 d 18 .3 3 ± 4. 07 b 53 .3 7 ± 3. 31 b 17 .5 3 ± 1. 19 e W in e po m ac e 99 .0 ± 2 .6 9d ** 1, 12 6. 87 ± 3 0. 21 d 15 7. 27 ± 2 9. 79 e 63 .5 7 ± 6. 18 d 1, 46 9. 8 ± 21 .4 7d 25 .9 ± 1 .5 5 g 5. 57 ± 0 .2 1 3. 17 ± 0 .8 5e f 2. 87 ± 0 .1 2c 13 .6 7 ± 1. 10 f 18 .5 7 ± 1. 45 b 6. 2 ± 0. 26 f 51 .3 ± 2 .2 6b G ra pe ju ic e po m ac e 63 .47 ± 2 .17 f 925. 03 ± 2 9. 05 e 59 .6 3 ± 5. 46 f 41 .1 ± 4 .3 3 h 1, 23 1. 0 ± 50 .1 9e 11 9. 23 ± 6 .9 0b 31 .0 ± 0 .8 0b 14 .2 7 ± 0. 90 b 2. 87 ± 0 .1 2c 28 .4 3 ± 0. 95 b 9. 67 ± 1 .1 2e 16 .4 7 ± 0. 91 d 20.0 3 ± 0. 65 c M ol as se s se ed 20 5. 37 ± 3 .8 4c 2, 40 6. 3 ± 51 .5 4a 25 5. 2 ± 8. 57 b 45 .5 ± 0 .7 2 g 3, 44 4. 57 ± 8 9. 73 a 22 .9 7 ± 2. 84 h 6. 77 ± 0 .4 9d 1. 1 ± 0. 1 h 2. 27 ± 1 .0 9d 7. 1 ± 2. 25 h 20 .3 7 ± 1. 89 a 2. 23 ± 0 .3 2 g 13 .3 3 ± 0. 45 g W in e se ed 16 6. 97 ± 16 .0 3a 19 36 .9 7 ± 51 .8 2c 25 1. 53 ± 5 .5 6c 49 .8 3 ± 3. 27 f 2, 62 5. 3 ± 68 .9 9c 29 .7 3 ± 0. 64 e 7. 67 ± 0 .4 0 cd 1. 03 ± 0 .0 6 gh 1.0 3 ± 0.0 de 4. 0 ± 0. 6ı 20 .07 ± 1 .7 4a 0. 37 ± 0 .1 5h i 19 .6 ± 0 .9 cd G ra pe ju ic e se ed 11 9. 43 ± 1 0. 70 b 19 40 .5 7 ± 12 2. 81 b 28 2. 10 ± 1 7. 91 a 51 .3 3 ± 4. 70 e 2, 681 .7 ± 1 60 .8 7b 27 .4 7 ± 0. 87 f 7. 7 ± 1. 2c 1. 73 ± 0 .0 6 g 2. 83 ± 0 .0 6c 10 .1 ± 0 .4 6 g 19 .8 ± 1 .0 ab 0. 63 ± 0 .3 5h 13 .6 3 ± 0. 45 g M ola ss es s kin 27 .0 3 ± 1. 55 i 31 3. 03 ± 1 5. 17 ı 30 .4 3 ± 3. 09 h 83 .07 ± 2 .4 6c 43 9. 67 ± 1 5. 08 i 32 .8 7 ± 1. 36 d 3. 93 ± 0 .6 4f 5. 27 ± 0 .1 5c 3. 83 ± 0 .3 1b 20 .9 3 ± 4.9 2c 13 .1 3 ± 0. 81 c 67 .1 3 ± 2.1 0a 14 .07 ± 0 .7 6f W in e sk in 66 .4 ± 1 .3 1e 66 3. 27 ± 1 2. 96 g 16 0.0 ± 6 .0 1d 17 6. 7 ± 5. 27 a 86 6. 63 ± 2 4. 25 g 17 .8 ± 0 .4 6i 3. 73 ± 1 .4 6 fg 3. 6 ± 0. 26 e 5. 2 ± 0. 46 a 16 .3 3 ± 0. 64 e 12 .4 3 cd ±1 .5 4 11 .9 3 ± 0. 51e 63 .6 ± 1 .2 a G ra pe ju ic e sk in 42 .5 ± 1 .4 8 h 43 9. 83 ± 1 0. 92 h 4. 13 ± 1 .8 5i 20 .4 7 ± 1. 27 i 50 8. 13 ± 8 .81 h 17 8. 73 ± 3 .81 a 42 .4 3 ± 0. 06 a 23 .9 7 ± 0. 31 a 3. 37 ± 0 .2 1b c 42 .4 7 ± 2. 53 a 11 .4 7 ± 0. 40 d 26 .7 3 ± 0. 60 c 19 .8 7 ± 1. 08 cd *M ea n ± SD . * *V al ue s w ith in e ac h c ol om n f ol lo w ed b y d iff er en t l et te rs a re s ig ni fic an tly d iff er en t ( p < .0 5) .
caffeic acids (23.97 mg/kg) were found in the skin of grape to be process to grape juice. Ferulic acid contents of grape by-products were determined between 1.03 mg/kg (wine seed) and 5.2 mg/kg (wine skin). Generally, while (+)-catechin, vanillic, (−)-epicatechin, and rutin trihydrate contents of seed wastes are found higher, caf-feic, trans-resveratrol, kaempferol, and ferulic acids of waste seeds were found lower compared to results of other grape wastes tested. Molasses seed was a significant source of gallic acid (205.37 mg/ kg), (+)-catechin (2,406.3 mg/kg), and epicatechin (3,444.57 mg/kg). Additionally, grape juice seed had the highest vanillic acid content (282.10 mg/kg), syringic (176.7 mg/kg), and quercetin amounts of wine skin were in the maximum level. Grape juice skin was rich in caftaric (178.73 mg/kg), chlorogenic (42.43 mg/kg), and t-resver-atrol (42.47 mg/kg) when compared to other grape by-products. The contents of polyphenolic compounds were different in various cultivars.
Godevac, Tesevic, Velickovic, Vujisic, and Milosavljevic (2010) reported that some grape cultivars grown in Serbia contained 4.30–22.48 mg/100 g gallic acid, 0.78–2.44 mg/100 g proto-catechuic acid, 0.81–7.04 mg/100 g caftaric acid, and 0.24– 1.43 mg/100 g p-hydroxybenzoic acids. Mikeš, Vrchotová, Tříska, Kyselákova, and Šmidrkal (2008) reported that frozen fresh grapes contained 1.8–13.3 mg/kg gallic acid, 70.3–659.1 mg/kg catechin, 67.1–467.3 mg/kg epicatechin, 0.1–1.5 mg/kg trans-resveratrol and 0.01–0.13 mg/kg epicatechin, 0.1–1.5 mg/kg pterostilbene. Syrah grape pomace contained 9.8 mg/kg kaempferol, 2.2 mg/kg myrice-tin, 0.30 laricitrin, 0.40 syringetin, 93.0 quercetin, 16.1 isorhamnetin, 26.5 isoquercetin, 11.4 myricetin-3-glucosid, 7.6 astilbin, 21.8 (+)-catechin, 27.2(−)-epicatechin and 14.7 epicatechin gallate. Palomino, Gómez-Serranillos, Slowing, Carretero, and Villar (2000) found 0.96 mg/kg (fw) of trans-resveratrol in whole berries. Resveratrol is present mostly in the grape skin. Its content varies in different va-rieties of grape as well as in different cultivars (Soleas, Diamandis, & Goldberg, 1997). Careri, Corradini, Elviri, Nicoletti, and Zagnoni (2003) found 2.75 mg/100 g trans-resveratrol in grape skin extract. The stems of Vitis vinifera were found to be the richest source of res-veratrol, its content reached up to 500 mg/kg dry matter (Melzoch, Hanzlíková, Filip, Buckiová, & Šmidrkal, 2001). During the ripening process of grapes, the amount of resveratrol increases progressively (Sun, Ribes, Leandro, Belchior, & Spranger, 2006). Grape skin is an ex-cellent source of phenolic compounds, such as flavan-3-ols, phenolic acids, (+)-catechins, proanthocyanidins, flavonols, and anthocyanins (Hygreeva, Pandey, & Radhakrishna, 2014). Grape pomace consists of skins, seeds and stem, which are considered good sources of phe-nolic compounds, and dietary fiber (Deng, Penner, & Zhao, 2011; Yu & Ahmedna, 2013). Grape seed contained 1.45 mg/100 g vanillic acid, 779.57 mg/100 g catechin, 8,729.55 mg/100 g protocatechuic, 11.89 mg/100 g coumarin, 889.20 mg/100 g gallic, 13.0 mg/100 g ferulic, 5,533.14 mg/100 g catechol, 4,039.26 mg/100 g chloro-genic, 440.30 mg/100 g syringic, 58.68 mg/100 g pyrogallol, and 7.25 mg/100 g caffeic acids (Hussein & Abdrabba, 2015). Anđelković et al. (2015) reported that Vranac grape pomace contained 3.33 mg/g (dw) gallic acid, 3.84 (+)-catechin, 0.41 mg/g trans-coutaric acid,
0.50 mg/g caffeic acid, 1.22 mg/g (−)-epicatechin and 21.68 mg/g total anthocyanins. Catechin and epicatechin contents of grape seeds obtained from wine process and juice process were determined as 0.22 and 0.28 mg/g, 5.65 and 5.91 mg/g, 0.22 and 0.23 mg/g, 5.57 and 5.67 mg/g, respectively (Samavardhana, Supawititpattana, Jittrepotch, Rojsuntornkitti, & Kongbangkerd, 2015). Catechin and epicatechin are major flavanols found in grape seeds and catechin usually displays similar level in some grape varieties (Chedea et al., 2010). Grape pomace contains multiple types of phenolic com-pounds, such as anthocyanins, flavonols, and stilbenes (Deng et al., 2011; Yang, Martinson, & Liu, 2009). Grape composition depends on variety, vineyard location and the technological parameters during wine and grape juice making process, such as crushing, maceration, and pressing. Contents of phenolic compounds determined in seed extracts were changed depending on the process types. (+)-catechin and (−)-epicatechin were the most abundant phenolic compounds in the grape seed extracts, and these results confirmed by Revilla and Ryan (2000), Anđelković et al. (2015), Hussein and Abdrabba, (2015) and Samavardhana et al. (2015). Quantitative and qualitative distribution of polyphenols in grape pomaces showed significant dif-ferences (p < .05).
The oil contents of grape by-products are presented in Table 3. While the oil contents of grape juice wastes change between 4% (skin) and 12.95% (seed), the oil contents of wine wastes ranged from 6.95% (skin) to 14.40% (seed). In addition, oil contents of boiled grape juice (molasses) varied between 4.20% (skin) and 12.00% (seed). In general, the oil contents of skin of all processed grape wastes were found lower than those of other grape by-products (pomace and seed). The oil contents of the grape pomace due to the seeds inside it were partially higher when compared to the skin. The oil content of grape seeds varies between 8 and 20% (Ahmadi & Siahsan, 2011; Baydar, Özkan, & Yasar, 2007; Yousafi, Nataghi, & Gholamian, 2013). The oil yield from the seeds of grape was 16.63% (Hussein & Abdrabba, 2015). Grape seeds contained 6.26–9.01% oil (Mironeasa, Leahu, Codină, Stroe, & Mironeas, 2010). El Gengaihi et al. (2013) reported that grape seed and pomace contained 11.8–12% and 3.1%, and 9.5% oil. The analysis of the fatty acid composition of the grape by prod-uct’s oils is performed by the GC apparatus under conditions de-scribed in the experimental parts (Table 3). Palmitic, oleic, and linoleic acids were the abundant fatty acids in all waste oils. While palmitic acid contents of grape juice waste oils change between 7.61 (seed, Figure 1a) and 17.97% (pomace, Figure 1b), palmitic acid contents of wine waste oils varied between 7.86% (seed, Figure 1d) and 17.50% (skin, Figure 1f). In addition, palmitic acid contents of molasses’s (grape boiled juice) waste oils were determined between 7.71 (seed) and 19.77% (skin). The highest fatty acid was linoleic acid, followed by oleic, palmitic, and stearic acids. In general, the lowest palmitic acid was detected in seed oils from grape by-products. The high content of palmitic acid in the pomace and skin may be due to the excess of saturated compounds in the pomace and skin waxy struc-ture. While oleic acid contents of grape juice by-product’s oils are determined between 14.44 (seed) and 27.05% (pomace), oleic acid
T A B LE 3 O il co nt en ts a nd fa tt y ac id c om po si tio n (% ) a nd to co ph er ol c on te nt s (m g/ kg ) o f t he g ra pe b y pr od uc t’s o ils o bt ai ne d fr om p ro ce ss ed M er lo t g ra pe fr ui ts G ra pe j ui ce b y p ro du ct s W in e b y p ro du ct s Mola ss es b y‐ pr od uc t po m ac e sk in se ed po m ac e sk in se ed po m ac e sk in se ed Fa tt y a ci ds O il c onte nt s 6.0 0 ± 0. 30* d 4. 00 ± 0 .2 0e 12 .9 5 ± 0. 25 b 8. 90 ± 0 .1 0c 6. 95 ± 0 .2 5d 14 .4 0 ± 0. 20 a 4. 75 ± 0 .5 5e 4. 20 ± 0 .1 0e 12 .0 0 ± 0. 30 b M yr is tic 0. 43 ± 0.0 7a ** 0. 28 ± 0 .1 5d 0.0 7 ± 0.0 1f 0. 22 ± 0.0 2e 0. 32 ± 0.0 1c 0.0 5 ± 0.0 0g 0. 22 ± 0.0 3e 0. 34 ± 0.0 1b 0.0 7 ± 0.0 2f Pa lmi tic 17 .97 ± 0 .31 b 14 .2 4 ± 0. 09 d 7. 61 ± 0 .1 1e 16 .4 0 ± 0. 03 c 17 .5 0 ± 0. 47 b 7. 86 ± 0 .0 6e 17 .7 5 ± 0. 30 b 19 .7 7 ± 0. 29 a 7. 71 ± 0 .1 2e St ea ric 6.1 0 ± 0.1 3c 6. 44 ± 0 .0 8c 3. 44 ± 0 .0 1d 7. 46 ± 0 .0 2b 7. 63 ± 0 .0 1b 3. 34 ± 0 .0 1d 7. 95 ± 0 .2 1b 8. 73 ± 0 .0 4a 3. 48 ± 0 .0 9d Ela idic 0. 11 ± 0 .0 0 cd 0.0 5 ± 0.0 5d 0.0 2 ± 0.0 2e 0. 15 ± 0.0 1b c 0. 16 ± 0.0 2b 0.0 2 ± 0.0 2e 0. 22 ± 0.0 1a 0. 13 ± 0.0 1c – O leic 27 .0 5 ± 0. 30 b 24 .6 5 ± 0. 02 c 14 .4 4 ± 0. 26 e 22 .3 7 ± 0. 0d 28 .0 8 ± 0. 14 a 13 .6 4 ± 0. 01 f 28 .0 7 ± 0. 11 a 27 .7 4 ± 0. 08 b 14 .3 5 ± 0. 36 e Lin ol el ea id ic 0.0 6 ± 0.0 6b 0. 13 ± 0.0 3a 0.0 3 ± 0.0 3c –*** – – – – – Lin ol eic 45 .9 7 ± 0. 32d 51 .1 0 ± 0. 05 c 73 .0 6 ± 0. 30 a 50 .78 ± 0 .0 8 cd 42 .3 9 ± 0. 19 f 73 .7 9 ± 0. 05 a 43 .1 8 ± 0. 02 e 40.0 ± 0.0 7 g 70 .8 9 ± 1. 57 b A ra ch idic 0. 37 ± 0 .2 4e 0. 90 ± 0.0 4b 0. 11 ± 0 .0 9 g 0. 58 ± 0.0 0d 1. 27 ± 0 .0 9a 0. 17 ± 0.0 0f 0. 70 ± 0.0 0c 1. 12 ± 0 .0 2a b 0. 17 ± 0.0 1f Lin ol en ic 0. 19 ± 0.0 9de 0. 39 ± 0.0 1a 0. 25 ± 0.0 0c 0. 20 ± 0 .0 2d 0. 39 ± 0.0 1a 0. 27 ± 0.0 1b 0. 12 ± 0.0 0f 0. 17 ± 0.0 0e 0. 26 ± 0.0 1b c B eh en ic 0. 22 ± 0.0 4b c 0. 30 ± 0.0 2b 0.0 5 ± 0.0 0d 0. 30 ± 0.0 2b 0. 82 ± 0.0 0a 0.0 2 ± 0.0 2d 0. 22 ± 0.0 2b c 0. 29 ± 0 .1 1b 0.0 5 ± 0.0 0d A ra ch id on ic 0. 17 ± 0.0 1a 0. 12 ± 0.0 4c 0.0 5 ± 0.0 5de 0. 12 ± 0.0 0c 0. 12 ± 0.0 1c – 0. 12 ± 0.0 1c 0. 13 ± 0 .0 9b 0.0 7 ± 0.0 2d To co ph ero ls D L- α-toc oph -ero l 3. 31 ± 0 .4 2c 1. 80 ± 1 .2 7e 2. 99 ± 0 .0 7d 6. 42 ± 0 .78 a 3. 76 ± 0 .3 8c 3. 35 ± 0 .0 3 4. 94 ± 0 .4 0b 1. 06 ± 0 .4 9e 3. 20 ± 0 .0 8c β-to co phe ro l 6. 70 ± 3 .1 3b 10 .9 3 ± 6. 07 a 2. 70 ± 0 .0 7c 2. 37 ± 0 .0 1c 2. 40 ± 0 .1 5c 2. 73 ± 0 .0 4c 2. 27 ± 0 .0 3c 6. 00 ± 0 .0 9b 2. 55 ± 0 .0 4c ɣ-to co phe ro l 7. 12 ± 0 .1 5 g 25 .66 ± 0.0 4b 11 .3 4 ± 0. 14 d 3. 76 ± 0 .8 6ı 5. 73 ± 1 .8 2 h 8. 48 ± 0 .1 2f 9. 77 ± 0.0 3e 79 .7 9 ± 0. 12 a 12 .8 1 ± 0. 22 c δ-to co phe ro l 1. 86 ± 0 .1 3c 0. 63 ± 0. 90 d – 2. 17 ± 0 .0 0b 2. 04 ± 0 .0 9b 3.0 4 ± 0.0 6a 1. 88 ± 0 .0 5c 2. 29 ± 0.0 3b – *M ea n ± SD . * *V al ue s w ith in e ac h r ow f ol lo w ed b y d iff er en t l et te rs a re s ig ni fic an tly d iff er en t ( p < .0 5) . * ** N on de te rm in ed .
contents of wine by-product’s oils changed between 13.64 (seed) and 28.08% (skin). Also, oleic acid contents of grape boiled juice’s oils varied between 14.35 (seed) and 28.07% (pomace, Figure 1h). As with palmitic acid, the oleic acid contents of seed oils from grape by-products (pomace, skin and seed) were found to be low. It has been determined that grape pomace (pulp and skin) oils contained F I G U R E 1 Chromatograms of fatty acid compositions belong to grape wastes (pomace, skin and seeds) (a-Seed of grape juice; b-Pomace of grape juice; c-Skin of grape juice; d-Seed of wine; e-Pomace of wine; f-Skin of wine; g-Seed of molasses [Colour figure can be viewed at wileyonlinelibrary.com]
oleic acid in low proportion according to the seed oils. Linoleic acid, the dominant fatty acid of grape by-product oils, was higher in all samples than the other fatty acids. The highest linoleic acid was found in seed oils of all grape by-products, and their values changed between 70.89 (boiled grape juice seed oil) and 73.79% (wine seed oil). While linoleic acid contents of grape pomace oils vary between 43.18 (molasses seed, Figure 1g) and 50.78% (wine pomace oil, Figure 1e), linoleic acid contents of grape juice skin oils changed be-tween 40.00 (molasses skin oil, Figure 1i) and 51.10% (grape juice skin oil, Figure 1c). Generally, the contents of linoleic acid in molas- ses by-product oils are relatively low compared to other grape by-product oils. But, the stearic acid contents of molasses (grape boiled juice) oils were found to be relatively higher when compared to other grape by-product oil samples.
Anđelković et al. (2015) determined 6.6% palmitic, 72.4% lin- oleic, 16.3% oleic, 4.1% stearic, 0.1% linolenic, and 0.1% palmitolin-oleic in the grape pomace oil. The most common fatty acids were linoleic, oleic, palmitic, and stearic acid (Table 3). The major fatty acid in the grape pomace oil was linoleic acid. The fatty acid com-position of the grape pomace oils were found similar to the oils of sunflower, safflower, soybean, poppy, and maize, which belong to the linoleic type (Baydar, Özkan, & Yasar, 2007). The grape pomace oil was rather poor in linolenic acid. Ovcharova et al. (2016) reported that grape seed oils contained 8.8–11.5% palmitic, 0.8–1.0% stearic, 16.3–18.7% oleic, 68.5 and 72.2% linoleic, and 0.2–0.5% linolenic acids. Grape seed oil contains 11.87% palmitic, 0.66% palmitoleic, 5.78% stearic, 25.81% oleic, 55.30% linoleic, and 0.35% arachidonic acids (Hussein & Abdrabba, 2015). The grape seed oil is rich in lin-oleic acid (65–72%), acids (Hussein & Abdrabba, 2015). The grape seed oil is rich in lin-oleic (12–23%), palmitic (4–11%), and stearic (8.5–15%) (Yousafi et al., 2013). In previous studies, grape pomace oil contained 8.60–10.63% palmitic, 3.58–4.59% stearic, 16.07– 22.57% oleic, 61.16–69.97% linoleic, and 0.47–0.63% linolenic acids (Barron, Celaa, Santa-Maria, & Corzo, 1988; Beveridge, Girard, Kopp, & Drover, 2005; Göktürk Baydar & Akkurt, 2001). Fatty acid compo-sition of grape seed oil is also similar to that of classic sunflower oil, where linoleic and oleic acids are the main components (Ovcharova et al., 2016). Grape seeds are mainly valued for the nutritional properties of the oils, which is rich in unsaturated fatty acids (oleic and linoleic) and phenolic compounds (Bail et al., 2008; Hanganu, Todasca, Chira, Maganu, & Rosca, 2012).
As seen in Table 3, the tocopherol contents of processed grape by-products (pomace, skin and seed) oils are presented. α-, β-, ɣ-, and δ-Tocopherols were identified in processed grape by-product oils. Among them, ɣ-tocopherol was the highest found in the grape by-product oil samples, followed by β-, α-, and δ-tocopherols in general. While α-tocopherol contents of grape juice by-product’s oils change between 1.80 mg/kg (skin) and 3.31 mg/kg (pomace), β-tocopherol contents of grape juice by-product’s oil samples were found be-tween 2.70 mg/kg (seed) and 10.93 mg/kg (skin). In addition, while ɣ-tocopherol contents of grape juice by-product’s oils vary between 7.12 mg/kg (pomace) and 25.66 mg/kg (skin) and 11.34 mg/kg (seed), δ-tocopherol contents of the same by-product oils changed between 0.0 (seed) and 1.86 mg/kg (pomace). Also, α-tocopherol
contents of wine by-product oils changed between 3.35 mg/kg (seed) and 6.42 mg/kg (pomace) while β-tocopherol contents of wine by-product oils are determined between 2.37 mg/kg (pomace) and 2.73 mg/kg (seed). In addition, while ɣ-tocopherol contents of wine by-product oil samples 3.76 mg/kg (pomace) and 8.48 mg/ kg (seed), δ-tocopherol contents of wine by product oils varied be-tween 2.04 mg/kg (skin) and 3.04 mg/kg (seed). In boiled grape juice by product oils, ɣ-tocopherol was the highest tocopherol. While α-tocopherol contents of molasses by-product oils change between 1.06 mg/kg (skin) and 4.94 mg/kg (pomace), β-tocopherol contents of molasses by-product oils were found between 2.27 mg/kg (pom-ace) and 6.00 mg/kg (skin). In addition, ɣ-tocopherol contents of molasses by-product oils varied between 9.77 mg/kg (pomace) and 79.79 mg/kg (skin) while δ-tocopherol contents of the same by-prod-uct’s oil samples change between 0.0 (seed) and 2.29 mg/kg (skin). In general, the content of ɣ-tocopherol in the skin of processed grape by-product oil samples was found to be high (except wine skin). Additionally, α-tocopherol contents of pomace oil samples from pro-cessed grape by-products (pomace, skin and seed) were found to be higher when compared to other by-product oils (skin and seed). In addition, β-tocopherol contents of processed grape juice by-product (pomace, skin, seed) oils were higher than those of other processed grape by-products (both wine and molasses by-products). It was not observed statistically significant differences among β-tocopherol of seed oils of all grape by-products.
Grape seed oils after vinification process contained 3.595– 20.56 mg/kg α-tocopherol, 1.947–14.57 mg/kg ɣ-tocopherol, 8.627– 38.39 mg/kg α-tocotrienol, 29.24–74.99 mg/kg ɣ-tocotrienol, and 0.319–1.257 mg/kg δ-tocotrienol (Lachman et al., 2013). Choi and Lee (2009) reported that grape seed oils contained mainly 40 mg/ kg α-tocotrienol and 70 mg/kg ɣ-tocotrienol and 120 mg/kg total to-copherol. In addition, Tangolar, Özogul, Tangolar, and Yağmur (2011) determined 15.43 mg/kg α-tocopherol and 1.85 mg/kg ɣ-tocopherol in grape seed oil. Fernandes, Casal, Cruz, Pereira, and Ramalhosa (2013) showed that the seed oils were a good source of ɣ-tocotrie-nol (499–1575 mg/kg), δ-tocopherol (85.5–244 mg/kg), and α-to-cotrienol (69–319 mg/kg). On other study, red room grape skin, red room grape seed oils contain 8 and 10 mg/kg α- and δ-tocopherol, 12 and 0.6 mg/kg α- and δ-tocopherols, respectively (El Gengaihi et al., 2013). Tocopherols are important antioxidant compounds found mainly in oils. Göktürk Baydar and Akkurt (2001) reported that total tocopherol contents of grape seed oils changed between 328 mg/ kg (Razaki) and 578 mg/kg (Kalecik karası). Results showed partly differences when compared to literature. These differences can be probably due to growing conditions, variety, climatic factors, and harvest time.
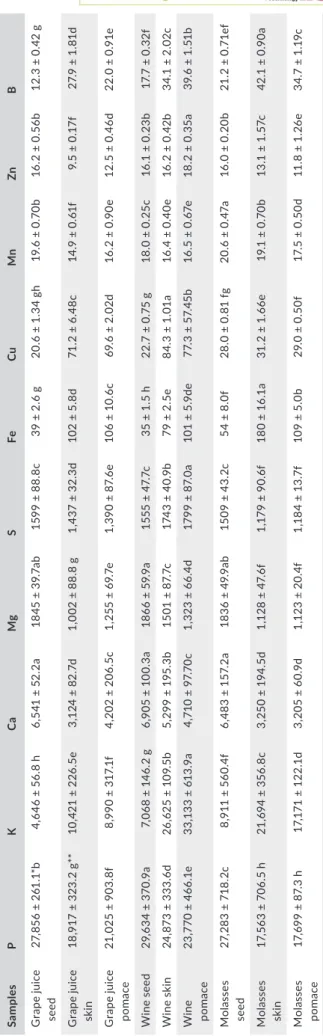
The mineral contents of grape wastes (pomace, skin, and seeds) are given in Table 4. The P, K, Ca, Mg, and S were the major elements in all grape wastes determined. While P contents of grape juice waste change between 18,913 (skin) and 27,856 mg/ kg (seed), P contents of wine wastes were determined between 23,770 (pomace) and 29,634 mg/kg (seed). Also, the lowest and highest P in molasses wastes was found in molasses skin
T A B LE 4 Th e m in er al c on te nt s of g ra pe w as te s (p om ac e, s ki n, a nd s ee ds ) o bt ai ne d fr om p ro ce ss ed M er lo t g ra pe fr ui ts Sa m ple s P K Ca Mg S Fe Cu Mn Zn B G ra pe ju ic e se ed 27 ,8 56 ± 2 61 .1 *b 4, 64 6 ± 56 .8 h 6, 54 1 ± 52 .2 a 18 45 ± 3 9. 7a b 15 99 ± 8 8. 8c 39 ± 2 .6 g 20 .6 ± 1 .3 4 gh 19 .6 ± 0 .7 0b 16 .2 ± 0 .5 6b 12 .3 ± 0 .4 2 g G ra pe ju ic e sk in 18 ,9 17 ± 3 23 .2 g ** 10 ,4 21 ± 2 26 .5 e 3, 12 4 ± 82 .7 d 1, 00 2 ± 88 .8 g 1, 43 7 ± 32 .3 d 10 2 ± 5. 8d 71 .2 ± 6 .4 8c 14 .9 ± 0 .6 1f 9. 5 ± 0. 17f 27 .9 ± 1 .8 1d G ra pe ju ic e po m ac e 21 ,0 25 ± 9 03 .8 f 8, 99 0 ± 31 7.1f 4, 202 ± 20 6. 5c 1, 25 5 ± 69 .7 e 1, 39 0 ± 87 .6 e 10 6 ± 10 .6 c 69 .6 ± 2 .0 2d 16 .2 ± 0 .9 0e 12 .5 ± 0 .4 6d 22 .0 ± 0 .9 1e W in e se ed 29 ,6 34 ± 3 70 .9 a 7, 06 8 ± 14 6. 2 g 6, 90 5 ± 10 0. 3a 18 66 ± 5 9. 9a 1555 ± 4 7. 7c 35 ± 1 .5 h 22 .7 ± 0 .7 5 g 18 .0 ± 0 .2 5c 16 .1 ± 0 .2 3b 17 .7 ± 0 .3 2f W in e sk in 24 ,8 73 ± 3 33 .6 d 26 ,6 25 ± 1 09 .5 b 5, 29 9 ± 19 5. 3b 15 01 ± 8 7. 7c 17 43 ± 4 0. 9b 79 ± 2 .5 e 84 .3 ± 1 .0 1a 16 .4 ± 0 .4 0e 16 .2 ± 0 .4 2b 34 .1 ± 2 .0 2c W in e po m ac e 23 ,7 70 ± 4 66 .1 e 33 ,13 3 ± 613 .9 a 4, 71 0 ± 97 .7 0c 1, 32 3 ± 66 .4 d 17 99 ± 8 7. 0a 10 1 ± 5. 9d e 77. 3 ± 57. 45 b 16 .5 ± 0 .6 7e 18 .2 ± 0 .3 5a 39 .6 ± 1 .5 1b M ola ss es se ed 27 ,2 83 ± 7 18 .2c 8, 91 1 ± 56 0. 4f 6, 48 3 ± 15 7. 2a 18 36 ± 4 9. 9a b 15 09 ± 4 3. 2c 54 ± 8 .0 f 28 .0 ± 0 .8 1 fg 20 .6 ± 0 .4 7a 16 .0 ± 0 .2 0b 21 .2 ± 0 .71e f M ola ss es sk in 17 ,5 63 ± 7 06 .5 h 21 ,6 94 ± 3 56 .8 c 3, 25 0 ± 19 4. 5d 1, 12 8 ± 47 .6 f 1, 17 9 ± 90 .6 f 18 0 ± 16 .1 a 31 .2 ± 1 .6 6e 19 .1 ± 0 .7 0b 13 .1 ± 1 .5 7c 42 .1 ± 0 .9 0a M ola ss es po m ac e 17 ,6 99 ± 8 7. 3 h 17 ,17 1 ± 12 2. 1d 3, 20 5 ± 60 .9 d 1, 12 3 ± 20 .4 f 1, 18 4 ± 13 .7f 10 9 ± 5. 0b 29 .0 ± 0 .5 0f 17 .5 ± 0 .5 0d 11 .8 ± 1 .2 6e 34 .7 ± 1 .1 9c *M ea n ± SD . * *V al ue s w ith in e ac h c ol om n f ol lo w ed b y d iff er en t l et te rs a re s ig ni fic an tly d iff er en t ( p < .0 5) .
(17,563 mg/kg) and molasses seed (27,283 mg/kg), respectively. In addition, while K contents of grape wastes range from 4,646 (grape juice seed) to 33,133 mg/kg (wine pomace), Ca contents of processed grape wastes changed between 3,124 (grape juice pomace) and 6,905 mg/kg (wine seed). While Mg contents of grape juice wastes change between 1,002 (skin) and 1,845 mg/kg (seed), Mg contents of wine wastes varied between 1,323 (pom-ace) and 1,866 mg/kg (seed). Mg contents of molasses were found between 1,123 (pomace) and 1,836 mg/kg (seed). The highest S was found in wine pomace (1,799 mg/kg). The lowest and highest Fe was found in wine seed (35 mg/kg) and molasses skin (180 mg/ kg), respectively. While Cu contents of processed grape wastes change between 20.6 (grape juice seed) and 84.3 mg/kg (wine skin), Mn contents of grape wastes varied between 14.9 (grape juice skin) and 20.6 mg/kg (molasses seed), Zn contents of pro-cessed grape wastes were determined between 9.5 (grape juice skin) and 18.2 mg/kg (wine pomace). Also, the lowest and highest B were found in grape juice seed (12.3 mg/kg) and molasses skin (42.1 mg/kg), respectively. It was observed statistically significant differences among grape wastes (p < .05).
Recently, eighteen trace elements and 15 rare earth elements were investigated in the skin, pulp and seeds of the red varieties Cabernet Sauvignon and Marselan and the White variety Welschriesling (Yang, Duan, Du, Tian, & Pan, 2010). In some grape seeds collected from different locations in Turkey, the mineral contents of macro- and mi-croelements (Al, B, Ca, Co, Mo, Cr, Fe, K, Mg, Mn, Na, P, S, Se, and Zn) were determined (Özcan, 2010). Grape pomace contained 0.44 Ca, 0.13 Mg, 0.044 Na, 1.40 K, 18.08 Fe, 0.817 Mn, 0.183 P, 0.089 S, and 0.98 mg/100 g Zn (Sousa et al., 2014). Rizzon and Miele (2012) reported that grape juice contained 0.067 mg/100 g Na, 129.5 K, 10.5 P, 8.78 Mg, and 0.14 mg/100 g Fe. Grape seeds grown in differ-ent vine-growing areas after vinification process contained 25.382– 88.532 mg/kg Fe, 5.511–10.14 mg/kg Cu, 5.502 mg/kg–14.175 mg/ kg Zn, 7.001–23.236 mg/kg Mn, 3.562–9.524 mg/kg K, 0.038– 0.335 mg/kg Na, 3.246–6.162 mg/kg Ca, 0.721–1.714 mg/kg Mg, and 2.355–5.030 mg/kg P (Lachman et al., 2013). Mironeasa et al. (2010) reported that grape seeds contained 52.153–5.764% Ca, 23.051– 27.403% K, 15.346–21.676% P, 1.759–2.247% S, 0.173–0.314% Mn, 0.070–0.149% Zn, and 0.054–0.100% Ca. Our results were in accordance with some authors (Lachman et al., 2013; Mironeasa et al., 2010; Özcan, 2010; Yang et al., 2010). Results showed partly dif-ferences compared to literature. These differences can be probably due to the parts of grape, processing equipment contaimination, soil structure, and fertilizer in growing stage.
4 | CONCLUSION
Several factors including different sources of grape by-products, process methods, such as pressing, crushy, fermentation had af-fected the extraction efficiency and the source of grape by-product had significant effect on total phenolics, total flavonoids, phenolic compound contents, and antioxidant activities. Thus, our results could indicate that the changes in the phenolic profile of the grape
(raw material) as a consequence of the winemaking process would be affecting the antioxidant capacity of wine (final product) and pom- ace (by-product). Polyphenols can be considered as added value by-products from industrial wastes. Recently, there has been growing interest in the determination of phenolic compounds, minerals, fatty acid composition, bioactive properties and antioxidant activity from agro-industrial by-products.
CONFLIC T OF INTEREST
The authors have declared no conflicts of interest for this article . ORCID
Mehmet Musa Özcan https://orcid.org/0000-0002-5024-9512
REFERENCES
Ahmad, S. M., & Ali Siahsar, B. (2011). Analogy of physicochemical at-tributes of two grape seeds cultivar. Ciencia e Investigación Agraria,
38(2), 291–301. https://doi.org/10.7764/rcia.v38i2.124
Anastasiadi, M., Pratsinis, H., Kletsas, D., Skaltsounis, A.-L., & Haroutounian, S. A. (2010). Bioactive non-coloured polyphe-nols content of grapes, wines and vinificationby-products: Evaluation of the antioxidant activities of their extracts. Food
Research International, 43, 805–813. https://doi.org/10.1016/
j.foodres.2009.11.017
Anđelković, M., Radovanović, B., Anđelković, A. M., Radovanović, V., Zarubica, A., Stojković, N., & Nikolić, V. (2015). The deter-mination of bioactive ingredients of grape pomace (Vranac va-riety) for potential use in food and pharmaceutical industries.
Advanced Technologies, 4(2), 32–36. https://doi.org/10.5937/
savteh1502032A
Association of Official Analytical Chemists. (1990). Official methods
for analysis (15th ed., Vol. II). Arlington, VA: Association of Official
Analytical Chemists.
Association of Official Analytical Chemists. (1998). Tannin in
dis-tilledliquors: Spectrophotometric method. Official Method 952.03, InSection 26.1.37. (16th ed., 4th Revision). Gaithersburg, MD: AOAC
International.
Arnous, A., & Meyer, A. S. (2009). Quantitative prediction of cell wall polysaccharide composition in grape (Vitis vinifera L.) and apple (Malus domestica) skins from acid hydrolysis monosaccharide profiles.
Journal of Agriculture and Food Chemistry, 57, 3611–3619. https://doi.
org/10.1021/jf900780r
Arvanitoyannis, I. S., Ladas, D., & Mavromatis, A. (2006). Wine waste treat-ment methodology. International Journal of Food Science & Technology,
41, 1117–1151. https://doi.org/10.1111/j.1365-2621.2005.01112.x
Bail, S., Stuebiger, G., Unterweger, H., & Buchbauer, G. (2008). Characterisation of various grape seed oils by volatile compounds, triacyglycerol composition, total phenols. Food Chemistry, 108, 1122– 1132. https://doi.org/10.1016/j.foodchem.2007.11.063
Barron, L. J. R., Celaa, M. V., Santa-Maria, G., & Corzo, N. (1988). Determination of the triglyceride composition of grapes by HPLC. Chromatograph, 25(7), 609–612. https://doi.org/10.1007/ BF02327656
Baydar, N. G., Babalık, Z., Türk, F. H., & Çetin, S. (2011). Phenolic compo-sition and antioxidant activities of wines and extracts of some grape varieties grown in Turkey. Journal of Agricultural Science, 17, 67–76. Baydar, N. G., Özkan, G., & Çetin, E. S. (2007). Characterization of grape
seed and pomace oil extracts. Grasas y Aceites, 58(1), 29–33. https:// doi.org/10.3989/gya.2007.v58.i1.5
Baydar, N. G., Özkan, G., & Yasar, S. (2007). Evaluation of the antirad-ical and antioxidant potential of grape extracts. Food Control, 18, 1131–1136. https://doi.org/10.1016/j.foodcont.2006.06.011 Beveridge, T. H. J., Girard, B., Kopp, T., & Drover, J. C. G. (2005). Yield and
composition of grape seed oils extracted by supercritical carbon di-oxide and petroleum ether: Varietal effects. Journal of Agriculture and
Food Chemistry, 53, 1799–1804. https://doi.org/10.1021/jf040295q
Bozan, B., Tosun, G., & Özcan, D. (2008). Study of polyphenol content in the seeds of red grape (Vitis vinifera L.) varieties cultivated in turkey and their antiradical activity. Food Chemistry, 109, 426–430. https:// doi.org/10.1016/j.foodchem.2007.12.056
Brand-Williams, W., Cuvelier, M. E., & Berset, C. L. W. T. (1995). Use of a free radical method to evaluate antioxidant activity. LWT – Food
Science and Technology, 28(1), 25–30. https://doi.org/10.1016/
S0023-6438(95)80008-5
Bridle, P., & Timberlake, C. F. (1997). Anthocyanins as natural food co-lours: Selected aspects. Food Chemistry, 58(12), 103–109. https://doi. org/10.1016/S0308-8146(96)00222-1
Bruno, G., & Sparapano, L. (2007). Effects of three esca-associated fungi on Vitis vinifera L: V. Changes in the chemical and biological profile of xylem sap from diseased cv. Sangiovese Vines. Physiological and
Molecular Plant Pathology, 71, 210–229. https://doi.org/10.1016/
j.pmpp.2008.02.005
Careri, M., Corradini, C., Elviri, L., Nicoletti, L., & Zagnoni, I. (2003). Direct HPLC analysis of quercetin and transresveratrol in red wine, grape, and winemaking byproducts. Journal of Agriculture and Food
Chemistry, 51, 5226–5231. https://doi.org/10.1021/jf034149g
Chedea, V. S., Braicu, C., & Socaciu, C. (2010). Antioxidant/prooxidant activ-ity of a polyphenolic grape seed extract. Food Chemistry, 121, 132–139. Choi, Y., & Lee, J. (2009). Antioxidant and antiproliferative properties of tococtrienol-rich fraction. Food Chemistry, 114, 1386–1390. https:// doi.org/10.1016/j.foodchem.2008.11.018
Deng, Q., Penner, M. H., & Zhao, Y. (2011). Chemical composition of di-etary fiber and polyphenols of five different varieties of wine grape pomace skins. Food Research International, 44, 2712–2720. https:// doi.org/10.1016/j.foodres.2011.05.026
Dewanto, V., Wu, X., Adom, K. K., & Liu, R. H. (2002). Thermal process-ing enhances the nutritional value of tomatoes by increasDewanto, V., Wu, X., Adom, K. K., & Liu, R. H. (2002). Thermal process-ing total antioxidant activity. Journal of Agriculture and Food Chemistry, 50(10), 3010–3014. https://doi.org/10.1021/jf0115589
El Gengaihi, S., Aboul Ella, F. M., Hassan, E. M., Shalaby, E. A., & Abou Baker, D. H. (2013). Phytochemical investigation and radical scaveng-ing activity of wastes of some grape varieties grown in Egypt. Global
Journal of Pharmacology, 7(4), 465–473. https://doi.org/10.5829/
idosi.gjp.2013.7.41115
Fernandes, L., Casal, S., Cruz, R., Pereira, J. A., & Ramalhosa, E. (2013). Seed oils of ten traditional Portuguese grape variet-ies with interesting chemical and antioxidant propertvariet-ies. Food
Research International, 50, 161–166. https://doi.org/10.1016/
j.foodres.2012.09.039
Fontana, A. R., Antoniolli, A., & Bottini, R. (2013). Grape pomace as a sustainable source of bioactive compounds: Extraction, charac-terization, and biotechnological applications of phenolics. Journal
of Agriculture and Food Chemistry, 61, 8987–9003. https://doi.
org/10.1021/jf402586f
Freitas, L., Jacques, R., Richter, M. F., Loviane da Silva, A., & Caramao, E. B. (2008). Pressurized liquid extraction of vitamin E from Brazilian grape seed oil. Journal of Chromatograph A, 1200, 80–83. https://doi. org/10.1016/j.chroma.2008.02.067
García-Lomillo, J., & González-SanJosé, M. L. (2017). Applications of wine pomace in the food industry: Approaches and functions.
Comprehensive Reviews in Food Science and Food Safety, 16, 3–22.
https://doi.org/10.1111/1541-4337.12238
Giusti, M., & Wrolstad, R. E. (2001). Characterization and mea-surement of anthocyanins by UV-visible spectroscopy. Current
Protocols in Food Analytical Chemistry, 1, F1.2.1–F1.2.13. https://doi.
org/10.1002/0471142913.faf0102s00.
Godevac, D., Tesevic, V., Velickovic, M., Vujisic, L., & Milosavljevic, S. (2010). Polyphenolic compounds in seeds from some grape culti-vars grown in Serbia. Journal of the Serbian Chemical Society, 75(12), 1641–1652. https://doi.org/10.2298/JSC100519131G
Göktürk Baydar, N., & Akkurt, M. (2001). Oil Content and oil quality properties of some grape Seeds. Turkish Journal of Agriculture and
Forestry, 25, 163–168.
Goloshvili, T., Akhalkatsi, M., & Badridze, G. (2018). Characterization of grape seed extracts of native to Georgia varieties of Vitis vinifera L.
Pakistan Journal of Botany, 50(1), 245–250.
Gonzalez-Manzano, S., Rivas-Gomzalo, J. C., & Santos-Buelag, C. (2004). Extraction of flavan-3-ols from grape seed and skin into wine using simulated maceration. Analytica Chimica Acta, 513, 283–289. https:// doi.org/10.1016/j.aca.2003.10.019
Guo, X. D., Wu, C. S., Ma, Y. J., Parry, J., Xu, Y. Y., Liu, H., & Wang, M. (2012). Comparison of milling fraction of tartary buckwheat for their phenolic and antioxidant properties. Food Research International, 49, 53–59. https://doi.org/10.1016/j.foodres.2012.07.019
Halisçelik, O., & Turmuş, Ö. H. (2017). Phenolic component analysis in food products by HPLC. ANT TEKNİK application note L018(InTurkish). Hanganu, A., Todasca, M. C., Chira, N. A., Maganu, M., & Rosca, S.
(2012). The compositional characterization of Romanian grape seed oils using spectroscopic methods. Food Chemistry, 134, 2453–2458. https://doi.org/10.1016/j.foodchem.2012.04.048
Hussein, S., & Abdrabba, S. (2015). Physico-chemical characteristics, fatty acid, composition of grape seed oil and phenolic compounds of whole seeds, seeds and leaves of red grape in Libya. International
Journal of Applied Science and Mathematics, 2, 175–181.
Hygreeva, D., Pandey, M. C., & Radhakrishna, K. (2014). Potential appli-cations of plant based derivatives as fat replacers, antioxidants and antimicrobials in fresh and processed meat products. Meat Science,
98, 47–57. https://doi.org/10.1016/j.meatsci.2014.04.006
Iacopini, P., Baldi, M., Storchi, P., & Sebastiani, L. (2008). Catechin, epicat-echin, quercetin, rutin and resveratrol in red grape: Content, in vitro antioxidant activity and interactions. Journal of Food Compition and
Analysis, 21, 589–598. https://doi.org/10.1016/j.jfca.2008.03.011
ISO-International Organization for Standardization (1978). Animal and vegetable fats and oils preperation of methyl esters of fatty acids, ISO. Geneve, Method ISO 5509, 1–6.
Kammerer, D., Claus, A., Carle, R., & Schieber, A. (2004). Polyphenol screening of pomace from red and white grape varieties (Vitis vinifera L.) by HPLC-DAD-MS/MS. Journal of Agriculture and Food Chemistry,
52, 4360–4367. https://doi.org/10.1021/jf049613b
Katalinic, V., Milos, M., Modun, D., Music, I., & Boban, M. (2004). Antioxidant effectiveness of selected wines in comparison with (+)-catechin. Food Chemistry, 86, 593–600. https://doi.org/10.1016/ j.foodchem.2003.10.007
Ky, I., Lorrain, B., Kolbas, N., Crozier, A., & Teissedre, P. L. (2014). Wine by-products: Phenolic characterization and antioxidant activity evaluation of grapes and grape pomaces from six different French grape varieties. Molecules, 19, 482–506. https://doi.org/10.3390/ molecules19010482
Lachman, J., Hejtmánková, A., Hejtmánková, K., Hornícková, S., Pivec, V., Skala, O., … Pribyl, J. (2013). Towards complex utilisation of wine-making residues: Characterisation of grape seeds by total phenols, tocols and essentialelements content as a by-product of winemaking.
Industrial Crops and Products, 49, 445–453. https://doi.org/10.1016/
j.indcrop.2013.05.022
Liang, N. N., Zhu, B. Q., Han, S., Wang, J. H., Pan, Q. H., Reeves, M. J., … He, F. (2014). Regional characteristics of anthocyanin and flavonol compounds from grapes of four Vitis vinifera varieties in five wine regions of China. Food Research International, 64, 264–274. https:// doi.org/10.1016/j.foodres.2014.06.048