JHEP11(2012)138
Published for SISSA by SpringerReceived: September 12, 2012 Revised: October 23, 2012 Accepted: October 29, 2012 Published: November 23, 2012
Search for high-mass resonances decaying to dilepton
final states in
pp collisions at
√s = 7 TeV with the
ATLAS detector
The ATLAS collaboration
E-mail:
[email protected]
Abstract:
The ATLAS detector at the Large Hadron Collider is used to search for
high-mass resonances decaying to an electron-positron pair or a muon-antimuon pair. The search
is sensitive to heavy neutral Z
′gauge bosons, Randall-Sundrum gravitons, Z
∗bosons,
techni-mesons, Kaluza-Klein Z/γ bosons, and bosons predicted by Torsion models. Results
are presented based on an analysis of pp collisions at a center-of-mass energy of 7 TeV
corresponding to an integrated luminosity of 4.9 fb
−1in the e
+e
−channel and 5.0 fb
−1in the µ
+µ
−channel. A Z
′boson with Standard Model-like couplings is excluded at 95%
confidence level for masses below 2.22 TeV. A Randall-Sundrum graviton with coupling
k /M
Pl= 0.1 is excluded at 95% confidence level for masses below 2.16 TeV. Limits on the
other models are also presented, including Technicolor and Minimal Z
′Models.
JHEP11(2012)138
Contents
1
Introduction
1
2
ATLAS detector
3
3
Lepton reconstruction
4
4
Event selection
4
5
Simulated samples
6
6
Expected signals and backgrounds
6
7
Systematic uncertainties
8
8
Data-SM expectation comparison
10
9
Limit-setting procedure
12
10 Limits on spin-1 SSM and
E
6Z
′bosons
13
11 Limits on spin-1
Z
∗bosons
15
12 Limits on spin-2 Randall-Sundrum gravitons
15
13 Limits on Torsion models
16
14 Limits on Technicolor
17
15 Limits on spin-1 Kaluza-Klein
S
1/Z
2bosons
21
16 Limits on Minimal
Z
′bosons
22
17 Conclusions
23
The ATLAS collaboration
30
1
Introduction
Searches for new resonances decaying to a dilepton final state have had a long and successful
history. These channels contributed to the discovery of the quarkonium resonances J/ψ
and Υ, as well as the discovery of the Z boson. Various models beyond the Standard
Model (SM) contain additional bosons which can decay into dileptons, providing a fully
JHEP11(2012)138
reconstructable final state with small, well-understood backgrounds. In this article, data
collected by the ATLAS experiment at the LHC are used to search for new resonances
decaying into dielectron and dimuon final states.
The Sequential Standard Model (SSM) [
1
] defines the Z
′SSM
couplings to SM fermions
to be the same as the SM Z boson couplings and is often used in the literature as a
benchmark model. A number of models predict additional neutral vector gauge bosons.
One class postulates larger symmetry groups in which the SM gauge group is embedded.
This is usually motivated by gauge unification or restoration of left-right symmetry, which
is violated by the weak interaction. In one scheme, the SM gauge group derives from the E
6group which, upon symmetry-breaking via the SU(5) subgroup, results in two additional
U(1) gauge groups named U(1)
χand U(1)
ψwith associated gauge bosons Z
χ′and Z
ψ′that
can mix [
1
,
2
]. In the Minimal Z
′Models [
3
,
4
], the phenomenology is controlled by only
two effective coupling constants in addition to the Z
′boson mass. This parameterization
encompasses many models, including a left-right symmetric model [
5
,
6
] and the pure (B–L)
model [
7
], where B (L) is the baryon (lepton) number, and B–L is the conserved quantum
number.
A second set of models is motivated by various solutions to the hierarchy problem
of the SM relating the very different scales of electroweak symmetry breaking and the
gravitational Planck scale (M
Pl). One class of such models introduces a new doublet of
vector bosons (Z
∗, W
∗) [
8
] with masses not far from the weak scale [
9
], which couple to
SM fermions only via magnetic-type interactions. Compared to Z
′bosons, interactions
mediated by Z
∗bosons are additionally suppressed in low-energy processes by powers of
the small momentum transfer. Thus, the search for the Z
∗boson is well-motivated at
the LHC.
An alternative solution to the hierarchy problem has been proposed in models that
allow the gravitational force to propagate into extra spatial dimensions. Among them, the
Randall-Sundrum (RS) model [
10
] predicts a warped space-time metric in one extra
dimen-sion. Due to warping, the apparent strength of gravity in the four-dimensional subspace
populated by the SM particles is exponentially suppressed. The RS model predicts excited
states of the graviton, G
∗, whose couplings to the SM particles are not exponentially
sup-pressed. The graviton is a spin-2 boson that can decay into dilepton final states with a
coupling strength of k /M
Pl, where k is a scale that defines the warp factor of the extra
dimension, and M
Pl= M
Pl/
√
8π.
In Kaluza-Klein TeV
−1models [
11
–
13
], the extra-dimensional momentum is quantized
by the inverse of the size of the extra dimension, creating a tower of massive Kaluza-Klein
(KK) states corresponding to each SM particle. The Kaluza-Klein towers corresponding to
the photon and the Z boson, γ
KKand Z
KK, would manifest themselves as nearly degenerate
resonances decaying to dilepton final states. This work is the first direct search for these
Kaluza-Klein states. Previous bounds on the Kaluza-Klein boson mass were obtained from
indirect measurements [
14
,
15
].
Technicolor models [
16
–
18
] provide a dynamical scenario of Standard Model
elec-troweak symmetry breaking (EWSB) by postulating a new strong binding force between
techni-fermions. This model predicts additional bound states, techni-mesons, which are
res-JHEP11(2012)138
onances with masses of a few hundred GeV that can decay into fermion-antifermion pairs.
Two main Technicolor models have a well-developed phenomenology at LHC energies. In
Low-scale Technicolor (LSTC) [
19
,
20
], the coupling constant varies slowly (walks) due to
the existence of many scales of strong interactions while the phenomenology is dictated
by the lowest mass particles. Minimal Walking Technicolor (MWT) [
21
–
23
] is a minimal
model that is conformal and satisfies electroweak precision measurements.
One of the main limitations of the Standard Model is its inability to incorporate gravity.
To address this problem, a consistent quantum theory of all four fundamental forces should
be developed to seamlessly unify the SM and General Relativity (GR). However, so far no
generally accepted formulation of quantum gravity exists, and therefore it is common to
apply a phenomenological approach to the problem by considering extensions of GR and
assuming that they might arise from a more fundamental theory, such as String Theory.
Among such extensions is gravity with Torsion [
24
]. In Torsion models, the spin of the
elementary particles is the source of an extra field called Torsion, which interacts with SM
fermions [
25
,
26
]. This article reports on the first interpretation of a high mass dilepton
search in terms of a Torsion resonance.
Previous searches have set direct and indirect constraints on the mass of new heavy
resonances [
27
,
28
]. The Tevatron data [
29
,
30
] have excluded a Z
′SSM
boson with a mass
lower than 1.071 TeV [
30
]. Recent measurements from the LHC experiments [
31
,
32
],
based on up to 5 fb
−1of data, have excluded a Z
′SSM
boson with a mass lower than
2.33 TeV [
32
]. Indirect constraints from LEP [
33
–
36
] have excluded Z
′SSM
bosons with
mass less than 1.787 TeV [
28
]. Constraints on the mass of the RS graviton have been
set by the ATLAS [
37
], CMS [
32
], CDF [
38
] and D0 [
39
] collaborations, excluding RS
gravitons with a mass less than 2.14 TeV for k /M
Pl= 0.1 [
32
]. A Z
∗with mass less than
1.152 TeV has been excluded by ATLAS [
40
]. A search for the techni-mesons ρ
Tand ω
Tin
the dilepton final state has been conducted by CDF, resulting in a lower bound on the ρ
Tand ω
Tmasses of 280 GeV [
41
]. The constraints from electroweak precision measurements
give a lower limit on the Z
KK/γ
KKboson masses around 4 TeV [
14
,
42
].
The results reported in this article use the full data sample recorded by ATLAS in
2011, corresponding to a total integrated luminosity of 4.9 (5.0) fb
−1in the e
+e
−(µ
+µ
−)
channel.
2
ATLAS detector
The ATLAS detector [
43
] consists of an inner tracking detector surrounded by a 2 T
super-conducting solenoid, electromagnetic and hadronic calorimeters, and a muon spectrometer.
Charged particle tracks in the pseudorapidity
1range |η| < 2.5 are reconstructed with the
inner detector, which consists of silicon pixel, silicon strip, and transition radiation
detec-tors. The superconducting solenoid is surrounded by a hermetic calorimeter that covers
1ATLAS uses a right-handed coordinate system with the z-axis along the beam pipe. The x-axis points to the centre of the LHC ring, and the y axis points upward. Cylindrical coordinates (r, φ) are used in the transverse (x, y) plane, φ being the azimuthal angle. The pseudorapidity is defined in terms of the polar angle θ as η = − ln tan(θ/2).JHEP11(2012)138
|η| < 4.9. For |η| < 2.5, the electromagnetic calorimeter is finely segmented and plays an
important role in electron identification. Outside the calorimeter, air-core toroids provide
the magnetic field for the muon spectrometer. Three stations of precision drift tubes (with
cathode strip chambers for the innermost station for |η| > 2.0) provide an accurate
mea-surement of the muon track curvature in the range |η| < 2.7. Resistive-plate and thin-gap
chambers provide muon triggering capability in the range |η| < 2.4.
3
Lepton reconstruction
Electron candidates are formed from clusters of cells reconstructed in the electromagnetic
calorimeter that are associated with a charged particle track in the inner detector.
Mea-surements of the transverse calorimeter shower shape and the longitudinal leakage into the
hadronic compartment [
44
] are also used to improve electron-hadron identification.
The energy of an electron is obtained from the calorimeter, and its direction from
the associated track. At large transverse energy (E
T), the calorimeter energy resolution
is dominated by a constant term which is measured in data to be 1.2% in the barrel
(|η| < 1.37) and 1.8% in the endcaps (1.52 < |η| ≤ 2.47) [
44
]. For dielectron masses above
200 GeV, the mass resolution is below 2% over the entire η range.
Muon tracks are first reconstructed separately in the inner detector (ID) and in the
muon spectrometer (MS). The two tracks are then matched and a combined fit is performed
to the inner detector and muon spectrometer hits, taking into account the effect of multiple
scattering and energy loss in the calorimeters.
The muons used in this work have hits in either three or two (out of three) stations
of the muon spectrometer. Muons with hits in three stations, referred to as tight muons,
comprise about 95% of the sample, and have transverse momentum (p
T) resolution at 1 TeV
ranging from 10% to 25%. Muons with hits in two stations, referred to as loose muons,
have slightly worse p
Tresolution than the tight muons. Loose muons are accepted only
in the barrel region of the muon spectrometer (|η| < 1.05), excluding small geometrical
regions where the detector alignment is known to be less precise.
4
Event selection
The data used for this study are required to have been recorded during periods of stable
LHC beams, and when all relevant systems of the detector were operating normally.
Col-lision candidates are selected by requiring a primary vertex with at least three associated
charged particle tracks, each with p
Tmore than 0.4 GeV.
In the e
+e
−channel, events were triggered by a diphoton trigger, requiring the
pres-ence of two electromagnetic clusters fulfilling a set of requirements [
45
] on the shape of
the energy deposit and with a transverse energy threshold of 20 GeV. The efficiency of
the diphoton trigger was measured in data to be 99% for electron pairs forming dilepton
masses above 100 GeV. This was done using a tag-and-probe method on electrons from
decays of Z bosons, selected using a single-electron trigger and requiring two electrons in
JHEP11(2012)138
the event to pass the event selection described below. Since the trigger signals are
satu-rated for electromagnetic clusters with very high energies, the trigger-level bunch-crossing
identification, which uses the pulse shape, is challenging and performed by a dedicated
algorithm, implemented in the first-level calorimeter trigger hardware.
Dielectron events are selected by requiring two electron candidates with the medium
level of identification defined in ref. [
44
], with transverse energy E
Tlarger than 25 GeV and
|η| ≤ 2.47; the transition region between the barrel and endcap calorimeters is excluded. A
hit in the first layer of the pixel detector is required if an active pixel module is traversed, to
suppress background from photon conversions. To suppress background from QCD multijet
production, the electron with the higher E
Tmust be isolated, requiring ΣE
T(∆R < 0.2)
less than 7 GeV, where ∆R =
p(∆η)
2+ (∆φ)
2and ΣE
T
(∆R < 0.2) is the sum of the
transverse energies in calorimeter cells around the electron direction in a cone of ∆R
smaller than 0.2. The sum excludes the core of the electron energy deposition and is
corrected for transverse shower leakage and pile-up from additional pp collisions. The
two highest E
Telectrons passing the above selection criteria are used to reconstruct the
dielectron candidate. The curvature measured by the inner detector for the high-energy
electrons relevant to this analysis is not large enough to allow a precise determination of
the transverse momentum and charge of the electrons. To avoid losses in efficiency, the
two electron candidates are not required to have opposite charge. For the selection criteria
described above and dielectron invariant masses (m
ee) greater than 130 GeV, the overall
event acceptance times efficiency (Aǫ) for a Z
′boson of mass 2 TeV is about 66%.
In the µ
+µ
−channel, events were triggered by at least one of two single-muon triggers,
one with a p
Tthreshold of 22 GeV as reconstructed from the combination of ID and MS
information, and the second with a p
Tthreshold of 40 GeV as reconstructed by the MS in
the barrel region only. The typical single-muon trigger efficiency was measured in data to
be 85% in the barrel (considering the union of both trigger paths) and 86% in the endcaps.
The trigger efficiency is lower for muons than it is for electrons because of the smaller
geometrical acceptance of the muon trigger detectors.
A dimuon event candidate is constructed from two opposite-charge muons, each with p
Tgreater than 25 GeV, |η| < 2.4. In order to reject muons from cosmic radiation, the impact
parameter with respect to the primary vertex must be smaller than 0.2 mm in the
trans-verse plane and 1.0 mm along the beam axis, and the primary vertex must be reconstructed
within 20 cm from the centre of the detector along the beam direction. To ensure good p
Tresolution, each muon is required to have a minimum number of hits in each of the inner
detector components as well as in three (two) muon spectrometer stations for tight (loose)
muons. Muon candidates are excluded from the analysis if they cross regions of the muon
spectrometer in which the bending power of the magnetic field is rapidly changing with the
track position or the detector is less precisely aligned or calibrated. In addition, the
dif-ference between the standalone momentum measurements from the inner detector and the
muon spectrometer must not exceed five (three) times the sum in quadrature of the
stan-dalone resolutions for tight (loose) muons. Finally, to suppress background from QCD
mul-tijet production, each muon must be isolated, requiring the sum of the p
Tof all other tracks
JHEP11(2012)138
Dimuon event candidates with two tight muons are considered first (tight dimuon
selection). If more than one such pair is found in an event, the one with the highest scalar
sum of the leptons’ p
Tis selected. If no tight muon pair is found, pairs with one tight
muon and one loose muon (loose dimuon selection) are considered. Similarly, if more than
one loose muon pair is found in an event, the one with the highest
P |p
T| is selected.
For the selection criteria described above, the overall event Aǫ for a Z
′boson of mass
2 TeV decaying into a dimuon final state is 43%, including 4% from the loose dimuon
selection. The lower acceptance compared to the dielectron channel is due to the stringent
hit requirements in the muon spectrometer.
For both channels, the dominant and irreducible background is due to the Z/γ
∗(Drell-Yan) process, characterized by the same final state as the signal. Small contributions
from t¯
t and diboson (W W , W Z and ZZ) production are also present in both channels.
Semi-leptonic decays of b and c quarks in the e
+e
−and µ
+µ
−samples, plus a mixture
of photon conversions and hadrons faking electrons in the e
+e
−sample, are backgrounds
that are referred to below as QCD background. Events with jets accompanying W bosons
(W + jets) may similarly produce dilepton candidates.
The expected signal and backgrounds, with the exception of the ones from QCD and
W +jets, are evaluated with simulated samples and rescaled using the most precise available
cross-section predictions, as explained in more detail in section
6
. The total SM prediction
is then normalized to the data in an invariant mass interval around the Z peak (70–
110 GeV). In the dielectron channel, the rescaling is done after adding the QCD multijet
and W + jets backgrounds evaluated directly from data, as described in section
6
.
5
Simulated samples
The Z
′, G
∗, and LSTC signals, as well as the Z/γ
∗process, are generated with Pythia
6.421 [
46
] using MRST2007 LO** [
47
,
48
] parton distribution functions (PDFs). The
Minimal Z
′and Z
KK
/γ
KKsignals are obtained by reweighting the large sample of Z/γ
∗events from Pythia with the appropriate ratio of differential cross sections [
3
,
49
]. Z
∗and
Torsion signals are generated with CompHEP [
50
], while MadGraph [
51
] is used for MWT
signals; CTEQ6L1 [
52
] PDFs are used in both cases.
The diboson processes are generated with Herwig 6.510 [
53
] using MRST2007 LO**
PDFs. The t¯
t background is generated with MC@NLO 4.01 [
54
] using CTEQ66 [
55
] PDFs.
For t¯
t events, Jimmy 4.31 [
56
] is used to describe multiple parton interactions and
Her-wig
to describe the remaining underlying event and parton showers. Final-state photon
radiation is handled by photos [
57
]. The generated samples are processed through a full
ATLAS detector simulation [
58
] based on GEANT4 [
59
].
6
Expected signals and backgrounds
The Z/γ
∗cross section is calculated at next-to-next-to-leading order (NNLO) in QCD
using PHOZPR [
60
] with MSTW2008 NNLO PDFs [
61
]. The ratio of this cross section
to the leading-order cross section is used to determine a mass-dependent QCD K-factor,
JHEP11(2012)138
which is then applied to the results of the leading-order simulation. The same QCD
K-factor is applied to the Z
′, Z
KK/γ
KK, Torsion, and LSTC signals. Its value is 0.91 at
2 TeV and slowly increases up to 1.15 at 250 GeV. A different K-factor is applied to the
G
∗signal, with values that vary between 1.6 and 1.8 depending on the graviton mass and
k /M
Pl[
62
],
2and with a value of 1.75 above 750 GeV, consistent with ref. [
37
]. Finally, no
QCD K-factor is applied to the leading-order Z
∗cross section since the Z
∗model uses an
effective Lagrangian with a different Lorentz structure.
The Z
′SSM
, Z
′(E
6), Torsion states, and techni-mesons interfere minimally with the
Z/γ
∗process, and the Z
∗and G
∗do not interfere at all. The effect of interference on the
resonance line-shape is therefore neglected for all these states. On the other hand, the
interference of the Z
KK/γ
KKboson with Z/γ
∗is very strong and cannot be neglected [
13
,
42
]. The interference effect is also taken into account in the Minimal Z
′Models framework.
Higher-order electroweak corrections (beyond the photon radiation included in the
sim-ulation) are calculated using Horace [
63
,
64
], yielding an electroweak K-factor (K
EW) due
to virtual heavy gauge boson loops. Its value at 2 TeV is 0.92 in the dielectron channel and
0.93 in the dimuon channel, and slowly increases up to 1.05 at 250 GeV. The electroweak
K-factor is applied only to the Z/γ
∗background and not to the expected signals, with the
exception of Technicolor and Kaluza-Klein states. In the case of Technicolor, K
EWis
ap-plied because production proceeds via the Z/γ
∗process. Since interference is an important
feature of the Kaluza-Klein boson model, the electroweak K-factor is applied to the full
am-plitude (M) of the process, including the Z
KK/γ
KKamplitude:
M
Z/γ∗+ M
ZKK/γKK2
−→
K
EW×
M
Z/γ∗+ M
Z KK/γKK2
. This approximation is conservative. Although interference
is taken into account for Minimal Z
′bosons, for consistency with the treatment of the other
Z
′models the electroweak K-factor is applied only to the pure Z/γ
∗part of the amplitude:
M
Z/γ∗+ M
Z′2
−→
M
Z/γ∗+ M
Z′2
+ (K
EW− 1) ×
M
Z/γ∗2
.
For the other backgrounds, the diboson cross sections are calculated to next-to-leading
order (NLO) using mcfm [
65
] with an uncertainty of 5%, and the t¯
t cross section is predicted
at approximate-NNLO, with an uncertainty of +7.0/ − 9.6% [
66
,
67
].
At very high masses, the statistical significance of the diboson and t¯
t simulated samples
becomes insufficient. Therefore their invariant mass distribution is fitted to the functional
form y(x) = p
1· x
p2+p3logxwhich is then used to extrapolate the t¯
t background above
0.8 TeV and the diboson background above 1.5 TeV.
The QCD multijet and W + jets backgrounds in the e
+e
−sample are estimated
pri-marily from data using several techniques.
First, a “reversed electron identification” technique [
40
] is used, in which only the
QCD multijet background is estimated from data, while the W + jets component comes
from the Monte Carlo simulation. Events with both electron candidates failing one of
the medium identification criteria are used to determine the shape of the QCD multijet
background m
eedistribution. The chosen criterion, the difference in η between the cluster
and the track, does not affect kinematic distributions. The small contamination from
non-QCD processes, located mainly beneath the Z peak, is subtracted using MC samples of
JHEP11(2012)138
the other backgrounds (Z/γ
∗, t¯
t, diboson and W + jets). The shape of these backgrounds
is obtained by summing their contributions according to the most precise available
cross-section predictions. The mass distributions of the QCD and non-QCD backgrounds are
fitted for their relative contributions in the 70 GeV < m
ee< 200 GeV range. The QCD
multijet background shape is fitted in the 110–800 GeV range using the functional form
y(x) = p
1· x
p2+p3logxand is extrapolated beyond 800 GeV. The systematic uncertainty
includes the uncertainty from the relative normalization procedure, namely the QCD
mul-tijet fraction from the first fit, the uncertainty from the choice of the reversed selection and
the uncertainty from the range of the second fit.
A second independent data-driven method is used to obtain an estimate of the QCD
multijet and W + jets backgrounds together. It uses fake rates computed from jet-enriched
samples, obtained from jet triggers or from the signal trigger. The fake factors are defined
as the probability for a jet to pass the “tight” (T) selection, that is all selection criteria, if
it passes the “loose” (L) selection, that is the same reverse identification selection as in the
reverse electron identification method. The fake factors depend only slightly on transverse
momentum and more importantly on pseudorapidity. Since isolation is applied only to the
leading electron, two different fake factors are needed: f
lead, applied to the leading electron,
and f
subl, applied to the subleading electron. The QCD multijet and ℓ+jets backgrounds
are estimated by selecting events with candidate pairs having each electron identified either
as “tight” or “loose”. The final estimate is then
N
ℓ+jets & QCD= f
sublN
TL+ f
leadN
LT− f
leadf
sublN
LL.
The same functional form as before is finally used to fit this estimate between 140 GeV and
850 GeV and extrapolate it above this energy range. The systematic uncertainty includes
the uncertainty from the η or p
Tdependence of the fake factors and the uncertainty from
the range of the fit.
All methods yield consistent results and the final estimate is given by the mean of the
central values. The uncertainty, conservatively assigned to be the maximum of the largest
of up and down deviations of each method, is 33% at m
ee= 200 GeV and grows to about
110% at 2 TeV.
In the dimuon channel, the QCD multijet background is estimated in data from a
sam-ple of non-isolated dimuon events. The W + jets background is evaluated using simulated
samples. Both backgrounds are found to be negligible in the dimuon channel after the
isolation selection is applied.
7
Systematic uncertainties
The systematic uncertainties in this analysis are reduced by the fact that the backgrounds
are normalized to the data in the region of the Z peak. This procedure makes the analysis
insensitive to the error on the measurement of the integrated luminosity as well as other
mass-independent systematic uncertainties. Instead, a constant systematic uncertainty of
5%, due to the uncertainty on the Z/γ
∗cross section in the normalization region, is assigned
JHEP11(2012)138
The mass-dependent systematic uncertainties include theoretical effects due to the
PDFs, QCD and electroweak corrections, as well as experimental effects, namely efficiency
and resolution. These uncertainties are correlated across all bins in the search region.
In addition, there is an uncertainty on the QCD and W + jets backgrounds affecting the
dielectron channel. The theoretical uncertainties are applied to the background expectation
only. The experimental uncertainties are assumed to be correlated between signal and all
types of backgrounds. All systematic uncertainties quoted below refer to narrow resonances
with dilepton masses of 2 TeV. All systematic uncertainties estimated to have an impact
≤ 3% on the expected number of events are neglected.
The combined uncertainty on the PDFs, strong coupling α
S, and
renormalization/facto-rization scale variations is 20%, the largest contribution being the uncertainty on the PDFs.
The α
Sand PDF uncertainties are evaluated using the MSTW2008NNLO eigenvector PDF
sets and the PDF sets corresponding to variations of α
S, at the 90% confidence level (CL).
The spread of the variations covers the difference between the central values obtained with
the CTEQ and MSTW PDF sets. The scale uncertainties are estimated by varying the
renormalization (µ
R) and factorization (µ
F) scales independently up and down by a factor
of two, but with the constraint 0.5 ≤ µ
F/µ
R≤ 2 to avoid large logarithmic corrections.
The resulting maximum variations are taken as the uncertainties. In addition, a systematic
uncertainty of 4.5% is attributed to electroweak corrections [
40
] for both channels. This
contribution includes the difference in the electroweak scheme definition between Pythia
and Horace, and higher order electroweak and O(αα
S) corrections.
In the dielectron channel, the largest experimental systematic uncertainty is due to the
estimate of the QCD multijet and W + jets backgrounds, which translates into a
system-atic uncertainty on the total background of 26% at 2 TeV. Other experimental systemsystem-atic
uncertainties in the dielectron channel include uncertainties due to the extrapolation of the
t¯
t and diboson backgrounds, which are significant only above 2 TeV and uncertainties due
to the electron reconstruction and identification efficiency at high E
T, which are estimated
to be less than 3% for electron pairs. The uncertainties on the calorimeter energy
cali-bration are estimated to be between 0.5% and 1.5%, depending on transverse energy and
pseudorapidity and have a negligible effect on the event yield as do the uncertainties on
the corrections applied to the simulation to reproduce the calorimeter resolution at high
energy.
In the dimuon channel, the combined uncertainty on the trigger and reconstruction
efficiency for muon pairs is estimated to be 6% at 2 TeV. This uncertainty is dominated by
a conservative estimate of the impact from large energy loss due to muon bremsstrahlung
in the calorimeter, which may interfere with reconstruction in the muon spectrometer. In
addition, the uncertainty on the resolution due to residual misalignments in the muon
spec-trometer propagates to a change in the observed width of the signal line-shape; however,
its effect on the final result has a negligible impact for final states which do not interfere
strongly with Z/γ
∗. Finally, the muon momentum scale is calibrated with a statistical
precision of 0.1% using the Z → ℓ
+ℓ
−mass peak. As with the dielectron channel, the
JHEP11(2012)138
Source Dielectrons Dimuons
Signal Background Signal Background
Normalization 5% NA 5% NA
PDF/αs /scale NA 20% NA 20%
Electroweak corrections NA 4.5% NA 4.5%
Efficiency - - 6% 6%
W + jets and QCD background NA 26% NA
-Total 5% 34% 8% 21%
Table 1. Summary of systematic uncertainties on the expected numbers of events at mℓℓ= 2 TeV.
NA indicates that the uncertainty is not applicable, and “-” denotes a negligible entry.
A summary of all systematic uncertainties common to all final states investigated in
this search is shown in table
1
. Additional systematic uncertainties that apply to strongly
interfering states (such as Z
KK/γ
KK) are discussed later.
8
Data-SM expectation comparison
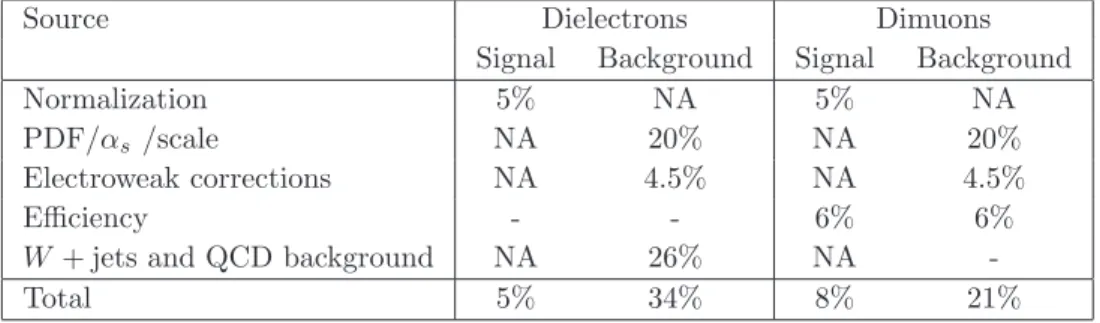
Figure
1
shows the invariant mass (m
ℓℓ) distribution for the dielectron (top) and dimuon
(bottom) final states after final selection. The bin width of the histograms is constant in
log m
ℓℓ, chosen such that a possible signal peak spans multiple bins and the templates are
smooth. Figure
1
also displays the expected Z
′SSM
signal for two mass hypotheses. Tables
2
and
3
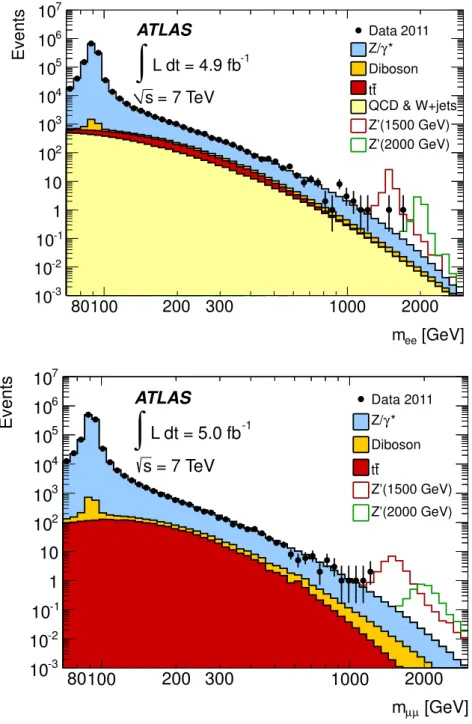
show the number of data events and the estimated backgrounds in bins of
recon-structed dielectron and dimuon invariant mass above 110 GeV. The number of observed
events in the normalization region, from 70 to 110 GeV, is 1,236,646 in the dielectron
chan-nel and 985,180 in the dimuon chanchan-nel. The dilepton invariant mass distributions are well
described by the Standard Model.
The data are compared to the Monte Carlo simulation in the search region 0.13 TeV<
m
ℓℓ< 3.0 TeV. The agreement is first studied by computing the significance of the
dif-ference in each mass bin, with statistical and systematic uncertainties taken into account.
The largest positive local significance is about 2σ in the dielectron channel and about 1σ
in the dimuon channel, and the largest negative local significance is −2σ in both channels.
The comparison is then performed by means of templates [
40
,
68
]. The templates
provide the expected yield of events (¯
n) in each m
ℓℓbin. When neglecting interference, ¯
n
is given by ¯
n = n
X(λ, νν
ν) + n
Z/γ∗(νν
ν) + n
obg(νν
ν), where n
Xrepresent the number of events
produced by the decay of a new resonance X (X = Z
′, Z
∗, G
∗, TS, ρ
T/ω
T, R
1/R
2, where
ρ
T/ω
Tand R
1/R
2are techni-mesons, see below); n
Z/γ∗and n
obgare the number of Z/γ
∗(Drell-Yan) and other backgrounds events, respectively. The symbol λ represents the
pa-rameter of interest of the model, and νν
ν is the set of Gaussian-distributed nuisance
parame-ters incorporating the systematic uncertainties. When including the effects of interference,
¯
n = n
X+Z/γ∗(λ, νν
ν) + n
obg(νν
ν), where n
X+Z/γ∗is the number of signal plus Z/γ
∗events
and X can be Z
KK/γ
KKor a Minimal Z
′boson. Signal templates provide the expected
JHEP11(2012)138
[GeV]
eem
80100
200 300
1000
2000
Events
-310
-210
-110
1
10
210
310
410
510
610
710
ATLAS
-1L dt = 4.9 fb
∫
= 7 TeV
s
Data 2011 * γ Z/ Diboson tt QCD & W+jets Z’(1500 GeV) Z’(2000 GeV)[GeV]
µ µm
80100
200 300
1000
2000
Events
-310
-210
-110
1
10
210
310
410
510
610
710
Data 2011 * γ Z/ Diboson tt Z’(1500 GeV) Z’(2000 GeV)ATLAS
-1L dt = 5.0 fb
∫
= 7 TeV
s
Figure 1. Dielectron (top) and dimuon (bottom) invariant mass (mℓℓ) distributions after final
selection, compared with the stacked sum of all expected backgrounds, with two example Z′ SSM
signals overlaid. The bin width is constant in log mℓℓ.
The significance of a signal is summarized by a p-value, the probability of observing
a signal-like excess at least as extreme as the one observed in data, assuming the null
hypothesis. The outcome of the search is ranked using a log-likelihood ratio (LLR), with
the likelihood function defined as the product of the Poisson probabilities over all mass
JHEP11(2012)138
mee[GeV] 110–200 200–400 400–800 800–1200 1200–3000 Z/γ∗ 26700 ± 1100 2960 ± 120 265 ± 13 12.1 ± 0.9 1.47 ± 0.18 t¯t 1300 ± 120 410 ± 40 26.5 ± 2.8 0.41 ± 0.17 0.034 ± 0.034 Diboson 415 ± 21 146 ± 8 16.2 ± 0.9 0.88 ± 0.05 0.101 ± 0.011 QCD and W + jets 1900 ± 600 510 ± 200 50 ± 31 2.0 ± 1.8 0.26 ± 0.31 Total 30300 ± 1300 4030 ± 240 357 ± 34 15.4 ± 2.0 1.86 ± 0.35 Data 29816 4026 358 17 3Table 2. Expected and observed number of events in the dielectron channel. The errors quoted include both statistical and systematic uncertainties.
mµµ [GeV] 110–200 200–400 400–800 800–1200 1200–3000 Z/γ∗ 21200 ± 1200 2090 ± 230 173 ± 15 7.7 ± 0.8 0.98 ± 0.16 t¯t 900 ± 100 270 ± 50 18 ± 11 0.32 ± 0.07 0.019 ± 0.007 Diboson 289 ± 32 97 ± 24 11.8 ± 2.7 0.59 ± 0.26 0.087 ± 0.016 Total 22400 ± 1200 2460 ± 240 203 ± 19 8.7 ± 0.9 1.09 ± 0.16 Data 21945 2294 197 10 2
Table 3. Expected and observed number of events in the dimuon channel. The errors quoted include both statistical and systematic uncertainties.
bins in the search region, using a Z
′SSM
template. Explicitly:
LLR = −2 ln
L(data | ˆn
Z′, ˆ
M
Z′, ˆ
νν
ν)
L(data | (ˆn
Z′= 0), ˆ
νν
ν)
ˆ
where ˆ
n
Z′, ˆ
M
Z′, ˆ
νν
ν and ˆˆ
νν
ν are respectively the best-fit values for the Z
′normalization,
Z
′mass and nuisance parameters, which maximize the likelihood L given the data,
assum-ing in the numerator that a Z
′signal is present and in the denominator that no signal
is present. The LLR is scanned as a function of Z
′cross section and M
Z′
over the full
considered mass range. The observed p-value for the dielectron and dimuon samples is
36% and 68%, respectively. For the combination of both channels, the observed p-value
is 40%.
9
Limit-setting procedure
In the absence of a signal, upper limits on the number of events produced by the decay of
a new resonance are determined at the 95% Confidence Level (CL).
The limit on the number of signal events is converted into a limit on the ratio of
cross section times branching fraction σB(X → ℓ
+ℓ
−)/σB(Z → ℓ
+ℓ
−) by dividing by the
observed number of Z boson events and the ratio of corresponding acceptances. This ratio
of σB is then converted into a limit on σB(X → ℓ
+ℓ
−) by multiplying it by the theoretical
value of σB(Z → ℓ
+ℓ
−). Because of the strong destructive interference between
Kaluza-Klein bosons and Z/γ
∗, limits are set on the coupling strength of the resonance to the
fermions instead of the cross section times branching ratio. The same is done for the class
of Minimal Z
′Models, where the coupling strength γ
′is one of the two parameters defining
JHEP11(2012)138
Model
Z
′ ψZ
N′Z
η′Z
I′Z
S′Z
χ′sin θ
E60
−1/4
p3/8
p5/8
3
√
6/8
1
cos θ
E61
√
15/4
p5/8 −p3/8 −
√
10/8
0
Table 4. Mixing angle values for the E6 models considered.
The same Bayesian approach [
69
] is used in all cases, with a flat prior probability
distribution for the signal cross section times branching fraction (σB), when neglecting
interference. When including the effects of interference, the prior is flat for the coupling
strength to the second or to the fourth power. The most likely number of signal events, and
the corresponding confidence intervals, are determined from a likelihood function defined
as the product of the Poisson probabilities over all mass bins in the search region, using
the appropriate signal templates. The nuisance parameters are integrated out.
Most of the dilepton resonances searched for in this analysis are narrow compared
to the detector resolution. The effect of width variations on the resonance line-shape is
neglected for the E
6analysis. On the other hand, the dependence of the width on the
coupling strength is taken into account in the MWT, Torsion and G
∗analyses by using
several templates for a given pole mass in which various values of the couplings are selected.
Signal templates include the acceptance times efficiency of the signal, at a given pole mass
M
X, over the full search region. The product Aǫ is different for each model due to different
angular distributions, boosts, and line-shapes.
The expected exclusion limits are determined using simulated pseudo-experiments with
only Standard Model processes by evaluating the 95% CL upper limits for each
pseudo-experiment for each fixed value of the resonance pole mass M
X. The median of the
distri-bution of limits is chosen to represent the expected limit. The ensemble of limits is also
used to find the 68% and 95% envelopes of the expected limits as a function of M
X.
The combination of the dielectron and dimuon channels is performed under the
as-sumption of lepton universality by defining the likelihood function in terms of the total
number of signal events produced in both channels. For each source of uncertainty, the
correlations across bins, as well as the correlations between signal and background, are
taken into account.
10
Limits on spin-1 SSM and
E
6Z
′bosons
Due to mixing between the U(1)
χand U(1)
ψgroups, in the E
6models the lightest new
boson is a linear combination of the Z
′χ
and Z
ψ′bosons depending on the mixing angle θ
E6.
For six specific values of this mixing angle, the diboson resonance is named Z
′ψ
, Z
N′, Z
η′, Z
I′,
Z
′S
, and Z
χ′. The corresponding mixing angle values are displayed in table
4
. Like the SSM,
these models prescribe the couplings of the Z
′boson to the SM fermions. The expected
intrinsic width of the Z
′boson in the E
6
models is predicted to be between 0.5% and
1.3% [
70
,
71
] of its mass, while in the SSM the intrinsic width is predicted to be about 3%.
Figure
2
shows the 95% CL observed and expected exclusion limits on σB(Z
′→ e
+e
−)
and σB(Z
′→ µ
+µ
−) obtained with Z
′JHEP11(2012)138
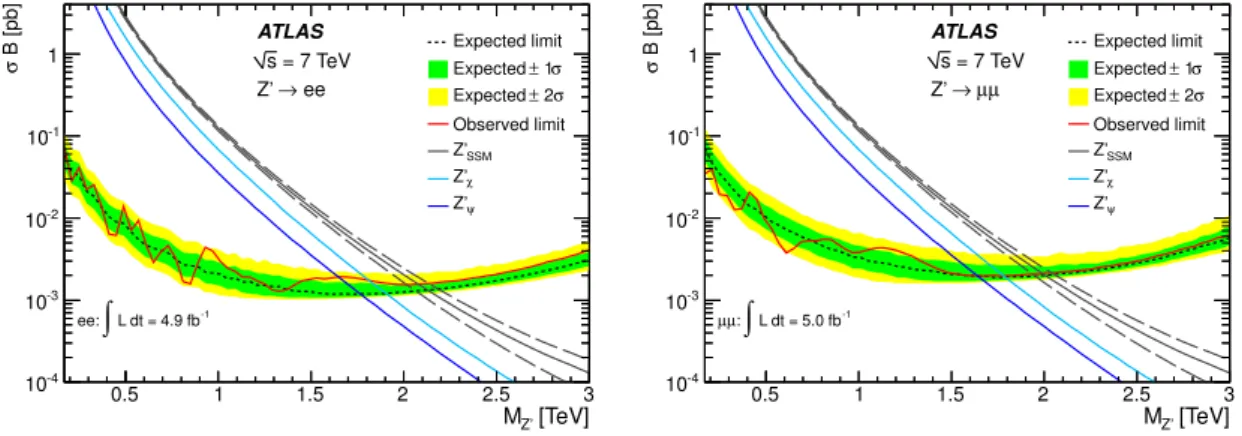
[TeV] Z’ M 0.5 1 1.5 2 2.5 3 B [pb] σ -4 10 -3 10 -2 10 -1 101 Expected limitExpected ± 1σ
σ 2 ± Expected Observed limit SSM Z’ χ Z’ ψ Z’ ATLAS ee → Z’ = 7 TeV s -1 L dt = 4.9 fb
∫
ee: [TeV] Z’ M 0.5 1 1.5 2 2.5 3 B [pb] σ -4 10 -3 10 -2 10 -1 101 Expected limitExpected ± 1σ
σ 2 ± Expected Observed limit SSM Z’ χ Z’ ψ Z’ ATLAS µ µ → Z’ = 7 TeV s -1 L dt = 5.0 fb
∫
: µ µFigure 2. Expected and observed 95% CL limits on σB and expected σB for Z′
SSM production
and the two E6-motivated Z′ models with lowest and highest σB for the dielectron (left), and the
dimuon (right) selections. The dashed lines around the Z′
SSMtheory curve represent the theoretical
uncertainty, which is similar for the other theory curves.
[TeV] Z’ M 0.5 1 1.5 2 2.5 3 B [pb] σ -4 10 -3 10 -2 10 -1 10
1 Expected limitExpected ± 1σ
σ 2 ± Expected Observed limit SSM Z’ χ Z’ ψ Z’ ATLAS ll → Z’ = 7 TeV s -1 L dt = 5.0 fb
∫
: µ µ -1 L dt = 4.9 fb∫
ee:Figure 3. Expected and observed 95% CL limits on σB and expected σB for Z′
SSMproduction and
the two E6-motivated Z′ models with lowest and highest σB for the combination of the dielectron
and dimuon channels. The dashed lines around the Z′
SSM theory curve represent the theoretical
uncertainty, which is similar for the other theory curves.
section times branching fraction for the Z
′SSM
and for the lowest and highest σB of E
6-motivated Z
′models. The combination of the dielectron and dimuon channels is shown in
figure
3
. The rise of the σB limit at high invariant mass is due mainly to the fast fall of the
parton luminosity at high momentum transfer which enhances the low-mass tail, causing
a distortion in the resonance peak shape.
The 95% CL σB limit is used to set mass limits for each of the models considered. The
limits obtained for the Z
′JHEP11(2012)138
Z
′SSM
→ e
+e
−Z
SSM′→ µ
+µ
−Z
SSM′→ ℓ
+ℓ
−Observed limit [TeV]
2.08
1.99
2.22
Expected limit [TeV]
2.13
2.00
2.25
Table 5. The observed and expected 95% CL lower limits on the mass of the Z′
SSM boson for the
e+e− and µ+µ− channels separately and for their combination.
Model
Z
′ψ
Z
N′Z
η′Z
I′Z
S′Z
χ′Observed limit [TeV]
1.79
1.79
1.87
1.86
1.91
1.97
Expected limit [TeV]
1.87
1.87
1.92
1.91
1.95
2.00
Table 6. The observed and expected 95% CL lower limits on the masses of E6-motivated Z′bosons.
Both lepton channels are combined.
Z
∗→ e
+e
−Z
∗→ µ
+µ
−Z
∗→ ℓ
+ℓ
−Observed limit [TeV]
2.10
1.97
2.20
Expected limit [TeV]
2.13
1.99
2.22
Table 7. The observed and expected 95% CL lower limits on the mass of the Z∗ boson for the
e+e− and µ+µ− channels separately and for their combination.
mass limit for the Z
′SSM
is 2.22 (2.25) TeV. The combined mass limits on E
6-motivated Z
′are given in table
6
.
11
Limits on spin-1
Z
∗bosons
A model with quark-lepton universality is adopted [
72
,
73
] to fix the coupling strength
of the Z
∗boson to fermions. The gauge coupling is chosen to be the same as in the SM
SU(2) group, and the scale of the new physics is proportional to the mass of the new heavy
bosons. The parameters of the model are fixed by requiring that the total and partial decay
widths of W
∗, the charged partner of Z
∗, be the same as those of the W
′SSM
boson with
the same mass. The width of the Z
∗is then 3.4% of its mass. As a result of the tensor
form of the coupling, the Z
∗does not interfere with Z/γ
∗, and the angular distribution of
its decay to dileptons is different from that of a Z
′boson.
Figure
4
shows the 95% CL observed and expected exclusion limits on σB(Z
∗→
ℓ
+ℓ
−) as well as the cross section times branching fraction expected from theory. The
corresponding 95% CL limits on the mass of the Z
∗boson are shown in table
7
.
12
Limits on spin-2 Randall-Sundrum gravitons
The phenomenology of the RS model used in this work can be described in terms of the mass
of the graviton and the ratio k /M
Pl. The expected intrinsic width of the G
∗is proportional
to (k /M
Pl)
2, and is 1.4% for k /M
Pl= 0.1. Limits at the 95% CL on σB(G
∗→ ℓ
+ℓ
−) are
computed assuming two values of k /M
Pl: 0.1 and 0.2. These limits are then compared
JHEP11(2012)138
[TeV] Z* M 0.5 1 1.5 2 2.5 3 B [pb] σ -4 10 -3 10 -2 10 -1 10 1 Expected limit σ 1 ± Expected σ 2 ± Expected Observed limit Z* ATLAS ll → Z* = 7 TeV s -1 L dt = 5.0 fb∫
: µ µ -1 L dt = 4.9 fb∫
ee:Figure 4. Expected and observed 95% CL limits on σB and expected σB for Z∗boson production
for the combination of dielectron and dimuon channels. The dashed lines around the Z∗ theory
curve represent the theoretical uncertainty.
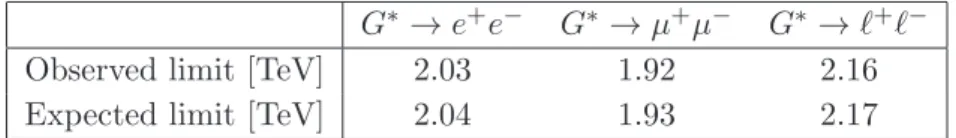
G
∗→ e
+e
−G
∗→ µ
+µ
−G
∗→ ℓ
+ℓ
−Observed limit [TeV]
2.03
1.92
2.16
Expected limit [TeV]
2.04
1.93
2.17
Table 8. The observed and expected 95% CL lower limits on the mass of the G∗ with a coupling
of k /MPl= 0.1 for the e+e− and µ+µ− channels separately and for their combination.
k /M
Pl0.01
0.03
0.05
0.1
0.12
0.14
0.17
0.2
Observed limit [TeV]
0.92
1.49
1.72
2.16
2.23
2.32
2.42
2.51
Expected limit [TeV]
1.02
1.53
1.81
2.17
2.25
2.33
2.44
2.53
Table 9. The observed and expected 95% CL lower limits on the mass of the G∗ with varying
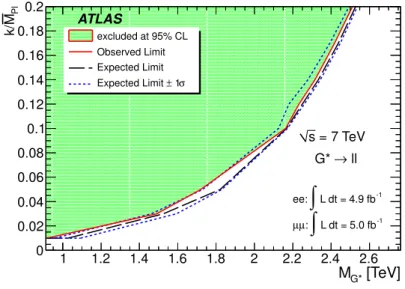
coupling k /MPl. Both lepton channels are combined.
of k /M
Plbetween 0.01 and 0.2. The σB limits obtained with k /M
Pl= 0.1 are used for
k /M
Plhypotheses below or equal to 0.1, while those with k /M
Pl= 0.2 are used for k /M
Plhypotheses larger than 0.1 and below or equal to 0.2. Limits at the 95% CL on the graviton
mass are derived from this comparison for each k /M
Plhypothesis and are shown in table
8
for k /M
Pl= 0.1, and in table
9
and figure
5
for the combined dilepton channel for all
values of k /M
Pl.
13
Limits on Torsion models
The Torsion heavy state (TS) can be treated as a fundamental propagating field
character-ized by its mass, M
TS, and the couplings between TS and fermions. These couplings are
JHEP11(2012)138
[TeV] G* M 1 1.2 1.4 1.6 1.8 2 2.2 2.4 2.6 Pl M k/ 0 0.02 0.04 0.06 0.08 0.1 0.12 0.14 0.16 0.18 0.2 ATLAS = 7 TeV s ll → G* -1 L dt = 4.9 fb∫
ee: -1 L dt = 5.0 fb∫
: µ µ excluded at 95% CL Observed Limit Expected Limit σ 1 ± Expected LimitFigure 5. Exclusion regions in the plane of k /MPl versus graviton mass for the combination of
dielectron and dimuon channels. The region above the curve is excluded at 95% CL.
η
TS0.05
0.1
0.2
0.3
0.4
0.5
Observed limit [TeV]
1.52
1.94
2.29
2.50
2.69
2.91
Expected limit [TeV]
1.58
1.96
2.31
2.55
2.77
3.02
Table 10. The observed and expected 95% CL lower limits on the mass of Torsion heavy states with varying coupling ηTS. Both lepton channels are combined.
assumed to be universal at the Planck scale and remain so at the TeV scale for all fermions
except the top quark [
25
]. Therefore the phenomenology of Torsion decays to dilepton
states can be described in terms of two parameters: the TS mass and one coupling (η
TS).
Since η
TScan a priori take any value between 0 and 1, the intrinsic width could be very
large. The interference effects with Z/γ
∗are negligible.
Limits are computed on σB(TS → ℓ
+ℓ
−) for five values of η
TS
in the range 0.1–0.5.
Limits on σB are then translated into limits on M
TSin the same way as above for the RS
graviton, by comparing them to the theoretical σB as a function of M
TSfor each value
of η
TS. Additionally, the σB limits obtained for η
TS= 0.1 are used to set mass limits for
η
TS= 0.05, which is conservative because the TS width is smaller for η
TS= 0.05. The
resulting exclusion region in the (M
TS, η
TS) plane is displayed in figure
6
and table
10
for the combined dielectron and dimuon channels. The limits on M
TSobtained in each
channel for η
TS= 0.2 are shown in table
11
.
14
Limits on Technicolor
LSTC model.
The Low-scale Technicolor (LSTC) model [
19
,
20
,
74
] postulates the
ex-istence of vector (ρ
T, ω
T) and axial (a
T) techni-mesons, in addition to light techni-pions
JHEP11(2012)138
[TeV] TS M 1.6 1.8 2 2.2 2.4 2.6 2.8 3 3.2 TS η 0.05 0.10 0.15 0.20 0.25 0.30 0.35 0.40 0.45 0.50 excluded at 95% CL Observed Limit Expected Limit σ 1 ± Expected Limit = 7 TeV s ll → TS ATLAS -1 L dt = 4.9 fb∫
ee: -1 L dt = 5.0 fb∫
: µ µFigure 6. Exclusion regions in the plane of ηTS versus Torsion mass for the combination of
dielectron and dimuon channels. The region above the curve is excluded at 95% CL.
TS → e
+e
−TS → µ
+µ
−TS → ℓ
+ℓ
−Observed limit [TeV]
2.15
2.07
2.29
Expected limit [TeV]
2.20
2.08
2.31
Table 11. The observed and expected 95% CL lower limits on the mass of Torsion heavy states with a coupling of ηTS= 0.2 for the e+e−and µ+µ−channels separately and for their combination.
(π
T). Due to techni-isospin symmetry, ρ
Tand ω
Tare nearly degenerate in mass. Therefore
this analysis searches for a combination of ρ
Tand ω
T, with ω
Tbeing the dominant
com-ponent since its branching fraction to dileptons is approximately one order of magnitude
larger than that of the ρ
T. In this work, the LSTC parameters are chosen to be the same
as in ref. [
74
] (in particular, the LSTC parameter sin χ = 1/3) and the mass of the a
Tstate
is assumed to be 10% higher than that of ρ
T.
Limits are computed on σB for the decay of the techni-mesons to dilepton final states.
When building the signal templates, it is assumed that the mass splitting is M
ρT− M
πT=
M
W. Negative interference contributions are neglected. The intrinsic widths of the ρ
T, ω
Tand a
Tresonances are much smaller than the experimental resolution. The resulting limits
on the ρ
T/ω
Tmass are displayed in table
12
.
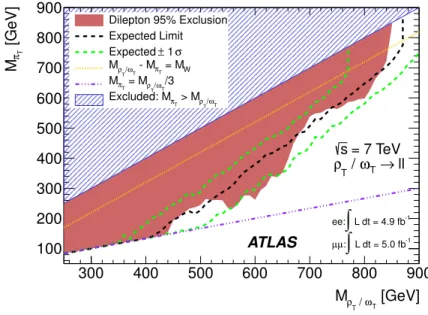
The σB limits are then translated into exclusion regions in the (M
ρT/ωT, M
πT) plane,
shown in figure
7
. The notation ρ
T/ω
Tindicates the combination of the two resonances.
The mass splitting between ρ
Tand π
Tdetermines whether decay modes such as ρ
T→
W π
Tor multi-π
Tare allowed kinematically. Therefore the choice of the value of the
JHEP11(2012)138
ρ
T/ω
T→ e
+e
−ρ
T/ω
T→ µ
+µ
−ρ
T/ω
T→ ℓ
+ℓ
−Observed limit [TeV]
0.85
0.70
0.85
Expected limit [TeV]
0.85
0.71
0.89
Table 12. The observed and expected 95% CL lower limits on the mass of the ρT/ωT in the
MρT−MπT = MW hypothesis for the e
+e−and µ+µ−channels separately and for their combination.
[GeV] T ω / T ρ M 300 400 500 600 700 800 900 [GeV]πT M 100 200 300 400 500 600 700 800 900 ATLAS = 7 TeV s ll → T ω / T ρ -1 L dt = 4.9 fb
∫
ee: -1 L dt = 5.0 fb∫
: µ µ Dilepton 95% Exclusion Expected Limit σ 1 ± Expected W = M T π - M T ω / T ρ M /3 T ω / T ρ = M T π M T ω / T ρ > M T π Excluded: MFigure 7. The 95% CL excluded region (in red) in the plane πTmass as a function of the ρT/ωT
mass, assuming MaT = 1.1 × MρT/ωT, for the combination of dielectron and dimuon channels. The dotted line corresponds to MρT/ωT− MπT = MW. The black dashed line shows the expected limit, with the green dashed lines showing the ±1σ bands. The blue hashed region in which MπT > MρT/ωT is excluded by theory. This search is insensitive in the region below the purple dashed-dotted line (MπT < MρT/ωT/3).
foundational assumption of the LSTC model is that the walking TC gauge coupling causes
an enhancement of M
πTrelative to M
ρTand the other vector meson masses. This tends
to close off the ρ
T→ π
Tπ
Tdecay channel and, even more strongly, closes off the ω
Tand
a
T→ 3π
Tchannels [
75
]. If M
ωT> 3M
πT, the ω
T→ π
Tπ
Tπ
Tchannel opens up and quickly
becomes the dominant decay mode of ω
T. Therefore the dilepton branching fractions
become substantially smaller and there is no sensitivity in the M
πT< M
ρT/ωT/3 region in
the dilepton channel.
MWT model.
The Minimal Walking Technicolor (MWT) [
21
–
23
] model can be
charac-terized by the following parameters:
• bare axial and vector masses: M
Aand M
V;
• ˜g, the strength of the spin-1 resonance interaction;
• M
H, the Higgs boson mass;
• s, the coupling of the Higgs boson to composite spin-1 states;
JHEP11(2012)138
˜
g
6
5
4
3
2
Observed limit [GeV]
359
485
768
1175
1566
Expected limit [GeV]
352
516
742
1233
1605
Table 13. The observed and expected 95% CL lower limits on the MA parameter with varying
coupling ˜g. Both lepton channels are combined.
[GeV] A M 500 1000 1500 2000 2500 g~ 2 3 4 5 6 7 8 9 Dilepton 95% Exclusion Dilepton 95% Expected limit
σ 1 ± Dilepton 95% Expected limit Running regime EW precision test ATLAS -1 L dt = 4.9 fb
∫
ee: µµ:∫
L dt = 5.0 fb-1 = 7 TeV s ll → 2 , R 1 RFigure 8. Bounds in the (MA, ˜g) plane of the MWT parameter space: (i) The electroweak
precision measurements exclude the dark area in the bottom left corner. (ii) The requirement to stay in the walking regime excludes the hatched area in the right corner. (iii) The red area (black dashed line) shows the observed (expected) exclusion at 95% CL in the dilepton channel. The green dashed lines show the ±1σ bands of the expected exclusion limit.