Investigation on the Reliability of Earthquake
Prediction Based on Ionospheric Electron Content
Variation
Ali Alp Akyol
1Electrical and Electronics Engineering Department Bilkent University, 06800
Ankara, Turkey [email protected]
Orhan Arikan
2 Electrical and ElectronicsEngineering Department Bilkent University, 06800
Ankara, Turkey [email protected]
Feza Arikan
3 Electrical and ElectronicsEngineering Department Hacettepe University, 06800
Ankara, Turkey [email protected]
M. Necat Deviren
4 Electrical and ElectronicsEngineering Department Hacettepe University, 06800
Ankara, Turkey [email protected]
Abstract—Due to lack of statistical reliability analysis of
earthquake precursors, earthquake prediction from ionospheric parameters is considered to be controversial. In this study, reliability of earthquake prediction is investigated using dense TEC data estimated from the Turkish National Permanent GPS Network (TNPGN- Active).
I. INTRODUCTION
Ionosphere is a region of Earth’s upper atmosphere ranging from 90 km to 1000 km altitude and containing highly concentrated free electrons formed as a result of ionizing space radiation affecting atoms and molecules in atmosphere. This neutralized layer of atmosphere plays a great role on HF radio transmission and satellite communication systems. Hence observation of ionosphere is necessary for reliability of communication systems. As an example, strong solar radiation increases the ionospheres’ free electron content resulting with alterations in plasmic frequency. These alterations deflect the propagation path of radio waves significantly effect quality of radio communications [1]. Satellite communication also suffer from the instantaneous state of the ionosphere that signals transmitted by satellites are affected by the dispersive and lossy ionospheric channel resulting with unreliable communications and disconnections [2].
Recent studies have proposed a link between seismic activities and state of the ionosphere. One of the hypothesis about the interaction between Seismic activity and ionosphere is that increased stress on the rock formations prior to the earthquakes causes strong electrical current in the Earth’s crust which ionize air resulting local changes in the electron content of the ionosphere. In a laboratory experiment, significant amount of electrical current is induced on the lateral surface of a granite slab by applying sufficiently high pressure on the top surface of the slab [3]. In the next stage of the experiment, pressure on the granite slab is increased leading to discovery of ionization in air around the lateral surfaces of the rock. When length of the fault lines inside the Earth’s crust and the pressure on these fault lines taken into consideration, it is a possibility that electrical currents that are sufficiently high to ionize air and change the state of the ionosphere can be induced.
Furthermore, a coupling model for the stressed rock-Earth surface charges-atmosphere-ionosphere system is formulated based on these experimental results [4]. When electric fields and currents in the atmosphere are calculated and the ionospheric responses are simulated, current densities in the earthquake fault zone can cause Total Electron Content (TEC) variations of up to 2-25% in daytime and 1-30% in nighttime ionosphere.
Other studies shows the fact that at the amount of seismic activities leading to earthquakes, electron content of the ionosphere also starts altering until the earthquake takes place [5, 6]. As an example, prior to the March 11 2011 earthquake with magnitude 9 and the epicenter near the Tohoku region of Japan, ionosondes around Japan report ionospheric anomalies between March 3 and 11. Due to these observations, electron content of the ionosphere had been increased until 8 March and reached its maximum on this day [5]. In addition, observations that were made after the earthquake indicate the fact that electron content of the ionosphere returned to its usual levels. If the reported anomalies in the ionosphere were triggered by the Tohoku earthquake, robust detection of such anomalies will yield successful detection of earthquakes many days before it takes place. Considering the impact of a statistically reliable detection of earthquakes, an objective investigation of the probability of detection and probability of false alarm should be investigated. In this work, we will conduct such an investigation on the TEC measurements of the ionosphere.
In order to obtain TEC measurements, positioning system networks such as Global Positioning System (GPS), GLONASS and TOPEX/Poseidon are widely used. TEC measurements can be obtained by phase difference of positioning signals transmitted by satellites to the positioning stations located on Earth. These local measurements of TEC can be used to obtain TEC maps by using spatial and temporal interpolation techniques [7]. In this study, the TEC measurement data has been obtained from Turkish National Permanent GPS Network (TNPGN-Active) consisting of 144 continuously-operating Global Navigation Satellite System (GNSS) stations.
16th International Conference on Information Fusion Istanbul, Turkey, July 9-12, 2013
In Section 2, the Turkish National Permanent GPS Network (TNPGN) is described sample TEC data is provided. In Section 3, a TEC based earthquake detection approach is proposed. The proposed method employs local TEC variations around Turkey by applying a novel spatio-temporal TEC interpolation technique [8]. Also, an earthquake detection signal based on Symmetric Kullback-Leibler Distance (SKLD) is introduced. Finally, two different, spatially and temporally varying earthquake detection thresholds are proposed for improved detection of a possible earthquake precursor. Section 4 provides statistical performance characterization of the proposed.
II. SOURCES OF DATA :TURKISH NATIONAL PERMANENT GPSNETWORK (TNPGN)
The TNPGN consists of 144 continuously-operating Global Navigation Satellite System (GNSS) stations which are distributed across Turkey and Turkish Republic of Northern Cyprus Fig 1. Since 2009, TEC data which are obtained by TNGPN are preprocessed by IONOLAB TEC service to obtain TEC estimates with a time separation of 2.5 minutes at each station in the network.
Fig. 1. Positions of 144 TNPGN stations.
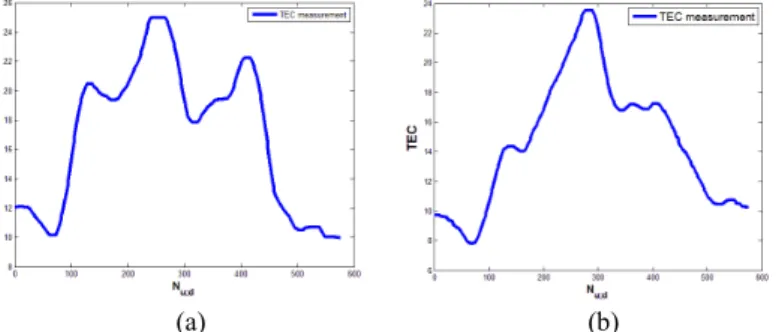
To illustrate available TEC data, in Fig. 2, daily recordings at station with code name “deni” are shown for two different dates of 21/4/2010 and 23/4/2010. As seen in Fig. 2, even the recordings are only two days apart, there is noticeable change in the measured daily TEC values.
(a) (b)
Fig. 2. Daily TEC measurements at station “deni” on a) 21/04/2010 and b)
23/04/2010. Note that daily sunspot numbers for these two dates are 7 and 0, respectively.
III. PROPOSED TEC BASED EARTHQUAKE DETECTION APPROACH
Due to inherent stochastic nature of the ionization taking place in the atmosphere, obtained TEC measurements show significant spatial and temporal variations as well. The detection of earthquake related anomalies in the ionosphere requires detection of local variations beyond the expected range of variation in the TEC measurements. In the proposed detection of these anomalies, there are 3 phases of processing. First, local TEC variations are estimated by using spatio-temporal estimation of available TEC measurements. Then, by using alternative variation metrics, detection signal is generated. Finally, by using a space-time adaptive detection threshold, generated detection signal is thresholded for declaring a detection. In the following each of these stages will be detailed.
A. A spatio-temporal TEC interpolation algorithm
Detection of a local anomaly in the ionosphere can be performed by generating an estimate for the TEC values obtained at a station based on the available measurements in the vicinity of this station (spatial estimation) or based on available measurements obtained in the time-window at the same station (temporal estimation) or both (spatio-temporal estimation). Here, we will focus on spatio-temporal estimation technique. Note that, the actual measurement and its spatio-temporally obtained estimate will be used to generate the detection signal.
For a chosen reference station u daily TEC estimate can be stacked to form a vector:
; [ ; (1) . . . ; ( ) . . . ; ( ; )] , T u d u d u d u d u d x = x x n x N (1) ; ( ) u d
x n , is the n TEC value in day th d for a chosen reference
station u . Parameter Nu d; is the number of TEC estimates on day d and [.]T
represents transpose. Parameter Nu R; r in (2) is the number of neighboring stations that are located within R r
km. radius when the selected center station u . Hence estimate for the reference station u , for day d can be obtained by its neighbors located within R km. radius, as in: r
, ; ; ; ; ; ; 1
ˆ
( )
.
u Rr r r r N u d R u d R v d R vx
α
v x
==
∑
(2)
When reference station and day parameters are taken into consideration, parameter
α
u d R; ; r( )
v
is the TEC vector coefficient for the thv neighboring station where
x
v d R; ; rrepresents this neighbor’s TEC vector. In order to obtain, estimation coefficients
α
u d R; ; r, a temporal interpolation error minimization technique is implemented as in:, ; ; ; 2 ( ) ; ; ; ; 1 2
min
( )
.
u R s r u d Rr n r n Rr i N d v u d u d R v d d vx
v x
αα
=−
∑
∑
(3)Equation (3) minimizes total estimation error over [ , ]d d i s
day range and results with optimum
α
u d R; ; r( )
v
neighboring coefficients. Optimal solution toα
u d R; ; r can be obtained in closed form [8]. There exists a strong correlation between magnetic activity of the sun and the ionosphere. Sunspot number is a measure of the solar magnetic activity that it indicates possible state of the ionosphere. During this minimization process daily sunspot numbers are taken into consideration that the days within day range are clustered with respect to their sunspot number [9]. The days that are in the same cluster with selected day d are used during this minimization process. Other two clusters are extracted from the minimization day range. Therefore, minimization process is oriented with the daily sunspot number and error between TEC vector and TEC estimate caused by solar magnetic activity variation is reduced.In order to illustrate the interpolation performance, among 144 TNPGN stations, “deni” station, which is located near Denizli in the western Turkey, is chosen as the reference station. The 9 neighboring stations that are located within 150 kms of “deni” are used in spatio-temporal estimation for the measurement at “deni”. Fig. 3 illustrates both measured TEC vectors and their estimations for the same dates shown in Fig. 2. Table 1, contains 9 neighboring stations with their optimal
; ; r u d R
α
coefficients obtained solving (3).(a)
(b)
Fig. 3. TEC measurements and estimates at station “deni” on a) 21/04/2010
and b) 23/04/2010. Note that daily sunspot numbers for these two dates are 7
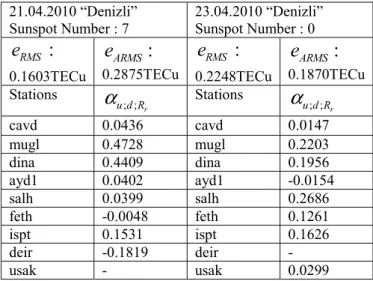
As seen in Table 1, some neighboring stations can be unavailable for different dates. For the date 21/04/2010 “usak” station has no available TEC vector. Hence neighboring coefficients are obtained only for remaining 8 neighboring stations. For the date 23/04/2010 “deir” station has no available TEC vector however, “usak” station has available TEC vector.
In order to determine the performance of estimation process, daily Root Mean Square (RMS) Error and Averaged Root Mean Square (ARMS) Error measures are calculated. Closed form expressions of RMS and ARMS are given in (4) and (5) respectively. 2 ; ; ; 2 ;
1
ˆ
( ; ; )
,
r RMS r u d u d R u de
u d R
x
x
N
=
−
(4)1
( ; ; )
( , , ) ,
1
s i d ARMS r RMS r i d i se
u d R
e
u i R
d
d
==
− +
∑
(5)where ARMS is obtained by averaging RMS over the days of [ , ]d d . In Table 1, the corresponding RMS and ARMS are i s
shown in the second row. Unit for the representation of these two measures is the Total Electron Content unit (TECu) which is equal to 1016 electrons per meters squared.
TABLE I. ESTIMATION ERRORS AND ESTIMATION COEFFICIENTS
21.04.2010 “Denizli”
Sunspot Number : 7 23.04.2010 “Denizli” Sunspot Number : 0
:
RMSe
0.1603TECu:
ARMSe
0.2875TECu:
RMSe
0.2248TECu:
ARMSe
0.1870TECu Stations ; ; r u d Rα
Stations ; ; r u d Rα
cavd 0.0436 cavd 0.0147 mugl 0.4728 mugl 0.2203 dina 0.4409 dina 0.1956 ayd1 0.0402 ayd1 -0.0154 salh 0.0399 salh 0.2686 feth -0.0048 feth 0.1261 ispt 0.1531 ispt 0.1626 deir -0.1819 deir - usak - usak 0.0299B. Generation of Earthquake Detection Signal
Symmetric Kullback-Leibler Distance (SKLD) is one of the strong candidates for detecting local TEC variations accurately. SKLD is a distance metric that is generally used for representing the difference between two Probability Density Functions (PDFs). Since TEC vector and TEC estimate always take positive TEC values, they can be converted into PDFs by normalization given in (6) and (7) respectively [10, 11]:
; 1 ; ; ; 1 ( ) , u d N u d u d u d n P x x n − = ⎛ ⎞ = ⎜⎜ ⎟⎟ ⎝
∑
⎠ (6) ; 1 ; ; ; ; ; ; 1 ˆ ˆ u d ˆ ( ) . r r r N u d R u d R u d R n P x x n − = ⎛ ⎞ = ⎜⎜ ⎟⎟ ⎝∑
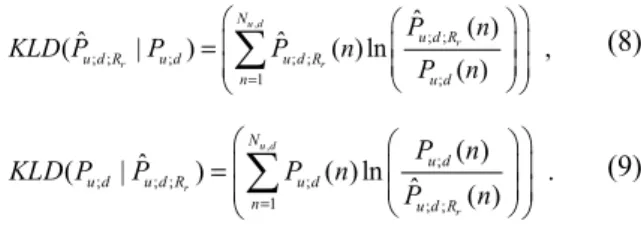
⎠ (7)By using (6) and (7), Kullback-Leibler Distance (KLD) from Pˆu d R; ; rto P can be calculated as in (8) and KLD from u d;
;
u d
P to Pˆu d R; ;r can also be calculated as in (9) respectively:
, ; ; ; ; ; ; ; 1 ; ˆ ( ) ˆ ˆ ( | ) ( ) ln , ( ) u d r r r N u d R u d R u d u d R n u d P n KLD P P P n P n = ⎛ ⎛ ⎞⎞ ⎜ ⎜ ⎟⎟ =⎜ ⎜ ⎟⎟ ⎝ ⎠ ⎝
∑
⎠ (8) , ; ; ; ; ; 1 ; ; ( ) ˆ ( | ) ( ) ln ˆ . ( ) u d r r N u d u d u d R u d n u d R P n KLD P P P n P n = ⎛ ⎛ ⎞⎞ ⎜ ⎜ ⎟⎟ =⎜ ⎜ ⎟⎟ ⎝ ⎠ ⎝∑
⎠ (9)By adding (8) and (9), SKLD between any given TEC vector and any given TEC vector estimate can be obtained as in: ; ˆ; ; ; ˆ; ; ˆ; ; ; ( ; ) ( | ) ( | ) . r r r u d u d R u d u d R u d R u d SKLD P P =KLD P P +KLD P P (10) Earthquake detection signal which can represent local TEC variations is constructed by calculating SKLD for all available stations in TNPGN and for all days on which TNPGN stations are operating. For a given day, SKLD’s can be calculated for available stations and represented as a 2-D map by two dimensional Kriging interpolation [12]. Hence, an earthquake detection signal or surface can be constructed by kriging all available SKLD calculations for a given day. Fig. 4 illustrates a generated earthquake detection signal for the date 10/01/2011, which varies spatially. The generated detection signal is different for different days as well.
Fig. 4. Visualization of earthquake detection signal for the date, 10/01/2011.
C. Earthquake Detection Thresholds
On the generated earthquake detection signal, spatial thresholding can be used to identify local anomalies beyond the expected range of variations. The detection thresholds can be chosen as: constant in time but varying in space (spatial thresholds) or constant in space and vary in time (temporal thresholds) or vary in both space and time (spatio-temporal thresholds). In this study, spatial earthquake detection thresholds and temporal earthquake detection thresholds are generated by statistical analysis of the false alarms.
In order to generate an earthquake detection threshold for a given value of false alarm rate, days at which possible seismic activity takes place should be extracted from the data to obtain no seismic activity class of days. In this study, spatial earthquake detection thresholds which do not vary in time are generated by using no seismic activity class. Therefore, these thresholds can detect beyond the expected local TEC variations for the seismic activity class. Temporal earthquake detection thresholds are generated by using both seismic and no seismic activity classes.
Spatial earthquake detection thresholds are generated by estimating a negative Pareto cumulative distribution for local TEC variations at each TNPGN stations on the days with no seismic activity [13]. Due to estimated negative cumulative distributions, TEC variation thresholds are obtained by limiting probability of false alarm rate to a certain value for each station individually. Fig. 5, illustrates a spatial earthquake detection threshold generated based on the statistics obtained from the no seismic activity days in 2011 and 2012.
Fig. 5. Spatial earthquake detection threshold generated based on the
statistics of local TEC variation during the no seismic activity days in 2011 and 2012.
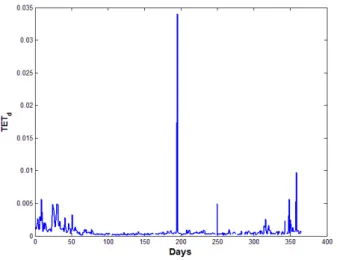
Temporal earthquake detection thresholds are generated by calculating median and standard deviation of all TEC variations obtained by TNPGN stations for both seismic and no seismic activity classes individually. Threshold for a given day is obtained by adding total TEC variation median with a constant multiple of its standard deviation. Temporal earthquake detection threshold for a given daydcan be obtained as in:
d d d
TET
=
M
+
β
S
(11)where
M
dis median andS
dis standard deviation of all TEC variations obtained by TNPGN stations for given dayd.β
parameter remains constant during the calculation of the
TET
d as selected days d change. Fig. 6, displays a temporal earthquake detection threshold generated for the days in 2011 and 2012.Fig. 6. Temporal earthquake detection threshold generated for the days in
2011 and 2012.
IV. PERFORMANCE OF THE PROPOSED TEC BASED EARTHQUAKE DETECTION APPROACH
To illustrate the performance of the proposed earthquake detection approach, an earthquake which had taken place on Sunday, 23 October 2011with magnitude 7.2 and the epicenter near the Van region of Turkey is investigated. The spatial earthquake detection threshold which is shown in Fig. 5 is applied to the time interval starting 9 days prior to the earthquake and ending at the date of the earthquake. As seen in Fig. 7, a significant local TEC variation is detected around the epicenter of the earthquake 7 days prior to the earthquake. Expected local TEC variations are marked as zero and unexpected local TEC variations are marked as the difference between their expected values.
Fig. 7. Earthquake detector output for the date, 16/10/2011.
Likewise, the temporal earthquake detection threshold which is illustrated in Fig. 6 that is generated by adding 6 times the standard deviation to the median of local TEC variations, is applied to seismic activity class. This class contains 23 different time intervals including 9 days prior to the 23
different earthquakes of which had taken place in 2011 with magnitudes greater than 5. Applied detector identifies 14 TEC anomalies prior to these 23 earthquakes and gives false alarm for 18 out of 222 no seismic activity days. To provide more complete picture on the statistical performance of the detector, its Receiver operating characteristics (ROC) is shown in Fig. 8.
Fig. 8. ROC curve of the proposed temporal earthquake detector showing
probability of detection, PD , as a function of probability of false alarm, PFA ,
in 2011 and 2012.
Additionally, it is possible to control probability of false alarm rate PFA by adjusting the
β
parameter respectively. Fig.9, depicts the relation between
β
parameter and false alarm rate.Fig. 9. Adjusting PFA by changing β parameter respectively
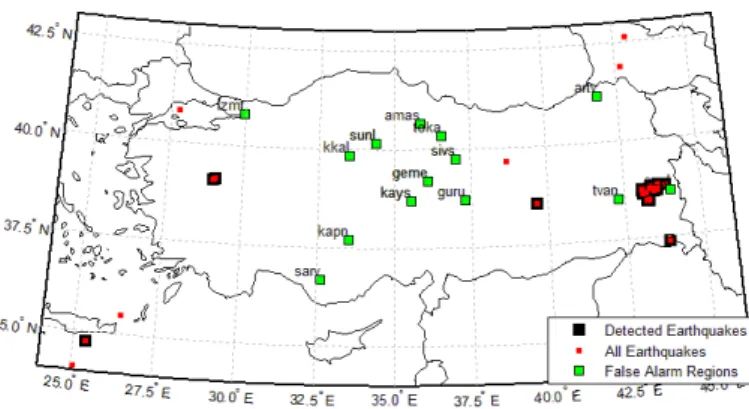
Furthermore, location of the 14 detected earthquakes out of 23 earthquakes which had taken place in 2011 are shown in Fig. 10. As seen in the Fig. 10, detected earthquakes are gathered around certain regions of Turkey. Notice that some of the detected beyond the Turkish border. Since the distance between the measurement network and the epicenters are relatively close, this is an expected result [14,15].
Fig. 10. Detected earthquakes by applying temporal earthquake detection
thresholds generated for the days in 2011 and 2012.
Strong earthquakes have a radius greater than 1000-1500 km for the possible seismo-electromagnetic areas [14,15]. Therefore, it is possible to observe significant TEC variations inside the seismo-electromagnetic epicenter of the earthquakes. Fig. 11, illustrates the histogram of the 14 detected earthquakes with respect to distance between closest local TEC variation and earthquake epicenter.
Fig. 11. Number of detected earthquakes with respect to their closest detection
distance
V. CONCLUSIONS AND FUTURE RESEARCH
Ionosphere is an atmosphere layer where predictable daily and seasonal alterations occur due to position of the Sun and unpredictable and rapid alterations occur due to solar radiation, geomagnetic activity, seismic and gravitational variations. Recent studies shown the fact that ionosphere is not only affected by strong solar radiation but also affected by seismic activities.
In this study, novel spatio-temporal TEC interpolation technique is implemented for the 144 TNPGN stations that are located around Turkey in the time period from 2009 to 2012. TEC estimations are archived, earthquake detection signals and spatially and temporally varying earthquake detection thresholds are constructed for the same time period. For the earthquakes occurred around Turkey with magnitude larger than 5, detection performance of the proposed detection techniques are investigated for a given probability of false alarm. The obtained results suggest that there is a possibility of earthquake detection by monitoring local TEC variations.
As a future work, to improve performance of detection for a given level of false alarm, the position of active faults can be incorporated to the decision logic by eliminating those threshold exceedences away from the active fault lines. Also, decision fusion between temporal and spatial detectors should be investigated for improved performance.
ACKNOWLEDGEMENTS
This study is supported by grants from TUBITAK109E055, Joint TUBITAK 110E296 and RFBR 11-02-91370-CTa and TUBITAK 112E568.
REFERENCES
[1] Nayir,H.,2007, Ionospheric Total Electron Content Estimation Using GPS Signals, MSc Thesis, Hacettepe University, Institute of Science, Ankara.
[2] Komjathy, A. (1997). Global Ionospheric Total Electron Content Mapping Using the Global Positioning System. Ph.D. dissertation, Department of Geodesy and Geomatics Engineering Technical Report No. 188, University of New Brunswick, Fredericton, New Brunswick, Canada, 248 pp.
[3] Freund, F. (2005). Cracking the Code of Pre-Earthquake Signals. National Information Service for Earthquake Engineering, University of California, Berkeley (Found at: http://solar-center. stanford. edu/SID/educators/earthquakes. html).
[4] Kuo, C. L., Huba, J. D., Joyce, G., & Lee, L. C. (2011). Ionosphere plasma bubbles and density variations induced by pre‐earthquake rock currents and associated surface charges. Journal of Geophysical
Research: Space Physics (1978–2012), 116(A10).
[5] Ouzounov D., S. Pulinets, A. Romanov, A. Romanov Jr., K. Tsybulya, D. Davidenko, M. Kafatos and P. Taylor (2011c) Atmosphere-Ionosphere Response to the M9 Tohoku Earthquake Revealed by Joined Satellite and Ground Observations. Preliminary results; Geophysical Research Abstracts Vol. 13, EGU2011, EGU General Assembly, http://arxiv.org/abs/1105.2841.
[6] Namgaladze, A. A., Zolotov, O. V., Zakharenkova, I. E., Shagimuratov, I. I., & Martynenko, O. V. (2009). Ionospheric total electron content variations observed before earthquakes: Possible physical mechanism and modeling. arXiv preprint arXiv:0905.3313.
[7] Yildiz, A., Arikan, O., & Arikan, F. (2011, April). Spatio-temporal interpolation of ionospheric TEC data. In Signal Processing and Communications Applications (SIU), 2011 IEEE 19th Conference on (pp. 817-820). IEEE.
[8] M.N. Deviren, F. Arikan, O. Arikan, (July 2012) Spatio-Temporal Interpolation of Total Electron Content Using a GPS Network, Radio Science (Peer Review).
[9] SIDC – (Solar Influences Data Analysis Center) - http://sidc.oma.be/sunspot-data/dailyssn.php.
[10] Türel, N., 2008, Power Spectral Density and Probability Density Function Estimation of the Total Electron Content of the Ionosphere Layer, MSc Thesis Hacettepe University, Institute of Science, Ankara.
[11] Karatay, S., Arıkan, F., Arıkan, O.,(2009), Investigation of Hourly and Daily Patterns for Lithosphere-Ionosphere Coupling Before Strong Earthquakes, Proceedings of RAST-2009, Recent Advances in Space Research, Harbiye, Istanbul, Turkey.
[12] Stein, M. L. (1999) Interpolation of Spatial Data: Some Theory for Kriging. Springer.
[13] Inmaculada B. Aban, Mark M. Meerschaert and Anna K. Panorska (2006): Parameter Estimation for the Truncated Pareto Distribution, Journal of the American Statistical Association, 101:473, 270-277.
[14] Zhang, X., Shen, X., & Miao, Y. (2012). Electromagnetic Anomalies around Wenchuan Earthquake and Their Relationship with Earthquake Preparation.
Procedia Environmental Sciences, 12, 693-701.
[15] Xia, C., Yang, S., Xu, G., Zhao, B., & Yu, T. (2011). Ionospheric anomalies observed by GPS TEC prior to the Qinghai-Tibet region earthquakes.