Dergi web sayfası:
www.agri.ankara.edu.tr/dergi www.agri.ankara.edu.tr/journalJournal homepage:
TARIM BİLİMLERİ DERGİSİ
—
JOURNAL OF AGRICUL
TURAL SCIENCES
21 (2015) 279-287
Consumer Food Safety Knowledge, Practices and Differences in
Behaviors in Thrace Region of Turkey
Emine YILMAZa, Yasemin ORAMANa, Gökhan UNAKITANa, İsmail Hakkı İNANa
aNamık Kemal University, Faculty of Agriculture, Department of Agricultural Economics, Tekirdağ, TURKEY ARTICLE INFO
Research Article
Corresponding Author: Emine YILMAZ, E-mail: [email protected],Tel: +90 (282) 250 21 12 Received: 12 June 2013, Received in Revised Form: 4 March 2014, Accepted: 19 June 2014
ABSTRACT
In this study, the expectations of individuals living in urban and rural regions of Thrace Region of Turkey were investigated by considering the level of knowledge and behaviour of those individuals about parameters, consumptive habits and food safety while they are buying food products. This study has been conducted in Thrace Region by face to face survey with 770 individuals who have an effective say in the decision of food consumption within the family. The factors affecting the consumers in being knowledgeable about food safety were analyzed with Logit model. Based on analyses results, the variables of gender, town-city and education were determined as statistically significant and coherent with the expectations of coefficients of slope. F1 group (consciousness of food content, appropriate preparation and buying consciously) and F3 group (quality and cost) have been determined as statistically significant.
Keywords: Factor analysis; Logit analysis; Food safety; Consumer behavior
Trakya Bölgesindeki Tüketicilerin Gıda Güvenliği Konusunda Bilgi,
Uygulama ve Davranışlarındaki Farklılıklar
ESER BİLGİSİ
Araştırma Makalesi
Sorumlu Yazar: Emine YILMAZ, E-posta: [email protected],Tel: +90 (282) 250 21 12 Geliş Tarihi: 12 Haziran 2013, Düzeltmelerin Gelişi: 4 Mart 2014, Kabul: 19 Haziran 2014
ÖZET
Bu çalışmada Trakya Bölgesinde kentsel ve kırsal kesimde yaşayan bireylerin gıda ürünleri satın alırken dikkat ettikleri parametreler, tüketim alışkanlıkları ve gıda güvenliği ile ilgili sağlık riskleri karşısında bilgi düzeyleri ve tutumları incelenerek beklentilerinin neler olduğu ortaya konulmaya çalışılmıştır. Çalışma, Trakya Bölgesinde, ailede gıda tüketim kararında etkili olan 770 birey ile yüz yüze görüşülerek yapılmıştır. Tüketicilerin gıda güvenliği hakkında bilgi sahibi olmalarında etkili olan faktörler Logit model ile analiz edilmiştir. Analiz sonucuna göre cinsiyet, köy-şehir ve eğitim değişkenleri istatistikî olarak anlamlı ve eğim katsayılarının beklentilere uyumlu oldukları tespit edilmiştir. F1 grubu (gıda içeriği bilinci, uygun hazırlama ve bilinçli satın alma) ve F3 (kalite ve fiyat) grubu istatistikî olarak anlamlı bulunmuştur. Anahtar Kelimeler: Faktör analizi; Logit analizi, Gıda güvencesi; Tüketici davranışları
Consumer Food Safety Knowledge, Practices and Differences in Behaviors in Thrace Region of Turkey, Yılmaz et al
280
Ta r ı m B i l i m l e r i D e r g i s i – J o u r n a l o f A g r i c u l t u r a l S c i e n c e s 21 (2015) 279-2871. Introduction
Production of ready-made food has risen depending on the increase in consumption of ready-made food parallel to the developing economy. There is not always an increase in the quality as a result of rising production. Parallel to the increase in food consumption, even a slightest problem in hygienic conditions might affect the majority of the population. Therefore diseases originated from foods are growing public health problems in all over the world (Etiler 2001). Consumers have many concerns about the influence of the foods they eat on their health. These range from concerns about the dangers posed by food borne illness and other food safety issues, “chemical additives,” high fat foods and chronic disease threats, through to ecological and regulatory concerns (Worsley & Lea 2008).
Food safety refers to whether chronic or acute hazards may cause food to harm humans (FAO/ WHO 2009). Potentially undesired compounds in foods range broadly from natural and environmental contaminants to agrochemicals.
Food safety has become one of the nation’s hottest topics in the recent years. It’s little wonder, with recent Salmonella spp. and E.coli outbreaks affecting everything from peanuts and pistachios, to common vegetables like tomatoes, peppers and spinach—and even cookie dough.
Henson & Traill (1993) define food safety as ‘‘the inverse of food risk—the probability of not suffering some hazard from consuming specific food’’ absence of food safety causes national and global problems. Food health safety as a whole is a topic which comes first in terms of public authority and procedures when indispensability and economic importance of food products in daily life are considered. At the same time the demand for the food products that have quality warranties has increased. Quality of food products can be defined as acceptable characteristic set by consumers. The product can be considered to have good quality if it meets the need of consumer and has the acceptable objective (energy, vitamin, mineral, toxic material content of the product and freshness) and subjective values (color, shape, taste and smell etc. of the
product). The use of methods that receive direct opinion of consumer in the correct measurement of quality and relatedness of the quality in food products to the conception of the consumer has increased the importance of the concept of conscious consumer (Dölekoğlu 2002).
Although it is well known that the Turkish consumer’s tendency towards food safety has been increasing steadily, research relating to food safety is very limited within Turkey, particularly when considering the inadequate state of forecasts for the future (Oraman et al 2009). In recent years, it has become also apparent that consumer concerns about health have led to significant changes in consumer preferences, which have yet to be fully investigated. Food safety is immediately top-of-mind for consumers as they have low levels of confidence in the safety of food produced in Turkey. In this respect, food safety appears to be assumed. Consumers typically get their information about food safety from the media, so this source appears to play a major role in consumer confidence in food safety (Oraman et al 2009). Consumers feel that they lack food safety information but it is evident that they do not actively seek it. The media is the primary and typically passive source of information for the large majority. Those who look for information tend to rely on the Internet, brochures, and discussions with family, friends and people involved in health and the food industry, like doctors, dieticians and retailers.
Previous studies in adults have indicated that food safety knowledge tends to increase with age and practice: females have higher scores than males, and younger respondents have shown the greatest need for additional food safety education (Bruhn and Schutz, 1999; Rimal et al 2001). According to Albert (1995), respondents from urban areas tend to have lower scores than those from rural areas. However, Morrone & Rathburn, (2003) and Unklesbay et al (1998) found that only a few studies have been conducted to explore the food safety knowledge, and behaviours among college students in developed country. Unusan (2007) and Garayoa et al (2005) found significant difference among education levels concerning attitude towards food safety and knowledge.
281
Ta r ı m B i l i m l e r i D e r g i s i – J o u r n a l o f A g r i c u l t u r a l S c i e n c e s 21 (2015) 279-287 According to Shepherd (1989) numerous
variables influence consumer’s knowledge and behaviours processes. Individual socio-demographic characteristics are commonly included as determinants of attitudes. Today’s consumers are characterized by an increasing health consciousness and growing interest in the role of food for maintaining and improving human well-being and consumer health (Gilbert 2000; IFIC 2000).
Most previous investigations of consumers’ food concerns have focused on single themes such as “food safety” (Wandel 1994; Topuzoğlu et al 2007; Dölekoğlu 2002). In recent years, it has also become apparent that consumer concerns about health have led to significant changes in consumer preferences, which have yet to be fully investigated. The main objective of this study is to gain a better understanding of of examining their consciousness levels in food safety of consumers.
In this study, we used a binary logistic regression analysis that can be used to determine the degree of influence of the factors which provides food safety consciousness for the individuals living in rural and urban areas of Thrace region (Edirne, Tekirdağ, Kırklareli) by examining their consciousness levels in food safety.
We believe that the results can provide important information for the producers, retailers and food authorities to help them to understand the main factors affecting consumers’ decisions and therefore improve their strategies.
The remainder of the paper is organized as follows. First, previous work analyzing consumer concern with food safety and factors affecting consumers’ knowledge is reviewed. Next, the data and the statistical methods used to analyze the data are described. Then, the results and accompanying discussion is presented. The final section provides conclusions and outlines avenues for future research.
2. Material and Methods
2.1. Data collectionThe primary material of the research consists of the data collected from survey studies with
selected dwellings in Thrace region (Tekirdag, Edirne, Kırklareli). Sample volume is distributed according to the density of the population living in the Tekirdag, Edirne, Kırklareli provinces. Of the total 770 consumers, 88 in urban, 99 in rural areas in Kırklareli province; 109 in urban, 121 in rural areas in Edirne province, 188 in urban, 165 in rural areas in Tekirdag province were interviewed.
Maintaining the original data about the research is based on the method of face-to-face interview. In survey forms, the questions related to demographic information of consumers were asked as closed end whereas the questions for determining the standard of knowledge of the consumers about food safety were prepared in quintet Likert scale. Original data was collected in a single step. Coincidental sampling method was used in determining the consumers who are the data sources. Since there hasn’t been any study about consumption of these products in research region, the ratio was accepted as 50% in order to reach the maximum sample that will represent the population (Newbold 2007).
The remainder of the paper is organized as follows. First, previous work analyzing consumer concern with food safety and factors affecting consumers’ knowledge is reviewed. Next, the data and the statistical methods used to analyze the data are described. Then, the results and accompanying discussion is presented. The final section provides conclusions and outlines avenues for future research.
2. Material and Methods
2.1. Data collection
The primary material of the research consists of the data collected from survey studies with selected dwellings in Thrace region (Tekirdag, Edirne, Kırklareli). Sample volume is distributed according to the density of the population living in the Tekirdag, Edirne, Kırklareli provinces.Of the total 770 consumers, 88 in urban, 99 in rural areas in Kırklareli province;109 in urban,121 in rural areas in Edirne province, 188 in urban, 165in rural areas in Tekirdagprovince were interviewed.
Maintaining the original data about the research is based on the method of face-to-face interview. In survey forms, the questions related to demographic information of consumers were asked as closed end whereas the questions for determining the standard of knowledge of the consumers about food safety were prepared in quintet Likert scale. Original data was collected in a single step. Coincidental sampling method was used in determining the consumers who are the data sources. Since there hasn’t been any study about consumption of these products in research region, the ratio was accepted as 50% in order to reach the maximum sample that will represent the population(Newbold2007).
The formula above has been used to determine the number of samples and the sample volume has been determined as 770 (385 individuals in urban region and 385 individuals in rural region).
Where; n, sample volume; z α/2, confidence level (the coefficient for 95% confidence is accepted as 1.96); p, the proportion of conscious consumers about food safety; q, 1-p (the proportion of the unconscious consumers about food safety); d, the proportion of accepted sampling error (5%).
2.2. Data analysis 2.2.1. Factor analysis
Answers of the questions determining the attitudes of consumers, who take place in this study, towards food safety in buying food products were obtained with quintet likert scale. Because of the number of criteria that shows the behaviour and attitude of consumers varying with the level of their knowledge about scaled food safety are too much, it is not possible to use this criteria as explicative variables. Therefore, the variables need to be illustrated synoptically. In this study, the summarizing of the variables has been done with factor analysis by courtesy of PASW 18.0 pack program.
Initially, the aptness of the data for the factor analysis has been analysed with the KMO (Kaiser-Mayer-Olkin) test. Kaiser-Meyer-Olkin: Measure of sampling adequacy is used to compare the magnitudes of the observed correlation coefficients in relation to the magnitudes of the partial correlation coefficients. Large KMO values are good because correlations between pairs of variables (i.e., potential factors) can be explained by the other variables. If the KMO is below 0.50,don’t do a factor analysis. The KMO value was 0.79 and the fact that the KMO value is higher than 0.50 shows that the variants are suitable for factor analysis and the number is sufficient. In addition to that, a global test has been made, according to the result; it has been shown that the samples drawn are at a level that can represent the population.
According to the results of Factor Analysis, five factors were chosen because they explained a high proportion of original variance and had Eigen value higher than one. Globally explained 54.4% of variance respectively. The contribution of the variables to the main factors obtained in the PCA regarding effect to be information about food safety and variance explained are shown in Table 1.
385 ) 5 . 0 ( ) 5 . 0 ( 05 . 0 96 . 1 2 n
The formula above has been used to determine the number of samples and the sample volume has been determined as 770 (385 individuals in urban region and 385 individuals in rural region).
Where; n, sample volume; z α/2, confidence level (the coefficient for 95% confidence is accepted as 1.96); p, the proportion of conscious consumers about food safety; q, 1-p (the proportion of the unconscious consumers about food safety); d, the proportion of accepted sampling error (5%).
2.2. Data analysis 2.2.1. Factor analysis
Answers of the questions determining the attitudes of consumers, who take place in this study, towards food safety in buying food products were obtained with quintet likert scale. Because of the number of criteria that shows the behaviour and attitude of consumers varying with the level of their knowledge about scaled food safety are too much, it is not
Consumer Food Safety Knowledge, Practices and Differences in Behaviors in Thrace Region of Turkey, Yılmaz et al
282
Ta r ı m B i l i m l e r i D e r g i s i – J o u r n a l o f A g r i c u l t u r a l S c i e n c e s 21 (2015) 279-287 possible to use this criteria as explicative variables.Therefore, the variables need to be illustrated synoptically. In this study, the summarizing of the variables has been done with factor analysis by courtesy of PASW 18.0 pack program.
Initially, the aptness of the data for the factor analysis has been analysed with the KMO (Kaiser-Mayer-Olkin) test. Kaiser-Meyer-Olkin: Measure of sampling adequacy is used to compare the magnitudes of the observed correlation coefficients in relation to the magnitudes of the partial correlation coefficients. Large KMO values are good because correlations between pairs of variables (i.e., potential factors) can be explained by the other variables. If the KMO is below 0.50, don’t do a factor analysis. The KMO value was 0.79 and the fact that the KMO value is higher than 0.50 shows that the variants
are suitable for factor analysis and the number is sufficient. In addition to that, a global test has been made, according to the result; it has been shown that the samples drawn are at a level that can represent the population.
According to the results of Factor Analysis, five factors were chosen because they explained a high proportion of original variance and had Eigen value higher than one. Globally explained 54.4% of variance respectively. The contribution of the variables to the main factors obtained in the PCA regarding effect to be information about food safety and variance explained are shown in Table 1.
2.2.2. Logit analysis
Logit model, which is generated as an alternative to probit model in order to solve the problems Table 1- Factor analysis rotation solution
Çizelge 1- Faktör analizi rotasyon sonuçları
Factor 1 2 3 4 5
Consciousness of food content, suit-able preparation of food and buying it with consciousness
Read label information of food products 0.785
I research the content of food which I have bought 0.780
Cooking and preserving according to the instructions 0.657
Preferring foods that the certificated of HACCP, ISO
and TSE 0.632
Being careful with the cleaning of the store 0.587
Not using products that have expiration date 0.351
Willingness for paying extra money for safety food
Ignoring the costs of some foods 0.870
Agreeing to pay much money for foods products that
have no hormone 0.422
Quality and price Believing that costly foods are more quality 0.856
Brands food are more quality 0.806
Being affected by advertisements while buying foods 0.570
Natural foods and use of food addi-tives
It is necessary to use additives to the foods for its taste
and quality -0.645
Consuming products that don’t include additives 0.634
Food additives affect health badly 0.520
Caring for buying organic and natural foods 0.520
Eating three meals regularly 0.477
Environmental
Trakya Bölgesindeki Tüketicilerin Gıda Güvenliği Konusunda Bilgi,Uygulama ve Davranışlarındaki Farklılıklar, Yılmaz et al
283
Ta r ı m B i l i m l e r i D e r g i s i – J o u r n a l o f A g r i c u l t u r a l S c i e n c e s 21 (2015) 279-287 encountered in linear probability model, is
more desirable in application and being used more commonly. Although, it is the same as the probit model in respect of formation process, it is distinguished from probit model in respect of cumulative dispersal function (CDF) which it is based on (Özer 2004). The probability of an individual having knowledge about food safety is indicated with;
4 Table 1- Factoranalysis rotation solution
Çizelge 1-Faktöranalizirotasyonsonuçları
Factor 1 2 3 4 5
Consciousness of food content, suitable preparation of food and buying it with consciousness
Read label information of food products 0.785 I research the content of food which I have bought 0.780 Cooking and preserving according to the instructions 0.657 Preferring foods that the certificated of HACCP, ISO
and TSE 0.632
Being careful with the cleaning of the store 0.587 Not using products that have expiration date 0.351 Willingness for
paying extra money for safety food
Ignoring the costs of some foods 0.870 Agreeing to pay much money for foods products that
have no hormone 0.422
Quality and price Believing that costly foods are more quality 0.856 Brands food are more quality 0.806 Being affected by advertisements while buying foods 0.570 Natural foods and
use of food additives It is necessary to use additives to the foods for its taste and quality -0.645 Consuming products that don’t include additives 0.634 Food additives affect health badly 0.520 Caring for buying organic and natural foods 0.520
Eating three meals regularly 0.477
Environmental
knowledge Check whether the product harms the environment or not 0.846
2.2.2. Logit analysis (1) or (2) Here, (3)
and equation (2) is known as (cumulative) logistic dispersal function. It is known that while Zi varies from - to
+, Pi takes values between 0 and 1, and Pi has non-linear relation with Zi.
If the probability of having knowledge about food safety is Pi,probability of buying is in (1-Pi) form
i Z i e P 1 1 1 (4)
Therefore this can be written;
i i i Z Z Z i i e e e P P 1 1 1 (5)
In this case, the odds of having knowledge are Pi / (1-Pi). The following result is obtained if the natural
logarithm of this equation is taken;
i i i i PP Z L 1 ln (6) k kX X 1 2 2 .... X kXk i EY X e P 12 2 1 1 ) 1 ( Z i e P 1 1 k k i X X Z 12 2 (1) or 4 Table 1- Factoranalysis rotation solution
Çizelge 1-Faktöranalizirotasyonsonuçları
Factor 1 2 3 4 5
Consciousness of food content, suitable preparation of food and buying it with consciousness
Read label information of food products 0.785 I research the content of food which I have bought 0.780 Cooking and preserving according to the instructions 0.657 Preferring foods that the certificated of HACCP, ISO
and TSE 0.632
Being careful with the cleaning of the store 0.587 Not using products that have expiration date 0.351 Willingness for
paying extra money for safety food
Ignoring the costs of some foods 0.870 Agreeing to pay much money for foods products that
have no hormone 0.422
Quality and price Believing that costly foods are more quality 0.856 Brands food are more quality 0.806 Being affected by advertisements while buying foods 0.570 Natural foods and
use of food additives It is necessary to use additives to the foods for its taste and quality -0.645 Consuming products that don’t include additives 0.634 Food additives affect health badly 0.520 Caring for buying organic and natural foods 0.520
Eating three meals regularly 0.477
Environmental
knowledge Check whether the product harms the environment or not 0.846
2.2.2. Logit analysis (1) or (2) Here, (3)
and equation (2) is known as (cumulative) logistic dispersal function. It is known that while Zi varies from - to
+, Pi takes values between 0 and 1, and Pi has non-linear relation with Zi.
If the probability of having knowledge about food safety is Pi,probability of buying is in (1-Pi) form
i Z i e P 1 1 1 (4)
Therefore this can be written;
i i i Z Z Z i i e e e P P 11 1 (5)
In this case, the odds of having knowledge are Pi / (1-Pi). The following result is obtained if the natural
logarithm of this equation is taken;
i i i i PP Z L 1 ln (6) k kX X 1 2 2 .... X kXk i EY X e P 2 2 1 1 1 ) 1 ( Z i e P 1 1 k k i X X Z 12 2 (2) Here, 4 Table 1- Factoranalysis rotation solution
Çizelge 1-Faktöranalizirotasyonsonuçları
Factor 1 2 3 4 5
Consciousness of food content, suitable preparation of food and buying it with consciousness
Read label information of food products 0.785 I research the content of food which I have bought 0.780 Cooking and preserving according to the instructions 0.657 Preferring foods that the certificated of HACCP, ISO
and TSE 0.632
Being careful with the cleaning of the store 0.587 Not using products that have expiration date 0.351 Willingness for
paying extra money for safety food
Ignoring the costs of some foods 0.870 Agreeing to pay much money for foods products that
have no hormone 0.422
Quality and price Believing that costly foods are more quality 0.856 Brands food are more quality 0.806 Being affected by advertisements while buying foods 0.570 Natural foods and
use of food additives It is necessary to use additives to the foods for its taste and quality -0.645 Consuming products that don’t include additives 0.634 Food additives affect health badly 0.520 Caring for buying organic and natural foods 0.520
Eating three meals regularly 0.477
Environmental
knowledge Check whether the product harms the environment or not 0.846
2.2.2. Logit analysis (1) or (2) Here, (3)
and equation (2) is known as (cumulative) logistic dispersal function. It is known that while Zi varies from - to
+, Pi takes values between 0 and 1, and Pi has non-linear relation with Zi.
If the probability of having knowledge about food safety is Pi,probability of buying is in (1-Pi) form
i Z i e P 1 1 1 (4)
Therefore this can be written;
i i i Z Z Z i i e e e P P 1 1 1 (5)
In this case, the odds of having knowledge are Pi / (1-Pi). The following result is obtained if the natural
logarithm of this equation is taken;
i i i i PP Z L 1 ln (6) k kX X 1 2 2 .... X kXk i EY X e P 2 2 1 1 1 ) 1 ( Z i e P 1 1 k k i X X Z 12 2 (3)
and equation (2) is known as (cumulative) logistic dispersal function. It is known that while Zi varies from -∞ to +∞, Pi takes values between 0 and 1, and
Pi has non-linear relation with Zi.
If the probability of having knowledge about food safety is Pi,probability of buying is in (1-Pi) form
4
Çizelge 1-Faktöranalizirotasyonsonuçları
Factor 1 2 3 4 5
Consciousness of food content, suitable preparation of food and buying it with consciousness
Read label information of food products 0.785 I research the content of food which I have bought 0.780 Cooking and preserving according to the instructions 0.657 Preferring foods that the certificated of HACCP, ISO
and TSE 0.632
Being careful with the cleaning of the store 0.587 Not using products that have expiration date 0.351 Willingness for
paying extra money for safety food
Ignoring the costs of some foods 0.870 Agreeing to pay much money for foods products that
have no hormone 0.422
Quality and price Believing that costly foods are more quality 0.856 Brands food are more quality 0.806 Being affected by advertisements while buying foods 0.570 Natural foods and
use of food additives It is necessary to use additives to the foods for its taste and quality -0.645 Consuming products that don’t include additives 0.634 Food additives affect health badly 0.520 Caring for buying organic and natural foods 0.520
Eating three meals regularly 0.477
Environmental
knowledge Check whether the product harms the environment or not 0.846
2.2.2. Logit analysis (1) or (2) Here, (3)
and equation (2) is known as (cumulative) logistic dispersal function. It is known that while Zi varies from - to
+, Pi takes values between 0 and 1, and Pi has non-linear relation with Zi.
If the probability of having knowledge about food safety is Pi,probability of buying is in (1-Pi) form
i Z i e P 1 1 1 (4)
Therefore this can be written;
i i i Z Z Z i i e e e P P 1 1 1 (5)
In this case, the odds of having knowledge are Pi / (1-Pi). The following result is obtained if the natural
logarithm of this equation is taken;
i i i i PP Z L 1 ln (6) k kX X 1 2 2 .... X kXk i e X Y E P 2 2 1 1 1 ) 1 ( Z i e P 1 1 k k i X X Z 12 2 (4) Therefore this can be written;
4 Table 1- Factoranalysis rotation solution
Çizelge 1-Faktöranalizirotasyonsonuçları
Factor 1 2 3 4 5
Consciousness of food content, suitable preparation of food and buying it with consciousness
Read label information of food products 0.785 I research the content of food which I have bought 0.780 Cooking and preserving according to the instructions 0.657 Preferring foods that the certificated of HACCP, ISO
and TSE 0.632
Being careful with the cleaning of the store 0.587 Not using products that have expiration date 0.351 Willingness for
paying extra money for safety food
Ignoring the costs of some foods 0.870 Agreeing to pay much money for foods products that
have no hormone 0.422
Quality and price Believing that costly foods are more quality 0.856 Brands food are more quality 0.806 Being affected by advertisements while buying foods 0.570 Natural foods and
use of food additives It is necessary to use additives to the foods for its taste and quality -0.645 Consuming products that don’t include additives 0.634 Food additives affect health badly 0.520 Caring for buying organic and natural foods 0.520
Eating three meals regularly 0.477
Environmental
knowledge Check whether the product harms the environment or not 0.846
2.2.2. Logit analysis (1) or (2) Here, (3)
and equation (2) is known as (cumulative) logistic dispersal function. It is known that while Zi varies from - to
+, Pi takes values between 0 and 1, and Pi has non-linear relation with Zi.
If the probability of having knowledge about food safety is Pi,probability of buying is in (1-Pi) form
i Z i e P 1 1 1 (4)
Therefore this can be written;
i i i Z Z Z i i e e e P P 1 1 1 (5)
In this case, the odds of having knowledge are Pi / (1-Pi). The following result is obtained if the natural
logarithm of this equation is taken;
i i i i PP Z L 1 ln (6) k kX X 1 2 2 .... X kXk i e X Y E P 2 2 1 1 1 ) 1 ( Z i e P 1 1 k k i X X Z 12 2 (5) In this case, the odds of having knowledge are Pi / (1-Pi). The following result is obtained if the natural logarithm of this equation is taken;
4 Table 1- Factoranalysis rotation solution
Çizelge 1-Faktöranalizirotasyonsonuçları
Factor 1 2 3 4 5
Consciousness of food content, suitable preparation of food and buying it with consciousness
Read label information of food products 0.785 I research the content of food which I have bought 0.780 Cooking and preserving according to the instructions 0.657 Preferring foods that the certificated of HACCP, ISO
and TSE 0.632
Being careful with the cleaning of the store 0.587 Not using products that have expiration date 0.351 Willingness for
paying extra money for safety food
Ignoring the costs of some foods 0.870 Agreeing to pay much money for foods products that
have no hormone 0.422
Quality and price Believing that costly foods are more quality 0.856 Brands food are more quality 0.806 Being affected by advertisements while buying foods 0.570 Natural foods and
use of food additives It is necessary to use additives to the foods for its taste and quality -0.645 Consuming products that don’t include additives 0.634 Food additives affect health badly 0.520 Caring for buying organic and natural foods 0.520
Eating three meals regularly 0.477
Environmental
knowledge Check whether the product harms the environment or not 0.846
2.2.2. Logit analysis (1) or (2) Here, (3)
and equation (2) is known as (cumulative) logistic dispersal function. It is known that while Zi varies from - to
+, Pi takes values between 0 and 1, and Pi has non-linear relation with Zi.
If the probability of having knowledge about food safety is Pi,probability of buying is in (1-Pi) form
i Z i e P 1 1 1 (4)
Therefore this can be written;
i i i Z Z Z i i e e e P P 1 1 1 (5)
In this case, the odds of having knowledge are Pi / (1-Pi). The following result is obtained if the natural
logarithm of this equation is taken;
i i i i PP Z L 1 ln (6) k kX X 1 2 2 .... X kXk i e X Y E P 1 12 2 1 ) 1 ( Z i e P 1 1 k k i X X Z 12 2 (6)
Logarithm of odds, L, is not only linear to the X but also to linear the coefficients of main body. L is called logit and the logit model comes from the equation (6) (Gujarati 1999). The variables used in the model and their values are given in the equation shown below and in Table 2, respectively.
Ratio of probability of Ln [Pi/(1-Pi)] shows the
probability of consumers having knowledge about food safety.
Table 2- Definition of the variables
Çizelge 2- Değişkenlerin tanımlanması Dependent variable
Safety 10 Knowledge about food safetyNon-knowledge about food safety
Independent variables
Gender 1 Female
0 Male
Rural area 1 Urban
0 Rural Education 1 Non-education 2 Primary school 3 Secondary School 4 High school 5 University
Factor 1 Consciousness of food contents, suitable preparation of food and buying it with consciousness
Factor 2 Willingness for paying extra money for healthy food
Factor 3 Quality and price
Factor 4 Natural foods and use of food additives
Consumer Food Safety Knowledge, Practices and Differences in Behaviors in Thrace Region of Turkey, Yılmaz et al
284
Ta r ı m B i l i m l e r i D e r g i s i – J o u r n a l o f A g r i c u l t u r a l S c i e n c e s 21 (2015) 279-287Ln [Pi/(1-Pi)]= Yi= β0+ β1F1+ β2F2+β3F3+ β4F4+ β5F5+β6W+β7GENDER+β8EDU1+β9 EDU2+β10
EDU3+ β11 EDU4 (7)
This method has many statistical properties. All of the estimators are coherent and asymptotically active. In the logit model estimated with maximum likelihood method, likelihood ratio (LR) test can be applied when significance of all or part of the coefficients is tested (Pindyck & Rubinfeld 1991). In addition to this, in regards of suitability of concord, R2 value is not being accepted as a correct
scale for logit models (Thomas 2000). Alongside suggesting many alternatives as suitability of concord, Nagelkerke R2 value was used. When the
independent variables in the model are examined for whether they have a significant effect or not, the hypothesis is created as follows (Greene 1997).
H0: β1 = β2 =....= .βk = 0 H1: β1 ≠ β2 ≠.... ≠ .βk ≠ 0
Odds ratio represents how many folds the possibility of realization is affected by the dependant variable if the related independent variable takes 1 (one) or
zero (0) value when the other variables are constant. In addition to this, if the coefficients of regression take a negative value, the odds ratios of these coefficients must be corrected as OO= 1/OO, in principle (Özdamar 2004).
3. Results and Discussion
In this study, some demographic and socio-economic indicators of individuals taking the survey were investigated (Table 3). In this study, 770 individuals (385 from urban, 385 from rural), who are living in Thrace region (Edirne, Tekirdağ, Kırklareli) and effective in the decision of the food, were interviewed face-to-face. Of the individuals interviewed, there are 557 females (72.3%) and 213 males (27.7%). Survey was conducted with 353 individuals (45.9%) in Tekirdag city, 230 individuals in Edirne city (29.9%) and 187 individuals in Kırklareli city (24.2%).
Answers of the questions determining the tendency of consumers towards food safety and consumption, when they are buying food products, Table 3- Demographic characteristics of the individuals research area
Çizelge 3- Araştırma alanına ait demografik kriterler
Gender Urban % Rural % Number %
Female 283 36.8 274 35.6 557 72.3 Male 102 13.2 111 14.4 213 27.7 Education level Non-education - - 6 0.8 6 0.8 Primary school 143 18.6 298 38.7 441 57.3 Secondary School 47 6.1 51 6.6 98 12.7 High school 113 14.7 31 4.0 144 18.7 University 79 10.3 2 0.3 81 10.5 Number of family 1-2 36 4.7 26 3.4 62 8.1 3-5 313 40.7 299 38.9 612 79.4 6-8 36 4.7 58 7.5 94 12.2 9- + - - 2 0.3 2 0.3 Income (monthly)(YTL) < 350 1 0.1 13 1.7 14 1.8 351-500 21 2.7 72 9.4 93 12.1 501-1000 117 15.2 171 22.2 288 37.4 1001-1500 115 14.9 89 11.6 204 26.5 1501-2000 62 8.1 30 3.9 92 11.9 2000 < 69 9.0 10 1.3 79 10.2 Total 385 100.0 385 100.0 770 100.0
Trakya Bölgesindeki Tüketicilerin Gıda Güvenliği Konusunda Bilgi,Uygulama ve Davranışlarındaki Farklılıklar, Yılmaz et al
285
Ta r ı m B i l i m l e r i D e r g i s i – J o u r n a l o f A g r i c u l t u r a l S c i e n c e s 21 (2015) 279-287 were obtained with quintet likert scale. Because of
the number of criteria that shows the behaviour and attitude of consumers varying with the level of their knowledge about scaled food safety are too much, it is not possible to use this criteria as explicative variables. Therefore, the variables need to be illustrated synoptically. In this study, the summarizing of the variables has been done with factor analysis and these factors were used as explicative variables in Logit analysis. The factors can be estimated as the linear components of the observed variables when they are subtracted from the observed variables. General estimate equation of the Fj, which is the jth
factor, can be expressed as follows:
6
Female 283 36.8 274 35.6 557 72.3 Male 102 13.2 111 14.4 213 27.7 Education level Non-education - - 6 0.8 6 0.8 Primary school 143 18.6 298 38.7 441 57.3 Secondary School 47 6.1 51 6.6 98 12.7 High school 113 14.7 31 4.0 144 18.7 University 79 10.3 2 0.3 81 10.5 Number of family 1-2 36 4.7 26 3.4 62 8.1 3-5 313 40.7 299 38.9 612 79.4 6-8 36 4.7 58 7.5 94 12.2 9- + - - 2 0.3 2 0.3 Income (monthly)(YTL) < 350 1 0.1 13 1.7 14 1.8 351-500 21 2.7 72 9.4 93 12.1 501-1000 117 15.2 171 22.2 288 37.4 1001-1500 115 14.9 89 11.6 204 26.5 1501-2000 62 8.1 30 3.9 92 11.9 2000 < 69 9.0 10 1.3 79 10.2 Total 385 100.0 385 100.0 770 100.0Answers of the questions determining the tendency of consumers towards food safety and consumption, when they are buying food products, were obtained with quintet likert scale. Because of the number of criteria that shows the behaviour and attitude of consumers varying with the level of their knowledge about scaled food safety are too much, it is not possible to use this criteria as explicative variables. Therefore, the variables need to be illustrated synoptically. In this study, the summarizing of the variables has been done with factor analysis and these factors were used as explicative variables in Logit analysis. The factors can be estimated as the linear components of the observed variables when they are subtracted from the observed variables. General estimate equation of the Fj, which is the jth factor, can be expressed as follows:
p j Wj X Wj X ... WjpXp Fj 1 1 1 2 2Where; Wj is the coefficients of factor; P is the number of variables
Eigen value is taken as 1 in factor analysis. Kaiser-Meyer-Olkin measure of sampling adequacy is calculated as 0.791. According to Kaiser’s measure this is a mid-grade size equation. Barlett’s sphericity test is significant (P<0.01). Therefore data is suitable to apply factor analysis (Pett et al 2003).
The factors, which were examined to explain the attitudes of consumers when they are buying food products, were gathered in five main groups. The factor namings were done based on attitude groupings formed underlying this factor. First factor is the biggest factor and explains 17.5% of the variance. This factor was named as “the factor of consciousness of food content, appropriate preparation and conscious shopping”. It contains the variables showing the buying behaviour of individuals who do the shopping in the family. The factor of the demand for paying more for healthy food accounts for 10.6%, the factor of quality and price accounts for 10.2%, the factor of use of natural product and additives accounts for 9.9%, factor of environmental conscious accounts for 6.2% of the variance. These factors accounts for 54.4% of preference variation for the total group. These results indicate which factors are considered when consumers are making a decision.
An inverse relationship was observed between opinions for negative influence of using food additives on health, taking pains to buy organic and natural products, eating regularly three meals, consuming products which do not contain any additives and opinions for necessity of using additives for taste.
After summarizing the variables by the help of factor analysis, the factor groups, which are effective in individuals being knowledgeable about food safety, used as explicative variables in logit analysis. In this model, the variable of individuals being knowledgeable about food safety is used as dependant variable whereas the variables of gender, living in town or city, level of education and factor groups (F1, F2, F3, F4, F5) are used as
explicative variables.
(8) Where; Wj is the coefficients of factor; P is the number of variables
Eigen value is taken as 1 in factor analysis. Kaiser-Meyer-Olkin measure of sampling adequacy is calculated as 0.791. According to Kaiser’s measure this is a mid-grade size equation. Barlett’s sphericity test is significant (P<0.01). Therefore data is suitable to apply factor analysis (Pett et al 2003).
The factors, which were examined to explain the attitudes of consumers when they are buying food products, were gathered in five main groups. The factor namings were done based on attitude groupings formed underlying this factor. First factor is the biggest factor and explains 17.5% of the variance. This factor was named as “the factor of consciousness of food content, appropriate preparation and conscious shopping”. It contains the variables showing the buying behaviour of individuals who do the shopping in the family. The factor of the demand for paying more for healthy food accounts for 10.6%, the factor of quality and price accounts for 10.2%, the factor of use of natural product and additives accounts for 9.9%, factor of environmental conscious accounts for 6.2% of the variance. These factors accounts for 54.4% of preference variation for the total group. These results indicate which factors are considered when consumers are making a decision.
An inverse relationship was observed between opinions for negative influence of using food additives on health, taking pains to buy organic and natural products, eating regularly three meals, consuming products which do not contain any additives and opinions for necessity of using additives for taste.
After summarizing the variables by the help of factor analysis, the factor groups, which are effective in individuals being knowledgeable about food safety, used as explicative variables in logit analysis. In this model, the variable of individuals being knowledgeable about food safety is used as dependant variable whereas the variables of gender, living in town or city, level of education and factor groups (F1, F2, F3, F4, F5) are used
as explicative variables.
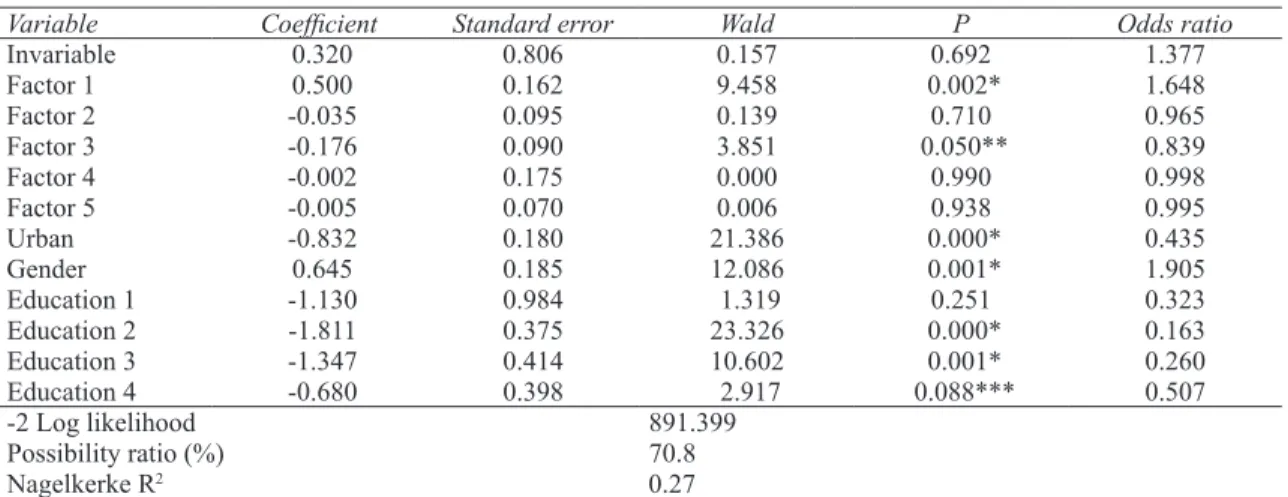
According to the results of the estimate, it was determined that variables of town-city and education are statistically significant and coefficients of slope are concordant with the expectations. [H0: βk=0; H1: βk≠0; t βk= βk/s(βk)]. Among the variables of factor
groups, only variables of the first (food content conscious, appropriate preparation and conscious buying) and the third (quality and price) factor groups were determined as statistically significant. Coefficients of the model and statistical values are illustrated in Table 4.
The table value for χ2 is 20.09 with 8 degrees
of freedom, at 1% significance level. H0 is rejected because of the LR statistics of the model (891.399) > χ2
0.01,8. The model was determined as
statistically significant (Table 4).
In the event of explaining some Odds ratio, Odds ratio of FACTOR 1 variable was calculated as 1.648. This coefficient indicates that the individual, who gives importance to this factor group, is being 1.648 fold more knowledgeable about food safety. The odds ratio of Urban variable was calculated as 0.435 and the Odds ratio calculated after the correction is OO= 1/0.435= 2.297. This ratio indicates a city-origin individual is being 2.297 fold more knowledgeable about food safety. Also, odds ratio of GENDER variable was calculated as 1.9. This ratio indicates women are being 1.9 fold more knowledgeable about food safety than men. Table 4 represents the odds ratios calculated for every one of the estimators.
Consumer Food Safety Knowledge, Practices and Differences in Behaviors in Thrace Region of Turkey, Yılmaz et al
286
Ta r ı m B i l i m l e r i D e r g i s i – J o u r n a l o f A g r i c u l t u r a l S c i e n c e s 21 (2015) 279-287 Education is a variable that affects an individualto behave consciously and correctly in behaviour of buying. The education of mother is important in buying and preparing food products. Level of education is an effective factor in those individuals buying quality and healthy products, too.
4. Conclusions
The factors, which were examined to explain the attitudes of consumers when they are buying food products, were gathered in five main groups. First factor is the biggest factor and explains 17.5% of the variance. This factor was named as “the factor of consciousness of food content, appropriate preparation and conscious shopping”. It contains the variables showing the buying behaviour of individuals who do the shopping in the family. The factor of the demand for paying more for healthy food accounts for 10.6%, the factor of quality and price accounts for 10.2%, the factor of use of natural product and additives accounts for 9.9%, factor of environmental conscious accounts for 6.2% of the variance.
The factors affecting the individuals in being knowledgeable about food safety were analyzed with Logit model. According to the results of the estimate, it was determined that variables of
urban and education are statistically significant and coefficients of slope are concordant with the expectations. Among the variables of factor groups, only variables of the first (food content conscious,
appropriate preparation and conscious buying)
and the third (quality and price) factor groups were determined as statistically significant.
Special days and campaigns should be organized in order to inform the consumer and create a public opinion so as to develop the habit of healthy diet. Mass communication tools should be benefitted for this purpose. Educating consumers by broadcasting effective programs on various media organs, especially on TV, will be extremely beneficial in order to make consumers eat consciously and use their income reasonably in this way.
In Turkish society, it is required to create consumer conscious in every topic. In order to form conscious consumers, importance must be paid in educating every consumer beginning from when they were young.
In future, research priority must be given to study more in details opinion about consumer expectation and behaviour for food safety in Turkey.
Future research is needed to explore whether the factors that influence the perception of food Table 4- Results of logit model
Çizelge 4- Logit model sonuçları
Variable Coefficient Standard error Wald P Odds ratio
Invariable 0.320 0.806 0.157 0.692 1.377 Factor 1 0.500 0.162 9.458 0.002* 1.648 Factor 2 -0.035 0.095 0.139 0.710 0.965 Factor 3 -0.176 0.090 3.851 0.050** 0.839 Factor 4 -0.002 0.175 0.000 0.990 0.998 Factor 5 -0.005 0.070 0.006 0.938 0.995 Urban -0.832 0.180 21.386 0.000* 0.435 Gender 0.645 0.185 12.086 0.001* 1.905 Education 1 -1.130 0.984 1.319 0.251 0.323 Education 2 -1.811 0.375 23.326 0.000* 0.163 Education 3 -1.347 0.414 10.602 0.001* 0.260 Education 4 -0.680 0.398 2.917 0.088*** 0.507 -2 Log likelihood 891.399 Possibility ratio (%) 70.8 Nagelkerke R2 0.27
287
Ta r ı m B i l i m l e r i D e r g i s i – J o u r n a l o f A g r i c u l t u r a l S c i e n c e s 21 (2015) 279-287 safety risk differ from the factors that influence the
actual response to food safety. Given the rationale for offsetting behaviour in food safety, consumers’ food expenditure decisions can be affected by the availability of food safety information, the nature of the supply chain to produce a final product, and consumers’ timing of decision making. The motivation behind implementing food safety policies in the food sector is to guarantee the well– being of consumers.
References
Albert J A (1995). Food safety knowledge and practices of consumers in the USA. Journal of Consumer Studies
and Home Economics 19: 119–134
Bruhn C M & Schutz H G (1999). Consumer food safety knowledge and practices, Journal of Food Safety 19: 73–87
Dölekoğlu C Ö (2002). Tüketicilerin İşlenmiş Gıda Ürünlerinde Kalite Tercihleri, Sağlık Riskine Karşı Tutumları ve Besin Bileşimi Konusunda Bilgi Düzeyleri (Adana Örneği). Doktora Tezi, Çukurova Üniversitesi, Fen Bilimleri Enstitüsü Tarım Ekonomisi ABD (Basılmamış), Adana
Etiler N (2001). Gıda Hijyeni. Sağlık ve Toplum Dergisi 3: 6-12
FAO/WHO (2009). Assuring food safety and quality: guidelines for strengthening national food control systems http://www. who. int/foodsafety/publications/ capacity/en/Englsih_Guidelines_Food_control. pdf>. (Retrieved 05.11.09)
Garayoa R, Cordoba M, Garcia-Jalon I, Sanchez-Villegas A, & Vitas A I (2005). Relationship between consumer food safety knowledge and reported behavior among students from health sciences in one region of Spain. Journal of Food Protection 68(12): 2631-2636 Gilbert L C (2000). The functional food trend: what’s next
and what American think about eggs. Journal of the
American College of Nutrition 19(5): 507-512
Greene W (1997). Econometric Analysis, 3rd ed., New
Jersey, Prentice-Hall: pp.886-887
Gujarati N D (1999). Temel Ekonometri. Çeviren: Şenesen Ü, Şenesen G G, Literatür yayıncılık, İstanbul Henson S & Traill B (1993). The demand for food safety:
market imperfections and the role of government.
Food Policy 18(2): 152–162
IFIC (2000). International food information council functional foods attitudinal research. http://www.ific. org (Retrieved: 10.01.2012)
İşyar Y (1994). Ekonometrik Modeller. Uludağ Üniversitesi Basımevi, Bursa
Morrone M & Rathburn A (2003). Health education and food safety behavior in the university setting. Journal
of Environmental Health 65: 9–15
Newbold P (2007). İşletme ve İktisat için İstatistik. Literatür Yayınları, İstanbul
Oraman Y, Yılmaz E, & İnan İ H (2009). Consumers’ Food Scares and Trust: A Thrace Regıon Study,
International Conference on Sustaınable Development In Southeast Europe (BENA). 16-18 June, Namık
Kemal University, Tekirdağ, Turkey
Özdamar K (2004). Paket Programlar İle İstatiksel Veri Analizi. Kaan Kitapevi, Genişletilmiş 5. Baskı, Ankara
Özer H (2004). Nitel Değişkenli Ekonometrik Modeller: Teori ve Bir Uygulama. Nobel Yayın Dağıtım, Ankara Pett M A, Lackey N R & Sullivan J J (2003). Making
Sense of Factor Analysis. Paperback ISBN: 9780761919506, Sage Publications
Pindyck R S & Rubinfeld D L (1991). Econometric Models and Economic Forecasts, 3rd, McGrawHill, Inc., New York
Rimal A S M, Fletcher K H, McWatters S K & Deodhar S (2001). Perception of food safety and changes in food consumption habits: a consumer analysis. International
Journal of Consumer Studies 25(1): 43–52
Shepherd R (1989). Factors influencing food preferences and choice. In: R. Shepherd, Editor, Handbook of
psychophysiology of human eating, Wiley, Chichester:
3–24
Thomas R L (2000). Modern Econometrics: An Introduction, Addison-Wesley, New York
Topuzoğlu A, Hıdıroğlu S, Ay P, Önsüz F & İkiışık H (2007). Tüketicilerin Gıda Ürünleri İle İlgili Bilgi Düzeyleri ve Sağlık Riskine Karşı Tutumları. TSK
Koruyucu Hekimlik Bülteni 6(4): 253-258
Unklesbay N, Sneed J & Toma R (1998). College students’ attitudes and knowledge of food safety. Journal of
Food Protection 61: 1175–1180
Unusan N (2007). Consumer food safety knowledge and practices in the home in Turkey. Food Control 18(1): 45-51
Wandel M (1994). Understanding consumer concern about food-related health risks. British Food Journal 96(7): 35-40
Worsley A & Lea E (2008). Consumer concerns about food and health, Examination of general and specific relationships with personal values and demographics.