THE REFLECTIONS OF HEALTH SPENDING ON THE COMMUNITY HEALTH:
COMPARATIVE ANALYSIS OF EMERGING COUNTRIES
Volkan ÖNGEL
(Corresponding Author)
Assistant Professor at Beykent University [email protected]
Beykent University, Ayazağa Mah. Hadım Koruyolu Caddesi, Ayazağa, İstanbul – Turkey
+0905354573409
M.Şahin GÖK
Assistant Professor at Gebze Institute of Technology [email protected]
Gebze Institute of Technology, P.K : 141 41400 Gebze, KOCAELİ– Turkey
+0905054766785
ABSTRACT
n the current economic system, efficient usage of limited resources has gained more importance. Besides enhancing the life quality especially in the health care, the efficient usage of the resources has come into prominence with the intention of providing service at the highest level possible. The main goal of this study is to evaluate the efficiency of the health care expenses to enhance the community health by means of analyzing the BRICS countries, known as growing economies (Brazil, the Russian Federation, India, China and South Africa). For that purpose, the comparative performance of each country for the period between 2008 and 2012 has been analyzed by use of Data Envelopment Analysis (DEA) technique. Moreover, the effect of the loss at the health care expenses has been analyzed within this study. The study outputs manifested that the BRICS countries have a linear trend shaped with positive and negative ends about the health care expenses and clearly revealed the effect of the loss at the health care expenses. In this sense, the study provides significant outputs and suggestions to the policymakers and decision-makers about the health care system in the BRICS countries.
KeyWords: Healthcare Expenditure, Life Quality, BRICS, Data
Envelopment Analysis
Jel Code: I10, I15
I
1.Introduction
BRICS term is used for referring to the emerging economies of Brazil, Russia, India, China and South Africa. BRICS is formed with the initials of the English names of these countries (Brazil, Russia, India, China, South Africa). Looking at the current data of 2014, BRICS countries represents the 3 billion people who make up %40 of world population. Its gross national product figure which makes %20 of the world’s figure is 16.039trillion American dollars. When based on 2014, BRICS countries represent the %18 of world economy. Due to economic and a variety of demographic advantages, BRICS which is assumed to be one of the most important country groups in 2050 is anticipated to transform into a powerful union especially against China and American economies (O’Neill, 2011).
As an important note, it states that the Republic of South Africa is officially joined this group in 2010. BRICS economies are known to be expert (with comparative superiority) generally in the export of raw materials and labor-intensive products (Erkan, 2012). Especially, to reach the utopia of reaching the strong world economy in 2050, the developmental potential of these countries must be very carefully examined and evaluated. For this reason, probable new county candidacies in the near future and objective analysis of the current countries should be put forward. Economy experts foresee that these countries will transform into a more different structure with the effect of global changes (Frank and Frank, 2010). Again as an additional note, Indonesia and Turkey rank among the BRICS candidate countries.
BRICS countries will catch up to G7 countries in the near future in the direction of growing trends and predictions. China’s, which is in the leader position among BRICS countries, sole contribution to global growth and the trend they have caught in the emerging economies are also important (Gömleksiz and Alagöz, 2012). India and Brazil, under the World Trade Organization, have always continuously been among in the "developing countries" classification. Due to following a low profile, China couldn’t have realized the necessary economic breakthroughs until recent years. South Africa is a country which fails to form alliances with developing and growing country. Even so, when evaluated as a whole as BRICS, the potential power they pose comes forth (Nayyar, 2008). According to the current World Bank data, the economic figures are presented down below:
Table-1: General Comparison of BRICS Countries Countries GDP (Nominal Million
$)
Per Capita National Income ($) Current Account Balance (%GDP) Brazil 2.252.664 11.339 -2,41 Russia 2.014.776 14.037 3,55 India 1.841.717 1.489 -4,2 China 8.538.363 6.188 2,31 S. Africa 384.312 7.507 -6,26
Çitçi, S. H. (2013). Kobi’lerin Finansmana Erişimi: Türkiye ve BRICS Ülkelerinin Karşılaştırmalı Analizi. Bildiriler
Kitabı.(Access to Finance for SMEs: A Comparative Analysis of Turkey and the BRICS countries. Proceedings Book)
In the BRICS summit done in July, many important decisions are made. BRICS Development Bank, which is intended to be a rival against the World Bank which the BRICS five have always been criticizing, is the main agenda item of the summit. The idea of BRICS countries establishing a development bank first entered the agenda in the summit in 2012 and approved by the leaders in the 5th BRICS Summit done in South Africa in 2013. BRICS leaders reached a definitive agreement on establishing a bank in this summit. Within the scope of the definitive agreement, $ 100 billion in foreign exchange reserves of the development bank, whose center would be located at China’s Shanghai city, will consist of the payments of BRICS
member countries. The countries will pay dues as the following: China 41 billion dollars, Russia, India, Brazil 18 billion dollars, Republic of South Africa 5 billion dollars. There are many technical analyses in the literature including “Growth Environment Score” (GES). The GES consists of 13 sub-indices that fall under one of five categories of economic growth determinants (Global Sherpa, 14.09.2014):
- Macroeconomic stability (inflation, government deficit and external debt ) - Macroeconomic conditions ( investment and openness)
- Technological capabilities (penetration of phones, PCs and internet) - Human capital (average years of secondary education and life expectancy) - Political conditions (political stability, rule of law and corruption)
Another important issue is an evaluation of some of the criteria which measures the life quality of BRICS countries. Some ratios such as the budget spent on health (refers to healthcare expenditure), life expectancy at birth, mortality rates from tuberculosis in developing countries should be closely monitored. Besides economic growth and the strengthening of financial markets, investments in health care and public health are also important criteria for development. In this regard, the efficiency evaluation of the health care expenses used in order to improve the community health with the sampling of BRIC countries is the main research subject of this study. With this purpose, the comparative performance of each country for the period between 2008 and 2012 has been analyzed by use of Data Envelopment Analysis (DEA) technique. Moreover, the effect of the loss at the health care expenses has been analyzed within this study.
2. Health Care System and Distribution of the Health Care Expenses in the BRICS Countries.
As a result of the recent economic growth in the BRICS countries, millions of people have got over poverty. In 1990, the World Bank classified China and India as low-income, but in 2011 China became an upper-middle-income and India became lower-middle-income countries (Dennis and Tang, 2014). This development has brought about the increase of demands for health care and increase of expectations for health care sector. In literature, it can be accepted that the reasons that cause the increase at the health care expenses are rise of income per capita, the change at social values, urbanization, and rise at the education level, increase at the life expectancy, technological developments, and proliferation of democratic order. All of the related factors are present in the BRICS countries. In all these countries, it is agreed that health is an essential part of the social and economic development (Da Silva, et. al., 2014).
The communicable and non-communicable diseases, inequalities at access to the health care services, rising health care expenses, rise at out-of-pocket and private health care expenses and grand private health sector are the common challenges of the BRICS countries in the field of health. In all the countries, since 1990s there have been some health initiatives launched at different times. Through the reforms started about two decades ago in Brazil and Russia, about one decade ago in China and India and recently began in South Africa, it has been aimed to reach more equitable, accessible and high-quality health care services and to establish a durable financial structure in health care system and to achieve the universal health level (Rao et al., 2014, 429).
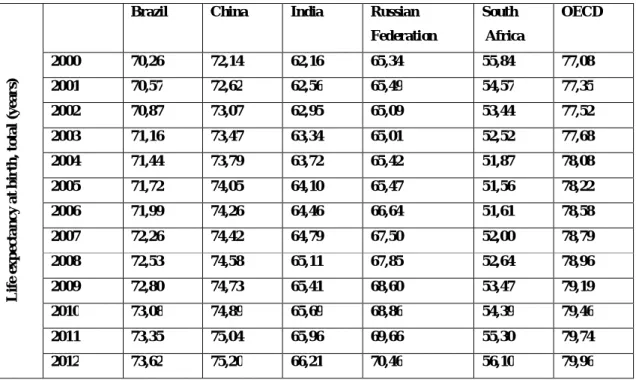
While assessing the health conditions of the countries, it is seen that various mortality and morbidity rates are examined and several economic values related to the sector are included to the analyses. The data about maternal health, infant, and child mortality and communicable diseases are indicated as the 4,5 and 6. targets among the millennium development goals. It is accepted that the life expectancy at birth reveals the general situation of a country. For this reason, life expectancy at birth is used at the calculation of health index within humanitarian development index. In simple terms, long life expectancy in a country is related to having good health conditions in this country.
Table 2: Life expectancy at birth, total (years)
L if e ex p ec ta n c y a t b ir th , to ta l (y e a r s)
Brazil China India Russian Federation South Africa OECD 2000 70,26 72,14 62,16 65,34 55,84 77,08 2001 70,57 72,62 62,56 65,49 54,57 77,35 2002 70,87 73,07 62,95 65,09 53,44 77,52 2003 71,16 73,47 63,34 65,01 52,52 77,68 2004 71,44 73,79 63,72 65,42 51,87 78,08 2005 71,72 74,05 64,10 65,47 51,56 78,22 2006 71,99 74,26 64,46 66,64 51,61 78,58 2007 72,26 74,42 64,79 67,50 52,00 78,79 2008 72,53 74,58 65,11 67,85 52,64 78,96 2009 72,80 74,73 65,41 68,60 53,47 79,19 2010 73,08 74,89 65,69 68,86 54,39 79,46 2011 73,35 75,04 65,96 69,66 55,30 79,74 2012 73,62 75,20 66,21 70,46 56,10 79,96
Source: World Bank Data (Access Date: 22.09.2014)
As clearly seen on the Table-2, there is a significant rise at the life expectancy at birth in all of the BRICS countries except South Africa between 2000 and 2012. While there is not a considerable rise in South Africa, the highest rise at the life expectancy at birth is in Russia with a rise of more than 5 years. However, the rate in the BRICS countries is still far below the OECD average.
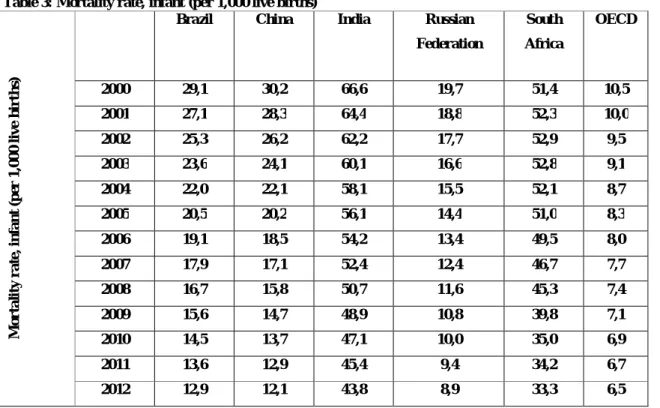
The mortality rate at infants and child under 5 years old, a generally accepted method of evaluating the health condition of a society, is used as one of the fundamental indicators for national health condition as it provides a general information about the health care services and mother-child health care services. This indicator is usually applied especially for the aim of comparing international health levels. Infant mortality death rate is calculated by the proportion of number of babies dying during their first year within a calendar year to the number of babies born alive within this year. In other terms, this shows how many babies die during their first year out of each 1000 live born babies. Height of infant mortality implies that especially productive health care services and education are not at adequate level and that countries have some unfavorable socio-economic indicators such as economic situation, income distribution, nourishment, lodging conditions, environmental pollution, noise, sanitation (Çelik, 2011).
Table 3: Mortality rate, infant (per 1,000 live births) M o r ta li ty r a te , in fa n t (p er 1 ,0 0 0 l iv e b ir th s)
Brazil China India Russian Federation South Africa OECD 2000 29,1 30,2 66,6 19,7 51,4 10,5 2001 27,1 28,3 64,4 18,8 52,3 10,0 2002 25,3 26,2 62,2 17,7 52,9 9,5 2003 23,6 24,1 60,1 16,6 52,8 9,1 2004 22,0 22,1 58,1 15,5 52,1 8,7 2005 20,5 20,2 56,1 14,4 51,0 8,3 2006 19,1 18,5 54,2 13,4 49,5 8,0 2007 17,9 17,1 52,4 12,4 46,7 7,7 2008 16,7 15,8 50,7 11,6 45,3 7,4 2009 15,6 14,7 48,9 10,8 39,8 7,1 2010 14,5 13,7 47,1 10,0 35,0 6,9 2011 13,6 12,9 45,4 9,4 34,2 6,7 2012 12,9 12,1 43,8 8,9 33,3 6,5
Source: World Bank Data (Access Date: 22.09.2014)
Considering the infant mortality rate indicated in Table-3 and the mortality rate of children under the age of five indicated in Table-4, it is seen that there has been a remarkable decrease in the BRICS countries. However, no BRICS countries have achieved yet the OECD average. Among the BRICS countries, both infant mortality rate and child death rate of especially India and South Africa are quite higher than the group average. It is believed that there is an urgent need for protective health services for individuals and environment in these countries.
Table 4: Mortality rate, under-5 (per 1,000 live births)
M o r ta li ty r a te , u n d e r-5 ( p er 1 ,0 0 0 l iv e b ir th s)
Brazil China India Russian Federation South Africa OECD 2000 33,1 36,9 91,5 23,2 73,9 12,6 2001 30,8 34,3 88,1 22,0 76,7 12,0 2002 28,7 31,6 84,7 20,7 79,1 11,4 2003 26,6 28,9 81,3 19,4 80,3 10,8 2004 24,8 26,3 78,2 18,0 80,3 10,3 2005 23,1 23,9 75,1 16,7 79,1 9,8 2006 21,5 21,8 72,1 15,6 76,5 9,4 2007 20,0 20,0 69,3 14,5 72,5 9,0 2008 18,6 18,4 66,5 13,4 69,0 8,7 2009 17,4 17,1 63,8 12,5 63,1 8,4 2010 16,3 16,0 61,2 11,7 52,9 8,1 2011 15,3 14,9 58,6 10,9 47,2 7,9 2012 14,4 14,0 56,3 10,3 44,6 7,6
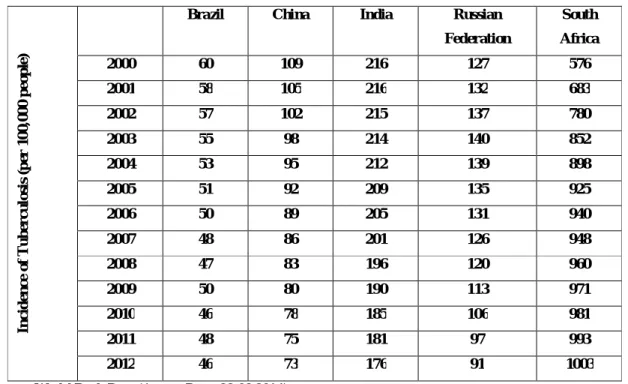
The measures applied to determine the disease (morbidity) level (frequency of the diseases in a region, its types, its distribution according the individual, place and time) are used for the planning of the health service, its organization, the re-regulation of the service, evaluating the efficiency of the taken measures and service. It is seen that India because of tuberculosis and South Africa because of tuberculosis and HIV/AIDS (this country has the highest population who carry HIV/AIDS virus.) have very high communicable diseases rate.
When tuberculosis is not treated, an active vector has the risk of infecting about 10-15 people per year. More than 90% of the patients all around the world are from developing countries and 75% of these patients are from active population at the age between 15-54. As adult tuberculosis patient has workforce loss for 5-6 months and 2 million people die of that disease, this is a crucial matter for the countries. (Saatçi and Ecevit 2007, 217)
Table 5: Incidence of Tuberculosis (per 100,000 people)
In c id e n ce o f T u b e rc u lo si s (p er 1 0 0 ,0 0 0 p e o p le )
Brazil China India Russian Federation South Africa 2000 60 109 216 127 576 2001 58 105 216 132 683 2002 57 102 215 137 780 2003 55 98 214 140 852 2004 53 95 212 139 898 2005 51 92 209 135 925 2006 50 89 205 131 940 2007 48 86 201 126 948 2008 47 83 196 120 960 2009 50 80 190 113 971 2010 46 78 185 106 981 2011 48 75 181 97 993 2012 46 73 176 91 1003
Source: World Bank Data (Access Date: 22.09.2014)
While classifying the health care systems of countries, generally production of the service, its supply and financing are put into consideration. During the said processes, the role of the public or private sector is effective at establishing the health care systems. As a result of his studies that he carried out between 1991 and 1993, Milton I.Roemer categorized the health care systems into 4 categories according to intervention degree of the state into the health care market.
a) Free market type health care system: At this kind of health care systems, the supply of the service is executed mainly by the private sector. Although states support some groups about the financing of the health care service, individuals are obliged mainly to pay out of their pocket or to depend on their private health insurance for the service that they receive. The best example for this type of health care system is the one in the USA. The health care system of Brazil and China can be considered also as free market type health care system. It will not be wrong to regard India’s health care system as this type of system because of very high health care expenses paid by the patients.
b) Welfare oriented health care system: This system is a social security one based on premium payments. In this system type, it is essential to have the individuals in the scope of obligatory disease insurance by means of premium payments. At the supply of these health care services in which public and private sector are unified, the individuals taking health care service have to pay their premium out of their pocket either directly or in the name of patient share. This system also known as Bischmark Model. Germany is the best example of this system. It can be evaluated that Russia is using welfare oriented health care system as they apply pre-payment mechanism in their system.
c) Covering type health care system: In this system, the production of all health service and their supply are provided by state for free for all the population of the country. The system includes a strong public authority, so the private sector plays a small role. The general taxes are the main financing sources of the sector. Britain is the best example of this system. It can be considered that South Africa apply this system also because of grand public sector financed by the taxes.
d) Socialist health care system: The supply of the health care service is executed by monopoly in this system. For any health service, individuals do not have to make any payment by a direct or demi-direct way. There is no role for private sector in this system (Cuba, Former Soviet Union).
3. Data and Methods
In order to analyze comparative performance of emerging countries, the research employs a cross-sectional time series benchmarking analysis to examine the data collected for BRICS countries for the period 2008-2012. The required data set for the selected countries were obtained from the World Bank datasets. DEA is a linear programming technique which creates an efficiency frontier and measures how efficiently a decision making unit (DMU), in this article an emerging countries. Basically, DEA provides a categorical classification of the units into efficient and inefficient ones (Despotis, 2005).
DEA aims to find DMUs that produce the highest levels of outputs by using the lowest levels of inputs. Therefore, it maximizes the ratio of weighted outputs to weighted inputs for the DMU under consideration. This maximization objective is subject to the constraint that the same ratio for all DMUs be less than or equal to one. This leads to the following model, in which one can find the efficiency value for DMU m (Ramanathan, 2005):
I i mi mi J j mj mj x u y v Max 1 1 v u i I j J N n x u y v mi mj I i ni mi J j nj mj ,..., 2 , 1 ; ,..., 2 , 1 ; 0 , ,..., 2 , 1 ; 1 0 1 1
Here, i is the index for inputs, j is the index for outputs, and n is the index for DMUs. The variables vmj and umi are the weights representing the importance of each input and output. If the efficiency score is
equal to 1, the DMU m is located on the efficiency frontier. Here, the efficiency value is a relative measure indicating how DMU m operates compared to the other DMUs that are included in the sample (Gok and Altindag, 2014).
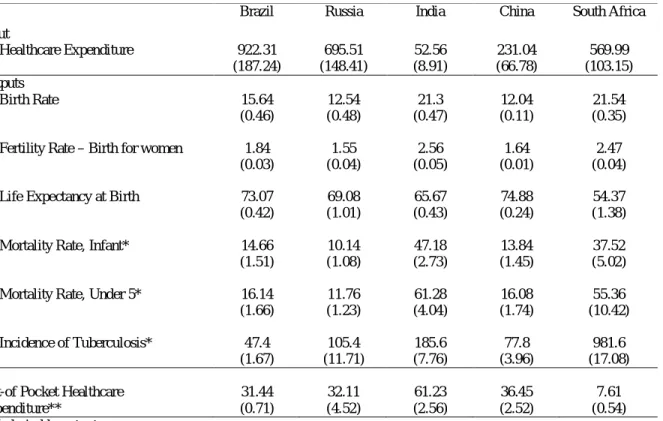
In the DEA model, there are two assumptions: (1) input oriented (while outputs are hold constant and inputs are decreased), (2) output oriented (while inputs are hold constant and outputs are increased). Since, healthcare expenditure is the main evaluation criteria of this study, an input oriented model has been considered appropriate in the present paper. Detailed discussion of DEA models could also be found in the studies of Cooper et al. (2007). Descriptive statistics regarding the input, output and control variables used in our analysis are presented in Table 6.
Table 6. Descriptive Statistics of Countries (2008-2012)
Input
Brazil Russia India China South Africa
Healthcare Expenditure 922.31 (187.24) 695.51 (148.41) 52.56 (8.91) 231.04 (66.78) 569.99 (103.15) Outputs Birth Rate 15.64 (0.46) 12.54 (0.48) 21.3 (0.47) 12.04 (0.11) 21.54 (0.35)
Fertility Rate – Birth for women 1.84 (0.03) 1.55 (0.04) 2.56 (0.05) 1.64 (0.01) 2.47 (0.04)
Life Expectancy at Birth 73.07 (0.42) 69.08 (1.01) 65.67 (0.43) 74.88 (0.24) 54.37 (1.38)
Mortality Rate, Infant* 14.66 (1.51) 10.14 (1.08) 47.18 (2.73) 13.84 (1.45) 37.52 (5.02)
Mortality Rate, Under 5* 16.14 (1.66) 11.76 (1.23) 61.28 (4.04) 16.08 (1.74) 55.36 (10.42) Incidence of Tuberculosis* 47.4 (1.67) 105.4 (11.71) 185.6 (7.76) 77.8 (3.96) 981.6 (17.08)
Out-of Pocket Healthcare Expenditure** 31.44 (0.71) 32.11 (4.52) 61.23 (2.56) 36.45 (2.52) 7.61 (0.54) * Undesirable outputs
** % of total expenditure on health
4. Analysis and Results
In this study where the efficiency of the health care expenses is assessed for the purpose of improvement of the community health, the analysis frame is created with two phrases. In the first phrase, the efficiency of the health care expenses in BRICS countries (Brazil, India, Russia, China and South Africa) is analyzed and comparative performance score is obtained for each country by use of data envelopment analysis. In this phrase, the health care expense stands for input criteria. At the assessment about the improvement of community health with the health care expenses, the following criteria constitute the outputs:
Birth Rate
Fertility Rate – Birth for women Life Expectancy at Birth
Mortality Rate, Infant
Mortality Rate, under 5 years Incidence of Tuberculosis
The rise of the first three criteria defined as above is favorable for the improvement of the community health. Therefore these criteria constitute the variables expected to rise. However, criteria of mortality rate and incidence of tuberculosis are the output variables expected to decrease. Therefore, these criteria are referred as undesirable outputs at achieving the comparative performance score in the analysis phrase. As proposed by Pasupathy in his study in 2002, undesirable outputs are added to the data envelopment analysis by using 1/Q formula (Q: undesirable output). To be more precise, for instance in Brazil, 46 individuals out of every one hundred thousand people suffered from tuberculosis in 2012. This value has been included into the analysis as an output variable and referred as 1/46 (0.021).
In the first phrase, the comparative performance scores of the BRICS countries reveal an interesting fact. As seen in Table-7, while India receives the maximum score every year without any decrease at its efficiency, it is only China among the rest of the countries who achieved the maximum score in 2008. Along with that, it is seen that China and India exhibit a performance at the high level or close the high level every year. On the other hand, it is seen that Russia, Brazil and South Africa have a quite low performance during all the years. Although Russia is above limit at the rate of 40% in some years, this situation does not change the fact that the general average is low.
Another output obtained in the first phrase from the analysis results is that the performance scores of all the countries have in general a certain standard tendency. Although China showed a change from maximum performance score - 100% in 2008 to 77% in 2012, the change in the other countries is at much more minimal levels. For instance, South Africa who has low performance score has the values between 11% and 13%, Brazil has values between 21% and 25%. Similarly, Russia has performance score values between 35% and 43%. This situation shows that the countries have a certain standard for efficient usage (or non-efficient usage) of the health care expenses between these years.
Table.7 Comparative Performance Score of BRICS Countries
2008 2009 2010 2011 2012 Brazil 0.25 0.23 0.21 0.21 0.23 Russia 0.35 0.43 0.40 0.41 0.39 India 1.00 1.00 1.00 1.00 1.00 China 1.00 0.87 0.92 0.89 0.77 South Africa 0.11 0.11 0.11 0.12 0.13
Additionally, Kruskall-Wallis difference test proposed by Chang et.al.(2004) has been applied in order to analyze whether the performance scores of BRICS countries in each year are statistically different from each other or not; in other words, whether the above mentioned amounts are unique to each country or not. The null hypothesis being tested is that there are no differences in terms of comparative performance scores between the years for each country. The null hypothesis of equal means is rejected at the 0.001 level of statistical significance in each of the five sample years of study for all countries. According to the analyses, we found that the differences in comparative performances of BRICS countries are statistically significant.
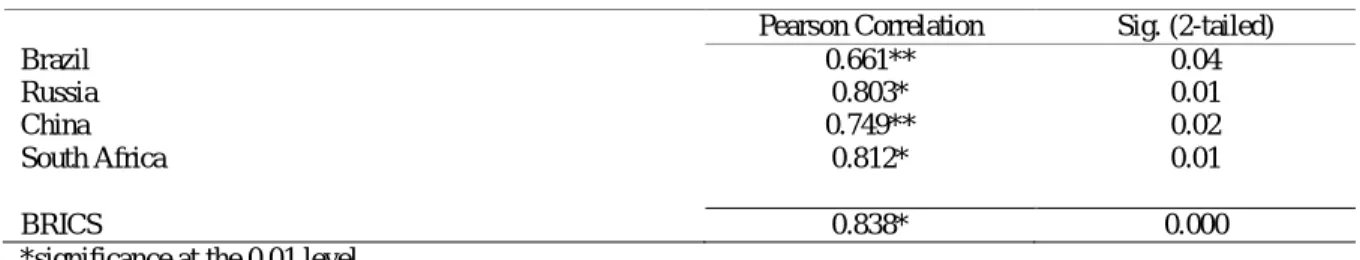
In the second phase of the study, the effect of the loss at out-of pocket healthcare expenses on the comparative performance scores of the BRICS countries. In this sense, the relation between the loss at healthcare expenses and the performance score achieved in this study were tested by use of Pearson Korelasyon analysis. As the loss data was referred as the damaging percentage in this study, adverse relation expectation was removed by using “1” (loss) data and the linear relationship hypothesis was established. The main reason for analyzing the relation is to look for an answer to the question that low or high performance was achieved depending on improvement of the community health or by minimizing the loss with the policies on the health care expenses. In other words, it is the question of the second analysis: “Although maximum score has been achieved in India during all the years but in contrast South Africa has been in quite low performance level, so how much related is the management policy of the health care expenses to that situation?”
Table 8. Correlation Analysis
Pearson Correlation Sig. (2-tailed)
Brazil 0.661** 0.04
Russia 0.803* 0.01
China 0.749** 0.02
South Africa 0.812* 0.01
BRICS 0.838* 0.000
*significance at the 0.01 level ** significance at the 0.05 level
As seen in the Table-8, when it is examined either each country of BRICS one by one or examined all countries all together, there is a statistically important relation between comparative performance score and loss at health care expenses. Although India is not included in the analysis process as it received maximum score during all the years, it takes part in the BRICS data composed of pool data. The results of the correlation analysis state clearly that the loss at the health care expenses has an effect on the community health depending on the performance score in all the developing countries.
.
5. Discussion and Future Suggestions
Two outputs clearly indicated by the analysis results come into prominence in this study. However, what is more important is that with a more comprehensive point of view it can be claimed that the analysis results may be deceptive to a certain extent about reflecting the grand image. It can be more beneficial to reveal the grand image after understanding the obtained outputs from the analysis results.
Firstly it is India and China among the BRICS countries that use the health care expenses more efficiently to improve the community health. However, Brazil, Russia and especially South Africa are far behind this level. More importantly, all countries maintained consistently their positive or negative tendencies between 2008 and 2012.taking into consideration these results, it is understood that policy makers and decision makers of the health system from the countries who have stable negative tendency should pay attention to these outputs and plan the improvement-reform activities.
The second output determined during the study is that there is a significant relation between the loss at health care expenses and the comparative performance scores depending on the efficient usage of the health care expenses. Therefore it is understood that the less will be the loss at health care expenses, the more contribution will be done to the improvement of the community health. Taking into consideration that the main reason of health care expenses is to improve the community health, it is concluded that the main reason is not to increase the health budget but to have an efficient use by minimizing the loss at the budget.
The results explained up to that point are both consistent and valid outputs supported by the analysis frame. But when a more detailed research is carried out, it will be seen that some part of the puzzle have not examined yet. Let’s try to explain this situation through Indian example. India received maximum performance score every year. So it can be referred that India can manage its health care expenses in a effective manner and also use them in a effective manner for the sake of improving the community health. However, when Table-6 is examined, it is seen that the loss at the health care expenses in India is 61% with a 2% standard deviation. Moreover, India is the country who has the highest mortality rates (as an undesirable output) and the second highest tuberculosis cases amount after South Africa. Depending on these data, it can be inferred that the health care expenses in India are not managed efficiently and the health care expenses do not contribute to the improvement of the community health.
Therefore we see that the results of the first and second phrase analysis and the comments which depend on the data of Table-6 are completely different. Here we understand the importance of looking from
a broader perspective to the image and seeing the whole of the puzzle. While the health expense in India which has 61% loss rate were at the value of 52.56 million dollars at the average of analysis years, this value increased to 922.31 million dollars in Brazil, to 695.51 million dollars in Russia, to 569.99 million dollars in South Africa and to 231.04 million dollar in China. An important fact here is that although India has health expense loss at 61%, this rate corresponds to a loss of about 32 millions dollars. When we do a similar comparison for Brazil, we have a loss of about 290 millions dollars. Russia and China also have proportionately similar amounts. But South Africa carries a different character from the other three countries. Although its health care expenses loss is much less than all the other countries (7.61%), it has the lowest performance score. The main reason of that is its negative situation at the variables defined as undesirable outputs and used for the efficiency of the community health. At the South Africa example, it is concluded that the health budget is managed effectively but this situation does not have any positive effect on the community health at least during the analysis years.
In this sense, it is clearly seen that increasing the budget for health care expenses cause important risks. It can be thought that increasing the health care expenses is an acceptable way to improve the community health and increase the welfare level. However, we understand from this study that efficient management of the health care expenses is much more important than increasing the budget. Otherwise, increasing the budget will cause growing of the current loss and waste of the limited resources which may be used for the improvement of the community health. It will be quite beneficial for the policy makers and decision makers of the health system pay a great attention to these outputs for sustainable improvement programs and efficient health reforms.
In this sense, it is clearly seen that increasing the budget for health care expenses cause important risks. It can be thought that increasing the health care expenses is an acceptable way to improve the community health and increase the welfare level. However, we understand from this study that efficient management of the health care expenses is much more important than increasing the budget. Otherwise, increasing the budget will cause growing of the current loss and waste of the limited resources which may be used for the improvement of the community health. It will be quite beneficial for the policy makers and decision makers of the health system pay a great attention to these outputs for sustainable improvement programs and efficient health reforms.
References
1. Chang, H., Cheng, M.A., Das, S. (2004).: Hospital ownership and operating efficiency: Evidence from Taiwan. Eur J Oper Res 159(2), 513-527, DOI: 10.1016/S0377-2217(03)00412-0
2. Cooper, W. W., Seiford, L. M. and Tone K. (2007). Data Envelopment Analysis a Comprehensive Text with Models, Applications, References and DEA-Solver Software. New York: Springer. 3. Çelik, Y. (2011) Sağlık Ekonomisi, Siyasal Kitabevi Ankara
4. Çitçi, S. H. (2013). Kobi’lerin Finansmana Erişimi: Türkiye Ve Brıcs Ülkelerinin Karşılaştırmalı Analizi. Bildiriler Kitabı. (Access to Finance for SMEs: A Comparative Analysis of Turkey and the BRICS countries. Proceedings Book)
5. Da Silva, J. B., Junior, K. D., Matsoso, P., Minghui, R. and Salagay, O., “BRICS Cooperation in Strategic Health Projects”, Bull World Health Organ 2014, 92:388. Doi: 10.2471/BLT.14.141051 6. Dennis P. and Kam K.T., (2014). “Relative Health Performance in BRICS Over the Past 20 Years:
The Winners and Losers”, Bull World Health Organ.,92:396-404. Doi: http://dx.doi.org/10.2471/BLT.13.132480
7. Despotis, D. K. (2005). Measuring human development via data envelopment analysis: the case of Asia and the Pacific. Omega, 33(5), 385-390.
8. Erkan, B. (2012). BRIC Ülkeleri ve Türkiye’nin İhracat Uzmanlaşma ve Rekabet Düzeylerinin Karşılaştırmalı Analizi. AİBÜ-İİBF Ekonomik ve Sosyal Araştırmalar Dergisi.
9. Frank, W. P., and Frank, E. C. (2010). International Business Challenge: Can the BRIC Countries Take World Economic Leadership Away From the Traditional Leadership in The Near
Future. International Journal of Arts and Sciences,3(13), 46-54. ISSN: 1944-6934 10. Gömleksiz, M., and Alagöz, M. (2012). İktisadi Büyüme Olgusuna Ekonometrik Bir
Yaklaşım:“Brımch” Ülkeleri Ve Türkiye Örneği. s.4
11. Gök, M. Ş. And Altındağ, E. (2014). Analysis of the cost and efficiency relationship: Experience in the Turkish pay for performance system. The European Journal of Health Economics, DOI:
10.1007/s10198-014-0584-6
12. Mustafa Saatçi and Eyyüp Ecevit, “Tüberküloz Hastalığının Ekonomik Yükü: Nuh-Naci Yazgan Göğüs Hastalıkları Hastanesinde Bir Uygulama”, E.Ü. Sosyal Bilimler Enstitüsü Dergisi, Sayı 22, 217-229, 2007.
13. Nayyar, Deepak (2008) : China, India, Brazil and South Africa in the world economy: Engines of growth?, WIDER Discussion Papers, World Institute for Development Economics (UNU-WIDER), No. 2008/05, ISBN 978-92-9230-110-1
14. O'Neill, J. (2011). The Growth Map: Economic opportunity in the BRICs and beyond. Penguin. 15. Pasupathy, K.S., (2002) “Modeling Undesirable Outputs in Data Envelopment Analysis: Various
Approaches”, MS Thesis in Virginia Polytechnic Institute and State University
16. Paulo Eduardo M.Elias and Amelia Cohn, “Health Reform in Brazil: Lessons to Consider”, American Journal of Public Health, January 2003, Vol 93, No:1. Doi: 10.2105/AJPH.93.1.44 17. Ramanathan R. (2005). Operations assessment of hospitals in the Sultanate of Oman. International
Journal of Operation & Production Management, 25, 39-54.
18. Rao, K. D., Petrosyan, V., Araujoc, E. C. and McIntyred, D. “Progress Towards Universal Health Coverage in BRICS: Translating Economic Growth into Better Health”, Bull World Health Organ 2014, 92:429-435. Doi: http://dx.doi.org/10.2471/BLT.13.127951
19. Internet References
21. http://www.imf.org/external/pubs/ft/weo/2013/01/ "World Economic Outlook". IMF. April 2013 data. Access Date: 23.09.2014
22. http://news.yahoo.com/brics-launch-bank-tighten-latin-america-ties-034909760.html yahoo.com: "BRICS to launch bank, tighten Latin America ties" 11 Jul 2014, Access Date: 14.09.2014
23. http://www.csmonitor.com/World/Global-Issues/2011/1018/Amid-BRICS-rise-and-Arab-Spring-a-new-global-order-forms "Amid BRICS' rise and 'Arab Spring', a new global order forms". Christian Science Monitor. 18 October 2011. Access Date: 20.09.2014