ORIGINAL CONTRIBUTIONS
Effect of the
“Recruitment” Maneuver on Respiratory Mechanics
in Laparoscopic Sleeve Gastrectomy Surgery
Ismail Sümer1&Ufuk Topuz2,3&Selçuk Alver4&Tarik Umutoglu3&Mefkur Bakan2,3&Seniyye Ülgen Zengin5&
Halil Coşkun6&Ziya Salihoglu7
# Springer Science+Business Media, LLC, part of Springer Nature 2020 Abstract
Purpose LSG surgery is used for surgical treatment of morbid obesity. Obesity, anesthesia, and pneumoperitoneum cause reduced pulmoner functions and a tendency for atelectasis. The alveolar“recruitment” maneuver (RM) keeps airway pressure high, opening alveoli, and increasing arterial oxygenation. The aim of our study is to research the effect on respiratory mechanics and arterial blood gases of performing the RM in LSG surgery.
Materials and Methods Sixty patients undergoing LSG surgery were divided into two groups (n = 30) Patients in group R had the RM performed 5 min after desufflation with 100% oxygen, 40 cmH2O pressure for 40 s. Group C had standard mechanical
ventilation. Assessments of respiratory mechanics and arterial blood gases were made in the 10th min after induction (T1), 10th min after insufflation (T2), 5th min after desufflation (T3), and 15th min after desufflation (T4). Arterial blood gases were assessed in the 30th min (T5) in the postoperative recovery unit.
Results In group R, values at T5, PaO2were significantly high, while PaCO2were significantly low compared with group C.
Compliance in both groups reduced with pneumoperitoneum. At T4, the compliance in the recruitment group was higher. In both groups, there was an increase in PIP with pneumoperitoneum and after desufflation this was identified to reduce to levels before pneumoperitoneum.
Conclusion Adding the RM to PEEP administration for morbidly obese patients undergoing LSG surgery is considered to be effective in improving respiratory mechanics and arterial blood gas values and can be used safely.
Keywords Laparoscopic sleeve gastrectomy . Recruitment maneuver . PEEP
Purpose
Obesity is defined as abnormal and excessive fat accumulation at levels to disrupt health [1]. Lifestyle changes like diet and exercise and medical treatment, in addition to surgical inter-ventions, are frequently used for treatment of obesity [2]. Laparoscopic sleeve gastrectomy (LSG) is a new approach for surgical treatment of morbid obesity [3]. With the increase in surgical interventions for obesity treatment, it is necessary to take more care for anesthesia management of these patients [4]. Obese patients have increased possibility of difficult intu-bation, in addition to displaying more unwanted effects on the respiratory system, compared with normal patients [5,6]. Obesity is an important respiratory risk factor as it causes reduced functional residual capacity, compliance and oxygen-ation in terms of respiratory functions before and after both surgery and anesthesia, in addition to causing a tendency for atelectasis [7,8]. Reduced functional residual capacity causes * Ismail Sümer
1
Department of Anesthesiology and Reanimation, Faculty of Medicine, Bezmialem Vakif University, Istanbul, Turkey
2 Health Cares Vocational School,İstanbul Esenyurt University,
Istanbul, Turkey
3 İstanbul Acıbadem Taksim Hospital, Istanbul, Turkey 4 Department of Anesthesiology and Reanimation, Faculty of
Medicine,İstanbul Medipol University, Istanbul, Turkey
5
Department of Anesthesiology and Reanimation, Faculty of Medicine, Marmara University, Istanbul, Turkey
6
Department of General Surgery, Faculty of Medicine, Bezmialem Vakif University, Istanbul, Turkey
7 Department of Anesthesiology and Reanimation, Cerrahpasa Faculty
of Medicine,İstanbul University Cerrahpasa, Istanbul, Turkey Published online: 23March 2020
airway closure in situations with delayed endotracheal intuba-tion and obese patients in the supine posiintuba-tion become rapidly desaturated. Additionally, dyspnea, exercise intolerance, and obstructive sleep apnea should be carefully questioned [9].
Intraperitoneal administration of carbon dioxide (CO2) gas
for laparoscopic surgeries frequently increases intraabdominal pressure, pushing the diaphragm upwards and causing com-pression of the lungs. The lungs which are already susceptible to atelectasis due to general anesthesia experience increased severity of this effect during laparoscopy [10]. The ameliora-tion of atelectasis developing during general anesthesia for obese patients is slower after the operation compared with nonobese patients. Atelectasis is fully resorbed 24 h after the end of the surgical procedure for nonobese patients, while atelectasis was shown to continue in obese patients at this point [11]. One of the most important aims of anesthesia man-agement during operations on obese patients is to keep the airway and alveoli open during respiration [12]. The tech-niques of keeping airway pressure high for a duration to open atelectatic areas with the“recruitment maneuver” (RM) and positive expiration end pressure (PEEP) may reduce atelecta-sis and increase oxygenation [13].
The primary aim of this study is to investigate the effect of RM on postoperative arterial oxygenation after LSG in obese patients. Our secondary aim was to investigate the effects of RV on perioperative respiratory mechanics.
Materials and Methods
This study received ethics committee permission from Bezmialem Vakıf University Faculty of Medicine dated 21.05.2014 numbered 71306642/050-01-04/127. The study included patients aged 18–65 years, American Society of Anesthesiologists (ASA) III, Body Mass Index (BMI) 40–55 undergoing elective LSG surgery after informing them about the effects of RM performed after desufflation. Written in-formed consent was obtained from all individual participants included in the study.
Patients with emergency operation planned, with situations representing contraindications to performing the RM (e.g., bullous lung disease, hemodynamic instability), with respira-tory and heart diseases, and using medications that affect re-spiratory functions like salbutamol, budesonide, and formoterol were excluded from the study.
After routine preoperative preparation, patients with oral intake limited for a sufficient duration had a cannula inserted in the vein on the back of the hand in the preparation room before the procedure. Premedication was not administered. Patients were monitored in the operating room with a three-channel electrocardiogram (ECG), peripheral oxygen satura-tion (SpO2), noninvasive blood pressure (NIBP), to estimate
the depth of sedation bispectral index (BIS) (E-BIS-00, GE
Healthcare, Finland), which one uses Fourier transform anal-ysis of electroencephalographic data. Neuromuscular block-ade was monitored from the adductor pollicis muscle inner-vated by the ulnar nerve with E-NMT-00 (GE Healthcare, Finland) device. Hemodynamic parameters of patients (sys-tolic, diastolic and mean arterial pressure, heart rate), BIS, SpO2, and TOF values were recorded perioperatively with
5 min interval.
Corrected weight calculations were performed for all patients; medications and ventilatory settings were adjust-ed according to this calculation. For anesthesia induction, propofol 2 mg kg−1 and rocuronium 0.6 mg kg−1 were administered and infusions of propofol 10 mg kg−1 hr−1 and remifentanil 0.25μg kg−1min−1were started. All pa-tients had orotracheal intubation and mechanical ventila-tion with tidal volume of 6 mL kg−1, PEEP of 8 cmH2O,
inspired oxygen (FiO2) 40%, fresh gas flow of 4 L min−1
and the ventilatory frequency was adjusted to keep end-tidal carbon dioxide (EtCO2) level between 30 and
35 mmHg. For anesthesia maintenance, propofol infusion was adjusted to keep BIS values between 40 and 60 and remifentanil infusion was adjusted to keep hemodynamic parameters ± 20 of initial values. Rocuronium was added to keep train-of-four (TOF) response zero.
D ur i ng t h e o p e r at i o n , a l l pa t i e n t s r e c e i v e d 5– 8 mL kg−1hr−1balanced electrolyte solution (isolyte-S) infu-sion. After Allen test was performed, radial artery was cannu-lated, and arterial pressure was monitorized. Arterial blood gases (pH, pO2, pCO2, HCO3, lactate) were analyzed with
RAPIDLab 1200 Systems (Siemens Healthcare GmbH, Federal Republic of Germany). From the start of mechanical ventilation, respiratory mechanics of compliance, peak inspi-ration pressure (PIP), plateau airway pressure (Pplateau), and airway resistance (Raw) were monitored with a spirometry device (E-COVX–Spirometry–00, GE Healthcare, Finland).
Patients who met the inclusion criteria were divided into two groups; one who received RM (group R,n = 30) and the control group (group C,n = 30) without RM in a 1:1 random-ized closed envelope manner (reviewer no. 1). Recruitment maneuver applied under 100% oxygen, with 40 cmH2O
air-way pressure for 40 s duration. Patients in group R received RM one time, 5 min after desufflation of the pneumoperito-neum, after RM FiO2was adjusted to 40% again. If
hemody-namic instability and hypoxia developed, the RM was stopped. In both groups, arterial blood gas samples were ob-tained 10 min after induction (T1), 10 min after insufflation (T2), 5 min after desufflation (T3), and 15 min after desufflation (T4) while respiratory mechanic measurements (compliance, PIP, Pplateau, Raw) were recorded simulta-neously. Patients were not disconnected from the respiratory cycle until extubation. Additionally, 30 min after extubation (T5), blood gas assessment was performed in the recovery unit.
All patients received 2 mg kg−1sugammadex and were extubated under 40% FiO2when neuromuscular monitoring
TOF ratio was≥ 0.9. In the recovery unit, all patients received 5 L min−1 oxygen through a face mask. For postoperative analgesia, 100 mg tramadol was administered 10 min before the end of the operation and local anesthetic infiltration (bupivacaine 0.5%) was administered to the trocar entry points at the end of surgery.
Statistical Analysis
The data obtained were statistically analyzed. When analyzing findings obtained in the study, the IBM SPSS version 20 (IBM SPSS, Turkey) program was used for statistical analysis. A statistical power analysis was performed for sample size esti-mation, based on data from published study, Whalen et al. [14]. In the present study, effect size was estimated as 0.77, alpha was defined as 0.05, and power as 0.90, the projected sample size needed with this effect size (GPower 3.1) is ap-proximatelyN = 58. A total of 29 patients would be required in each group for this simplest between group comparisons. When assessing study data, fit of parameters to normal distri-bution was evaluated with the Shapiro-Wilk test. When assessing study data, descriptive statistical methods (mean, standard deviation, frequency) were used. For comparison of quantitative data with parameters showing normal distribu-tion, two groups were compared with the studentt test, while comparison of two groups without normal distribution used the Mann-Whitney U test. Analysis of more than two mea-surements obtained in a single group for values without nor-mal distribution used the Friedman test. Significance was assessed atp < 0.05 level. After the Friedman test, two-way comparisons of within-group measurements used the Wilcoxon signed ranks test to identify the difference. For blood gas measurements, significance for 5 measurements with a total of 10 two-way comparisons was evaluated at the p < 0.005 level and for respiratory mechanics, significance for 4 measurements with a total of 6 two-way comparisons was evaluated atp < 0.008 level.
Results
The study included 60 patients undergoing LSG surgery for morbid obesity from 01.06.2014 to 01.02.2015. The mean age of all patients included in the study was 38.25 ± 10.37 years. There were 30 patients each in group C and group R. The sex distribution was equal in the groups of patients included in the study. Patients did not develop any hemodynamic complica-tions. No patient required intensive care.
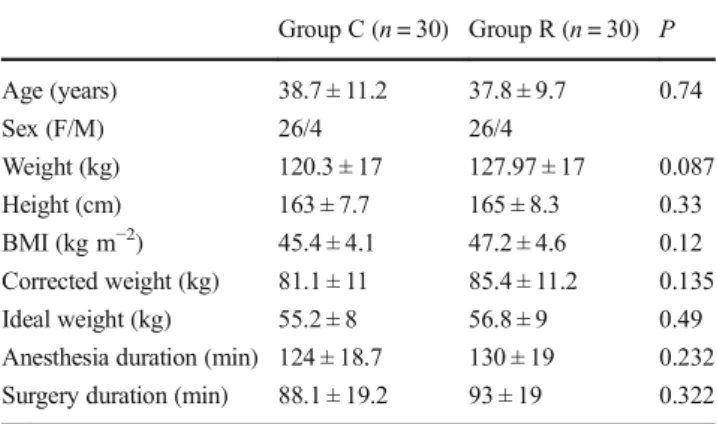
There were no statistically significant differences between the mean age, weight, height, BMI, calculated corrected
weight, anesthesia duration, and surgical duration between the groups (Table1).
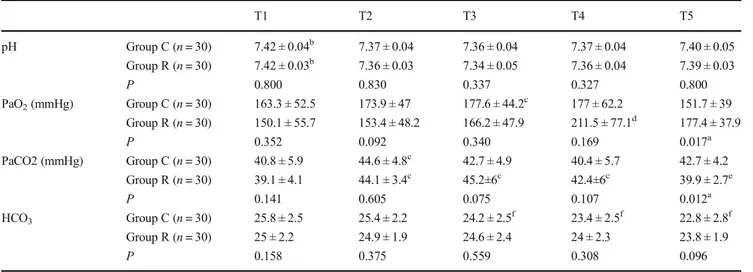
There was no statistically significant difference between the pH values in the control and recruitment groups at T1, T2, T3, T4, and T5 measurements. In both groups, the pH values measured at T1, T2, T3, T4, and T5 were statistically significantly different (p < 0.001 for both groups with the Friedman test). In both groups, blood gas pH values at T2, T3, T4, and T5 were statistically significantly low compared with the pH at T1 (p < 0.001 for all analyses with Wilcoxon signed ranks test) (Table2and Fig.1).
There was no statistically significant difference between the groups in terms of PaO2values at T1, T2, T3, and T4
(p = 0.352, p = 0.092, p = 0.34, p = 0.169, respectively). However, when the T5 value is examined, the PaO2value in
group R was statistically significantly high compared with the PaO2value in group C (p = 0.017, Mann-Whitney U test)
(Table2and Fig.1).
When both groups are compared within themselves, the PaO2values at T1, T2, T3, T4, and T5 were statistically
sig-nificantly different (p = 0.008 for group C, p < 0.001 for group R, Friedman test). The difference observed in group C was due to the T3 PaO2value being statistically significantly high
compared with the T1 PaO2 value (p = 0.004, Wilcoxon
signed ranks test). In group C, the T4 PaO2value was not
statistically significantly different from the T1, T2, and T3 PaO2values (p > 0.05, Wilcoxon signed ranks test). In group
R, the T4 PaO2value was statistically significantly high
com-pared with the T1, T2, and T3 values (p = 0.001, p < 0.001, p = 0.001, respectively), Wilcoxon signed ranks test (Table2
and Fig.1).
At T1, T2, T3, and T4 measurements, there was no statis-tically significant difference between the groups in terms of PaCO2values (p = 0.141, p = 0.605, p = 0.075, and p = 0.107,
respectively). However, when the T5 value is examined, the
Table 1 Demographic data, surgical duration, and anesthesia duration in the groups Group C (n = 30) Group R (n = 30) P Age (years) 38.7 ± 11.2 37.8 ± 9.7 0.74 Sex (F/M) 26/4 26/4 Weight (kg) 120.3 ± 17 127.97 ± 17 0.087 Height (cm) 163 ± 7.7 165 ± 8.3 0.33 BMI (kg m−2) 45.4 ± 4.1 47.2 ± 4.6 0.12 Corrected weight (kg) 81.1 ± 11 85.4 ± 11.2 0.135 Ideal weight (kg) 55.2 ± 8 56.8 ± 9 0.49 Anesthesia duration (min) 124 ± 18.7 130 ± 19 0.232 Surgery duration (min) 88.1 ± 19.2 93 ± 19 0.322 BMI, body mass index. Values given as mean ± standard deviation or patient numbers. Studentt test was used
PaCO2value in group R was statistically significantly low
compared with the PaCO2 value in group C (p = 0.012,
Mann-Whitney U test) (Table2and Fig.1).
The PaCO2values measured at T1, T2, T3, T4, and T5
were statistically significantly different within both groups (p < 0.001 for both groups, Friedman test). In group C, this Table 2 Analysis of pH, PaO2,PaCO2,and HCO3values in the groups
T1 T2 T3 T4 T5 pH Group C (n = 30) 7.42 ± 0.04b 7.37 ± 0.04 7.36 ± 0.04 7.37 ± 0.04 7.40 ± 0.05 Group R (n = 30) 7.42 ± 0.03b 7.36 ± 0.03 7.34 ± 0.05 7.36 ± 0.04 7.39 ± 0.03 P 0.800 0.830 0.337 0.327 0.800 PaO2(mmHg) Group C (n = 30) 163.3 ± 52.5 173.9 ± 47 177.6 ± 44.2c 177 ± 62.2 151.7 ± 39 Group R (n = 30) 150.1 ± 55.7 153.4 ± 48.2 166.2 ± 47.9 211.5 ± 77.1d 177.4 ± 37.9 P 0.352 0.092 0.340 0.169 0.017a PaCO2 (mmHg) Group C (n = 30) 40.8 ± 5.9 44.6 ± 4.8c 42.7 ± 4.9 40.4 ± 5.7 42.7 ± 4.2 Group R (n = 30) 39.1 ± 4.1 44.1 ± 3.4c 45.2±6c 42.4±6c 39.9 ± 2.7e P 0.141 0.605 0.075 0.107 0.012a HCO3 Group C (n = 30) 25.8 ± 2.5 25.4 ± 2.2 24.2 ± 2.5f 23.4 ± 2.5f 22.8 ± 2.8f Group R (n = 30) 25 ± 2.2 24.9 ± 1.9 24.6 ± 2.4 24 ± 2.3 23.8 ± 1.9 P 0.158 0.375 0.559 0.308 0.096
PaO2, arterial oxygen pressure;PaCO2, arterial carbon dioxide pressure;HCO3, bicarbonate value. Values give as mean ± standard deviation.
Comparisons between groups used Mann-Whitney U test; comparisons within groups used Wilcoxon signed ranks test
a
Comparison between groups is statistically significant
bWithin groups, comparisons with T2, T3, T4, and T5 are statistically significant cWithin groups, comparisons with T1 are statistically significant
d
Within groups, comparisons with T1, T2, and T3 are statistically significant
e
Within groups, comparisons with T2 and T3 are statistically significant
f
Within groups, comparisons with T1 and T2 are statistically significant
7,42 7,37 7,36 7,377,40 7,42 7,36 7,34 7,36 7,39 7,3 7,35 7,4 7,45 T1 T2 T3 T4 T5 pH C R 163,3 173,9 177,6 177,0 151,7 150,1 153,4 166,2 211,5 177,4 120,0 140,0 160,0 180,0 200,0 220,0 T1 T2 T3 T4 T5 PaO2(mmHg) C R 40,8 44,6 42,7 40,4 42,7 39,1 44,1 45,2 42,4 39,9 36,0 38,0 40,0 42,0 44,0 46,0 T1 T2 T3 T4 T5 PaCO2(mmHg) C R 25,8 25,4 24,2 23,4 22,8 25,0 24,9 24,6 24,0 23,8 21,0 22,0 23,0 24,0 25,0 26,0 27,0 T1 T2 T3 T4 T5 HCO3(mmol.L-1) C R 0,97 0,86 0,82 1,06 0,86 0,95 0 0,82 0,790,77 0,7 0,8 0,9 1 1,1 T1 T2 T3 T4 T5 Lactate (mmol.L-1) C R 98,2 98,8 99,6 99,6 99,1 97,8 98,0 99,1 99,4 99,0 96,0 97,0 98,0 99,0 100,0 T1 T2 T3 T4 T5 SpO2 C R
difference was due to the T2 PaCO2value being statistically
significantly high compared with the T1 PaCO2 value
(p < 0.001, Wilcoxon signed ranks test). In group R, the T2, T3, and T4 measurements were statistically significantly high compared with the T1 measurements (p < 0.001, p < 0.001, p = 0.003, respectively, Wilcoxon signed ranks test). Additionally, the T5 value was statistically significantly low compared with the T1 and T2 values (p < 0.001, p = 0.001, respectively, Wilcoxon signed ranks test) (Table2and Fig.1). There was no statistically significant difference between the HCO3values between the groups at T1, T2, T3, T4, and
T5 measurements (Mann-Whitney U test) (Table2and Fig.
1).
Within group C, HCO3values in blood gas measurements
at T1, T2, T3, T4, and T5 were statistically significantly dif-ferent (p < 0.001, Friedman test). This difference in group C was due to the T3 HCO3value being statistically significantly
lower than the T1 and T2 values, (p = 0.001, p < 0.001, re-spectively); the T4 HCO3value being statistically
significant-ly low compared with the T1 and T2 values (p < 0.001, p < 0.001, respectively); and the T5 HCO3value being
statis-tically significantly low compared with the T1 and T2 values (p < 0.001, p = 0.001, respectively, Wilcoxon signed ranks test) (Table2and Fig.1).
There was no statistically significant difference between the lactate values between the groups at T1, T2, T3, T4, and T5 measurements (Mann-Whitney U test).
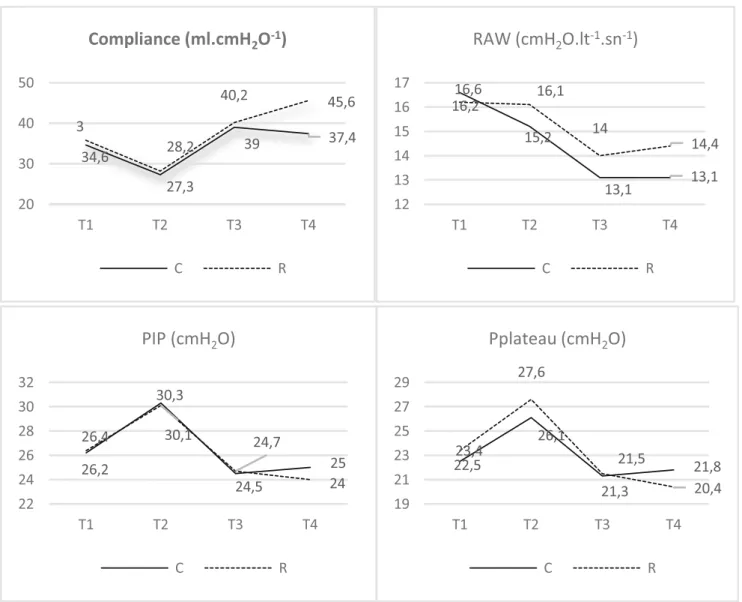
There was no statistically significant difference between the compliance values in the groups at T1, T2, and T3 mea-surements. However, when the T4 compliance value is exam-ined, the compliance in group R was statistically significantly high compared with the compliance in group C (p = 0.043, Mann-Whitney U test) (Table2and Fig.2).
Within both groups, the compliance values measured at T1, T2, T3, and T4 were statistically significantly different (p < 0.001, Friedman test). The compliance value measured at T4 in group C was not statistically different from the com-pliance value measured at T1, while it was significantly higher than the T2 value (p < 0.001, Wilcoxon signed ranks test). In group R, the T4 compliance value was found to be statistically significantly high compared with the T1, T2, and T3 measure-ments (p < 0.001 for all, Wilcoxon signed ranks test) (Table2
and Fig.2).
There was no statistically significant difference in terms of the Raw values in the control group and recruitment group at T1, T2, T3, and T4 measurements (Mann-Whitney U test) (Table3and Fig.2).
Within both groups, the Raw values measured at T1, T2, T3, and T4 were statistically significantly different (p < 0.001 for both groups, Friedman test). This difference in group C was due to the T3 Raw value being statistically significantly low compared with the T1 and T2 Raw values (p < 0.001, p < 0.001); additionally, in group C the T4 Raw value was
statistically significantly low compared with the T1 and T2 measurements (p < 0.001, p < 0.001, Wilcoxon signed ranks test). In group R, this difference was due to the T3 Raw value being statistically significantly low compared with the T1 and T2 Raw values (p = 0.002, p = 0.004, respectively) and the T4 Raw value being statistically significantly low compared with the T1 value (p = 0.002, Wilcoxon signed ranks test) (Table3
and Fig.2).
There was no statistically significant difference between the PIP measurement values in the groups at T1, T2, T3, and T4 measurements (Mann-Whitney U test) (Table3and Fig.
2).
Within both groups, the PIP values measured at T1, T2, T3, and T4 were statistically significantly different (p < 0.001 for both groups, Friedman test). This difference in both groups was due to the T2 PIP value being statistically significantly high compared with the T1, T3, and T4 PIP measurements (p < 0.001 for all measures in both groups, Wilcoxon signed ranks test) (Table3and Fig.2).
The Pplateau values at T1, T2, T3, and T4 measurements in both groups were not statistically significantly different (Mann-Whitney U test) (Table3and Fig.2).
Within both groups, the T1, T2, T3, and T4 Pplateau values were statistically significantly different (p < 0.001 in both groups, Friedman test). This difference was due to the T2 Pplateau value being statistically significantly high compared with the T1, T3, and T4 Pplateau measurements in both groups (p < 0.001 for all measures in both groups, Wilcoxon signed ranks test) (Table3and Fig.2).
Discussion
There is no guideline with definite rules for ventilation strat-egies in obese patients. However, in the literature, PEEP ap-plied after the recruitment maneuver and less than 80% FiO2
administration methods recommended to maintain physiolog-ical oxygenation [15,16]. Lung-protective ventilation strategy (aproximately 8 ml kg−1tidal volume and administered using estimated true body weight), PEEP administration, and alve-olar recruitment maneuvers prevent atelectasis and positively affect intraoperative gas exchange which prevents the devel-opment of hypoxemia [12,17]. High PEEP administration prevents the decrease in lung volume at the end of expirium formed by increased intraabdominal pressure and in this way is reported to have positive effects on respiratory mechanics, gas exchange, and PaO2values in morbidly obese patients
[18,19]. A variety of studies have reported that administration of PEEP with the RM ensures better oxygenation and compli-ance compared with patients with only PEEP applied [20–24]. With the aim of investigating the effects of PEEP and recruit-ment, there are studies performed by CT or MR imaging for each patient and evaluated according to the results of these
imaging methods [25–27]. Two studies by Rothen et al. [26,
27] administered at least 40 cmH2O pressure for 7–8 s
dura-tion and observed that all atelectatic lung tissues opened, there was a marked reduction in the amount of shunt and oxygena-tion significantly improved. Henzler et al. [28] in an animal study performed the recruitment maneuver with 45 cmH2O
pressure for 40 s and found the RM provided an increase in ventilation of weakly ventilated lung volumes. In our study, we attempted to determine the efficacy of PEEP and RM using respiratory mechanics values and arterial blood gas measure-ments due to the cost increase caused by these imaging methods and the technical difficulties of performing CT and MR imaging for obese patients. We used PEEP and the RM together. Talab et al. [29] stated there was better oxygenation, less atelectasis, and less postoperative respiratory complica-tions with no barotrauma encountered in the group with 10 cmH2O PEEP and 40 cmH2O recruitment procedure for
7–8 s. Golparvar et al. [30] performed in their study in 3 groups; multiple deep breathing maneuvers, PEEP, and both.
They reported that 40 cmH2O with 5 multiple deep breathing
was less effective than only PEEP administration or both used together. In our study, during the operation, PEEP adminis-trated with 8 cmH2O at the beginning before insufflation
lasted until the end of the operation, while the RM was per-formed 5 min after desufflation with 40 cmH2O pressure for
40 s duration. We used 100% oxygen only during the RM and as part of this maneuver for only 40 s. This is the limitation of our study. Although we used this FiO2value, there was no
difference between the groups in the T4 measurements per-formed at the 15th min after desufluation. T5 was the 30th min measurement after extubation and the difference between the two groups appeared in this measurement. This difference was more relevant with the pressure and duration we used. In fact, in one study, recruitment maneuver with low oxygen concen-tration has been shown to be more effective for oxygenation. [31] We found that the PaO2value in the recruitment group
was significantly high compared with the control group at T5. Hemmes et al. [32] administered high PEEP (12 cmH2O) to 34,6 27,3 39 37,4 3 28,2 40,2 45,6 20 30 40 50 T1 T2 T3 T4
Compliance (ml.cmH
2O
-1)
C R 16,6 15,2 13,1 13,1 16,2 16,1 14 14,4 12 13 14 15 16 17 T1 T2 T3 T4RAW (cmH
2O.lt
-1.sn
-1)
C R 26,2 30,3 24,5 25 26,4 30,1 24,7 24 22 24 26 28 30 32 T1 T2 T3 T4PIP (cmH
2O)
C R 22,5 26,1 21,3 21,8 23,4 27,6 21,5 20,4 19 21 23 25 27 29 T1 T2 T3 T4Pplateau (cmH
2O)
C Robese patients undergoing open abdominal surgery and stated it was not protective in terms of postoperative pulmonary complications. They stated that for intraoperative protective ventilation strategy, it is necessary to ensure low TV and low PEEP (2 cmH2O) without recruitment. Our study group
underwent laparoscopic surgery and there are studies showing that due to the negative effects on lung dynamics, our patients were more susceptible to atelectasis development [7,8,10]. Findings during open surgery may be different from laparo-scopic surgery. As a result, we applied relatively high PEEP along with the RM in our study.
Arterial blood gas analysis are one of the best methods to assess pulmonary function. The first parameter examined to assess the acid-base balance is pH [33]. Iwasaka et al. [34] investigated that blood gas analysis during laparoscopic sur-gery with increased intraabdominal pressure and CO2
insuf-flation decreases in arterial pH and increases in PaCO2values
due to CO2 retention. When we assessed pH, HCO3, and
PaCO2data in our study, we did not identify a difference
between the two groups for pH values; however, we deter-mined a decrease pH values at T2, T3, and T4 in both groups compared with the T1 pH value. In our study, there was no difference between the two groups in terms of HCO3values.
We did not identify any difference between the groups in terms of PaCO2values during surgery. However, the PaCO2
value in the recruitment group examined in blood gases at T5 was low compared with the control group PaCO2value
(with-in normal limits). With pneumoperitoneum, PaCO2values
increase, while this value decreases after pneumoperitoneum and we identified that this was significant in the recruitment group.
Sprung et al. [35] reported a 30% reduction in compliance and 68% increase in Raw in supine position for morbidly obese patients compared with normal weight patients. In lap-aroscopic surgery, PIP, Raw, and Pplateau increase, compli-ance decreases [35–38]. After desufflation, PIP and Pplateau decrease and compliance increases; however, it was shown to be 14% reduced compared with the value before insufflation [38]. It is proposed that the RM performed after desufflation in laparoscopic surgery is effective to completely regain lung compliance [35]. According to the data obtained in our study, we think the RM performed with PEEP has greater positive effects on compliance. When Raw is investigated, contrary to previous studies [36], we found Raw reduced during surgery. PIP values in both groups increased with insufflation, and we identified they regressed to values before pneumoperitone-um with desufflation. Based on the findings from Raw and PIP measurements, we concluded that 8 cmH2O PEEP
ad-ministration is beneficial during laparoscopy of obese patients.
Nielsen et al. [39] evaluated the effects of the RM on cen-tral hemodynamics in situations with hypovolemia, normovolemia, and hypervolemia. They found that during hypovolemia, left ventricular end-diastolic volume and cardi-ac output significantly decreased, while hypervolemia prevented these effects. In our study, we administered Table 3 Comparison of compliance, raw, PIP, and Pplateau values in groups
T1 T2 T3 T4 Compliance Group C (n = 30) 34.6 ± 8.1 27.3 ± 5.6 39 ± 9 37.4 ± 8.2b Group R (n = 30) 35.8 ± 11.3 28.2 ± 6.3 40.2 ± 11.1 45.6±15c P 0.988 0.888 0.941 0.043a Raw (cmH2O lt−1sn−1) Group C (n = 30) 16.6 ± 5.7 15.2 ± 3.6 13.1 ± 3.2d 13.1 ± 3.1d Group R (n = 30) 16.2 ± 5.6 16.1 ± 4.4 14 ± 3.6d 14.4 ± 4.8e P 0.629 0.474 0.368 0.38 PIP (cmH2O) Group C (n = 30) 26.2 ± 4.5 30.3 ± 3.8f 24.5 ± 3.3 25 ± 3.3 Group R (n = 30) 26.4 ± 4.2 30.1 ± 3.4f 24.7 ± 4.7 24 ± 4.1 P 0.795 0.818 0.97 0.176 Pplateau (cmH2O) Group C (n = 30) 22.5 ± 4.7 26.1 ± 5.6f 21.3 ± 3 21.8 ± 3.2 Group R (n = 30) 23.4 ± 3.8 27.6 ± 3.5f 21.5 ± 4.6 20.4 ± 4 P 0.543 0.338 0.87 0.132
Raw, air way resistance; PIP, peak inspiratory pressure; Pplateau, plateau pressure. Values given as mean ± standard deviation. Comparisons between groups used Mann-Whitney U test; comparisons within groups used Wilcoxon sign test
a
Comparison between groups is statistically significant
bWithin groups, comparisons with T2 are statistically significant
cWithin groups, comparisons with T1, T2, and T3 are statistically significant d
Within groups, comparisons with T1 and T2 are statistically significant
e
Within groups, comparisons with T1 statistically significant
f
balanced IV fluid replacement to our patients to avoid hypo-volemia. We did not encounter hypotension related to ventila-tor strategy in any of our patients in either group.
Based on the findings obtained in our study, we believe adding the RM to PEEP administration for morbidly obese patients undergoing LSG surgery is a more effective method to improve respiratory mechanics and arterial blood gas values that can be used safely.
Compliance with Ethical Standards
All procedures performed in studies involving human participants were in accordance with the ethical standards of the institutional and/or national research committee and with the 1964 Helsinki declaration and its later amendments or comparable ethical standards.
Conflict of Interest The authors declare no conflicts of interest.
References
1. WHO. Obesity Report, Updated:http://www.who.int/mediacentre/ factsheets/fs311/en/. 2013
2. Colquitt JL, Picot J, Loveman E, et al. Surgery for obesity. Cochrane Database Syst Rev. 2009;2:CD003641.
3. Shi X, Karmali S, Sharma AM, et al. A review of laparoscopic sleeve gastrectomy for morbid obesity. Obes Surg. 2010;20(8): 1171–7.
4. Joris JL, Hinque VL, Laurent PE, et al. Pulmonary function and pain after gastroplasty performed via laparotomy or laparoscopy in morbidly obese patients. Br J Anaesth. 1998;80(3):283–8. 5. Shiga T, Wajima Z, Inoue T, et al. Predicting difficult intubation in
apparently normal patients: a meta-analysis of bedside screening test performance. Anesthesiology. 2005;103(2):429–37.
6. Strandberg A, Tokics L, Brismar B, et al. Constitutional factors promoting development of atelectasis during anaesthesia. Acta Anaesthesiol Scand. 1987;31(1):21–4.
7. Salihoglu Z, Demiroluk S, Dikmen Y. Respiratory mechanics in morbid obese patients with chronic obstructive pulmonary disease and hypertension during pneumoperitoneum. Eur J Anaesthesiol. 2003;20(8):658–61.
8. Perilli V, Sollazzi L, Bozza P, et al. The effects of the reverse trendelenburg position on respiratory mechanics and blood gases in morbidly obese patients during bariatric surgery. Anesth Analg. 2000;91(6):1520–5.
9. Chambers WA. The Association of Anaesthetists of Great Britain and Ireland. PERI-OPERATIVE MANAGEMENT OF THE MORBIDLY OBESE PATIENT. 2007;
10. Azab T, El-Masry A, Salah M. Effect of intraoperative use of pos-itive end expiratory pressure on lung atelectasis during laparoscopic cholecystectomy, Egypt J Anaesth. 2005;21:219–25.
11. Eichenberger A, Proietti S, Wicky S, et al. Morbid obesity and postoperative pulmonary atelectasis: an underestimated problem. Anesth Anal. 2002;95(6):1788–92. table of contents
12. Lebuffe G, Andrieu G, Wierre F, et al. Anesthesia in the obese. J Visc Surg. 2010;147(5 Suppl):e11–9.
13. Murphy C, Wong DT. Airway management and oxygenation in obese patients. Can J Anaesth. 2013;60(9):929–45.
14. Whalen FX, Gajic O, Thompson GB, et al. The effects of the alve-olar recruitment maneuver and positive end-expiratory pressure on arterial oxygenation during laparoscopic bariatric surgery. Anesth Analg. 2006;102(1):298–305.
15. Pelosi P, Gregoretti C. Perioperative management of obese patients. Best Pract Res Clin Anaesthesiol. 2010;24(2):211–25.
16. Huschak G, Busch T, Kaisers UX. Obesity in anesthesia and inten-sive care. Best Pract Res Clin Endocrinol Metab. 2013;27(2):247– 60.
17. Fernandez-Bustamante A, Hashimoto S, Serpa Neto A, et al. Perioperative lung protective ventilation in obese patients. BMC Anesthesiol. 2015;15:56.
18. Wetterslev J, Hansen EG, Roikjaer O, et al. Optimizing peroperative compliance with PEEP during upper abdominal sur-gery: effects on perioperative oxygenation and complications in patients without preoperative cardiopulmonary dysfunction. Eur J Anaesthesiol. 2001;18(6):358–65.
19. Pelosi P, Ravagnan I, Giurati G, et al. Positive end-expiratory pres-sure improves respiratory function in obese but not in normal sub-jects during anesthesia and paralysis. Anesthesiology. 1999;91(5): 1221–31.
20. Tusman G, Bohm SH, Vazquez de Anda GF, do Campo JL, Lachmann B. Alveolar recruitment strategy improves arterial oxy-genation during general anaesthesia. Br J Anaesth 1999;82(1):8– 13.
21. Chalhoub V, Yazigi A, Sleilaty G, et al. Effect of vital capacity manoeuvres on arterial oxygenation in morbidly obese patients un-dergoing open bariatric surgery. Eur J Anaesthesiol. 2007;24(3): 283–8.
22. Almarakbi WA, Fawzi HM, Alhashemi JA. Effects of four intraop-erative ventilatory strategies on respiratory compliance and gas ex-change during laparoscopic gastric banding in obese patients. Br J Anaesth. 2009;102(6):862–8.
23. Reinius H, Jonsson L, Gustafsson S, et al. Prevention of atelectasis in morbidly obese patients during general anesthesia and paralysis: a computerized tomography study. Anesthesiology. 2009;111(5): 979–87.
24. Wei K, Min S, Cao J, et al. Repeated alveolar recruitment maneu-vers with and without positive end-expiratory pressure during bar-iatric surgery: a randomized trial. Minerva Anestesiol. 2018;84(4): 463–72.
25. Aldenkortt M, Lysakowski C, Elia N, et al. Ventilation strategies in obese patients undergoing surgery: a quantitative systematic review and meta-analysis. Br J Anaesth. 2012;109(4):493–502.
26. Rothen HU, Sporre B, Engberg G, et al. Re-expansion of atelectasis during general anaesthesia: a computed tomography study. Br J Anaesth. 1993;71(6):788–95.
27. Rothen HU, Neumann P, Berglund JE, et al. Dynamics of re-expansion of atelectasis during general anaesthesia. Br J Anaesth. 1999;82(4):551–6.
28. Henzler D, Pelosi P, Dembinski R, et al. Respiratory compliance but not gas exchange correlates with changes in lung aeration after a recruitment maneuver: an experimental study in pigs with saline lavage lung injury. Crit Care. 2005;9(5):R471–82.
29. Talab HF, Zabani IA, Abdelrahman HS, et al. Intraoperative venti-latory strategies for prevention of pulmonary atelectasis in obese patients undergoing laparoscopic bariatric surgery. Anesth Analg. 2009;109(5):1511–6.
30. Golparvar M, Mofrad SZ, Mahmoodieh M, et al. Comparative evaluation of the effects of three different recruitment maneuvers during laparoscopic bariatric surgeries of morbid obese patients on cardiopulmonary indices. Adv Biomed Res. 2018;7:89.
31. Topuz U, Salihoglu Z, Gokay BV, et al. The effects of different oxygen concentrations on recruitment maneuver during general an-esthesia for laparoscopic surgery. Surg Laparosc Endosc Percutan Tech. 2014;24(5):410–3.
32. Hemmes SN, Gama de Abreu M, Pelosi P, et al. High versus low positive end-expiratory pressure during general anaesthesia for open abdominal surgery (PROVHILO trial): a multicentre
randomised controlled trial. Lancet (London, England). 2014;384(9942):495–503.
33. Thompson CS. Acid base disorders and electrolyte imbalance. Compherensive respiratory care. Pennsylvania: WB saunders Company; 1995. p. 70–97.
34. Iwasaka H, Miyakawa H, Yamamoto H, et al. Respiratory mechan-ics and arterial blood gases during and after laparoscopic cholecys-tectomy. Canad J Anaesth. 1996;43(2):129–33.
35. Sprung J, Whalley DG, Falcone T, et al. The impact of morbid obesity, pneumoperitoneum, and posture on respiratory system me-chanics and oxygenation during laparoscopy. Anesth Analg. 2002;94(5):1345–50.
36. Oikkonen M, Tallgren M. Changes in respiratory compliance at laparoscopy: measurements using side stream spirometry. Can J Anaesth. 1995;42(6):495–7.
37. Cakmakkaya OS, Kaya G, Altintas F, et al. Restoration of pulmo-nary compliance after laparoscopic surgery using a simple alveolar recruitment maneuver. J Clin Anesth. 2009;21(6):422–6. 38. Bardoczky GI, Engelman E, Levarlet M, et al. Ventilatory effects of
pneumoperitoneum monitored with continuous spirometry. Anaesthesia. 1993;48(4):309–11.
39. Nielsen J, Nilsson M, Freden F, et al. Central hemodynamics during lung recruitment maneuvers at hypovolemia, normovolemia and hypervolemia. A study by echocardiography and continuous pul-monary artery flow measurements in lung-injured pigs. Intensive Care Med. 2006;32(4):585–94.
Publisher’s Note Springer Nature remains neutral with regard to jurisdic-tional claims in published maps and institujurisdic-tional affiliations.