EUROPEAN ORGANIZATION FOR NUCLEAR RESEARCH (CERN)
CERN-EP-2018-166 2019/02/06
CMS-HIG-17-025
Measurement of inclusive and differential Higgs boson
production cross sections in the diphoton decay channel in
proton-proton collisions at
√
s
=
13 TeV
The CMS Collaboration
∗Abstract
Measurements of the inclusive and differential production cross sections for the Higgs boson in the diphoton decay channel are performed using the data set of
proton-proton collisions at √s = 13 TeV collected by the CMS experiment at the LHC in
2016 and corresponding to an integrated luminosity of 35.9 fb−1. The cross sections
are measured in a fiducial phase space defined by a set of requirements on the iso-lation and kinematic variables of the photons. Differential cross sections are mea-sured as functions of the kinematic properties of the diphoton system and the event. A subset of the measurements is performed in regions of the fiducial phase space, where relative contributions of specific Higgs boson production mechanisms are en-hanced. The total cross section in the chosen fiducial phase space is measured to be
84±11 (stat)±7 (syst) fb = 84±13 fb, to be compared with a theoretical prediction
of 73±4 fb. All measurements are found to be in agreement with the theoretical
pre-dictions for the standard model Higgs boson with a mass of 125.09 GeV within the experimental and theoretical uncertainties.
Published in the Journal of High Energy Physics as doi:10.1007/JHEP01(2019)183.
c
2019 CERN for the benefit of the CMS Collaboration. CC-BY-4.0 license ∗See Appendix A for the list of collaboration members
1
1
Introduction
The discovery of a Higgs boson (H) was announced in 2012 by the ATLAS and CMS Collabora-tions [1–3] based on proton-proton (pp) collision data collected at the CERN LHC at center-of-mass energies of 7 and 8 TeV. Since its discovery, an extensive campaign of measurements [4] has been underway to characterize the new particle and test its properties against those pre-dicted by the standard model (SM) of particle physics. By comparing measured cross sections with predictions, as functions of the kinematic properties of the diphoton system and of the particles produced in association with the Higgs boson, it is possible to investigate the dynam-ics of Higgs boson production, decay, and accompanying jet activity.
These investigations are expected to give insights into the nature of the Higgs boson and enable testing of the perturbative quantum chromodynamics (QCD) predictions for Higgs boson pro-duction. Both the ATLAS and CMS Collaborations have presented results on the measurement of inclusive and differential cross sections for production of the Higgs boson in pp collisions at
√
s=8 TeV in the diphoton [5, 6], four-lepton [7, 8], and WW [9, 10] decay channels. Both
Col-laborations have also presented measurements of inclusive and differential production cross
sections in the four-lepton final state at√s=13 TeV [11, 12].
Production of the Higgs boson in pp collisions at the LHC occurs via four main mechanisms: gluon-gluon fusion (ggH), vector boson fusion (VBF), associated production with a W/Z boson (VH), and associated production with a top quark-antiquark pair (ttH). At the center-of-mass energy of 13 TeV, ggH production is about one order of magnitude larger than the sum of
the other production mechanisms. The SM prediction of the branching fraction for the H →
γγ decay is only about 0.2% [13] but this channel has a clean signature and it is possible to
reconstruct the diphoton invariant mass with high precision. The most precise measurements of differential cross sections of Higgs boson production can be made in this decay channel. The dominant sources of background are irreducible prompt diphoton production, and the
reducible processes pp → γ+jets and pp → multijets, where the jets are misidentified as
photons.
In this paper we report the measurement of the inclusive and differential cross sections for Higgs boson production in the diphoton decay channel using data corresponding to an
inte-grated luminosity of 35.9 fb−1of pp collisions at√s=13 TeV recorded by the CMS experiment
in 2016. The aim of the analysis is to perform measurements of the Higgs boson production cross section in a fiducial phase space, to be compared with theoretical predictions. The
meth-ods used closely follow those developed for the H → γγ differential cross section
measure-ments at√s=8 TeV [6] and are designed to measure the Higgs boson production as a function
of the final state kinematic observables with a minimal dependence on theoretical assumptions, allowing a direct comparison between the experimental results and the theoretical predictions. In contrast, the complementary approach adopted in [14] aims at maximizing the observation sensitivity for the SM Higgs boson by explicitly relying on theoretical predictions and their uncertainties.
For each bin of the differential observables, the signal is extracted by fitting to a narrow sig-nal peak on top of the steeply-falling background spectrum of the diphoton invariant mass distribution. To improve the precision of the measurements, the events are categorized using a diphoton mass resolution estimator. Both inclusive and differential cross sections are measured and unfolded within a fiducial phase space defined by the requirements on the photon kine-matic variables and isolation. Differential cross sections are measured as functions of several observables, describing the properties of the diphoton system and of (b quark) jets, leptons, and missing transverse momentum accompanying the diphoton system. A double-differential
cross section measurement is also performed as a function of the transverse momentum (pT)
of the diphoton system and the number of additional jets in the event. Cross section measure-ments are also performed in regions of the fiducial phase space. The regions are chosen to enhance the contribution of specific production mechanisms to the signal composition, based on the additional particles produced in association with the diphoton system and on the topol-ogy of the event.
2
The CMS detector
The central feature of the CMS apparatus is a superconducting solenoid of 6 m internal diame-ter, providing a magnetic field of 3.8 T. Within the solenoid volume are a silicon pixel and strip tracker, a lead tungstate crystal electromagnetic calorimeter (ECAL), and a brass and scintilla-tor hadronic calorimeter (HCAL), each composed of a barrel and two endcap sections. Forward calorimeters extend the pseudorapidity (η) coverage provided by the barrel and endcap detec-tors. Muons are detected in gas-ionization chambers embedded in the steel flux-return yoke outside the solenoid.
The electromagnetic calorimeter consists of 75 848 lead tungstate crystals, which provide cov-erage in pseudorapidity|η| <1.48 in a barrel region (EB) and 1.48 < |η| <3.0 in two endcap
regions (EE). Preshower detectors consisting of two planes of silicon sensors interleaved with
a total of 3X0of lead are located in front of each EE detector.
In the region |η| < 1.74, the HCAL cells have widths of 0.087 in pseudorapidity and 0.087
in azimuth (φ). In the η-φ plane, and for|η| < 1.48, the HCAL cells map on to 5×5 arrays
of ECAL crystals to form calorimeter towers projecting radially outwards from close to the
nominal interaction point. For|η| >1.74, the coverage of the towers increases progressively to
a maximum of 0.174 in∆η and ∆φ.
The forward hadron (HF) calorimeter uses steel as an absorber and quartz fibers as the sensitive material. The two halves of the HF are located 11.2 m from the interaction region, one on each
end, and together they provide coverage in the range 3.0 < |η| < 5.2. They also serve as
luminosity monitors.
Events of interest are selected using a two-tiered trigger system [15]. The first level (L1), com-posed of custom hardware processors, uses information from the calorimeters and muon de-tectors to select events at a rate of around 100 kHz within a time interval of less than 4 µs. The second level, known as the high-level trigger (HLT), consists of a farm of processors running a version of the full event reconstruction software optimized for fast processing, and reduces the event rate to around 1 kHz before data storage.
A more detailed description of the CMS detector, together with a definition of the coordinate system used and the relevant kinematic variables, can be found in Ref. [16].
3
Data samples and simulated events
The events used in the analysis were selected by a diphoton trigger with asymmetric pT
thresh-olds of 30 (18) GeV on the leading (sub-leading) photon, a minimum invariant diphoton mass
mγγof 90 GeV, and loose requirements on the calorimetric isolation and electromagnetic shower
shape of the photon candidates. The trigger selection is>99% efficient at retaining events
pass-ing the selection requirements described in Section 5.
3
the GEANT4 [17] package. Simulated events include the effects of pileup (additional pp
interac-tions from the same or nearby bunch crossings) and are weighted to reproduce the distribution of the number of interactions in data.
The signal samples are simulated with MADGRAPH5 [email protected] [18] at next-to-leading
order (NLO) in perturbative QCD with FxFx merging [19] for the ggH, VBF, VH, and ttH pro-duction processes. These samples include propro-duction of up to two additional jets in
associa-tion with the Higgs boson. The parton-level samples are interfaced toPYTHIA8.205 [20] with
the CUETP8M1 [21] underlying event tune, for parton showering, underlying event model-ing, and hadronization. In order to match the prediction for ggH production mechanism from
theNNLOPSprogram [22–24], the generated events are weighted according to the Higgs boson
pT and the number of jets in the event. The NNLOPS program has the advantage of
predict-ing at next-to-next-to-leadpredict-ing-order (NNLO) accuracy, both the differential cross section with respect to the QCD radiative effects and the normalization of the inclusive cross section. The
ggH samples are also generated with thePOWHEGv2 program [25–29], which includes
produc-tion of one addiproduc-tional jet, in order to provide an alternative theoretical predicproduc-tion for inclusive
measurements and measurements involving the highest-pT jet in the event. The NNPDF3.0
set [30] is used for parton distribution functions (PDFs). The SM Higgs boson cross sections and branching fractions are taken from the LHC Higgs Cross Section Working Group report [13]. Simulated background samples are used for training multivariate discriminants, and to define selection and classification criteria. The irreducible prompt diphoton background events are
generated using theSHERPAv2.2.1 program [31]. This program includes the tree-level matrix
elements with up to three additional jets and the box diagram at leading order accuracy. The
reducible background arising from γ+jet and multijet events is modeled withPYTHIA.
Samples of Z → e+e−, Z → µ+µ−, and Z → µ+µ−γ simulated events are generated with
MADGRAPH5 aMC@NLOand used for comparison with data and for the derivation of energy
scale and resolution corrections.
4
Event reconstruction
Photon candidates are reconstructed from clusters of energy deposited in the ECAL and merged into superclusters [32]. The reconstruction algorithm for photon clusters allows almost com-plete recovery of the energy from photons that convert to an electron-positron pair in the ma-terial upstream of the ECAL. A detailed description of the algorithm can be found in Ref. [33]. Changes in the transparency of the ECAL crystals due to irradiation during the LHC running periods and their subsequent recovery are monitored continuously and corrected for, using light injected from the laser and LED systems [34].
A multivariate regression technique is used to correct for the partial containment of the shower in a supercluster, the shower losses for photons that convert in the material upstream of the calorimeter, and the effects of pileup. Training is performed on simulated events using shower shape and position variables of the photon as inputs. The photon energy response distribution is parametrized by an extended form of the Crystal Ball function [35] built out of a Gaussian core and two power law tails. The regression provides a per-photon estimate of the function parameters, and therefore a prediction of the distribution of the ratio of true energy to the uncorrected supercluster energy. The most probable value of this distribution is taken as the photon energy correction. The width of the Gaussian core is used as a per-photon estimator of
In order to obtain the best energy resolution, the calorimeter signals are calibrated and
cor-rected for several detector effects [34]. Calibration of the ECAL uses photons from π0 → γγ
and η0 → γγdecays, and electrons from W → eν and Z → e+e− decays. The energy scale
in data is aligned to that in simulated events, while an additional smearing is applied to the reconstructed photon energy in simulation in order to reproduce the resolution observed in
data, through a multistep procedure exploiting electrons from Z→e+e−decays.
In the ECAL barrel section, an energy resolution of about 1% is achieved for unconverted or late-converting photons, i.e., photons converting near the inner face of the ECAL, that have energies in the range of tens of GeV. The remaining photons reconstructed in the barrel have a
resolution of about 1.3% up to a pseudorapidity of|η| =1, rising to about 2.5% at|η| =1.4. In
the endcaps, the resolution of unconverted or late-converting photons is about 2.5%, while the remaining endcap photons have a resolution between 3 and 4% [32].
The global event reconstruction (also called particle-flow event reconstruction [36]) aims to re-construct and identify each individual particle in an event, with an optimized combination of all subdetector information. In this process, the identification of the particle type (photon, electron, muon, charged hadron, neutral hadron) plays an important role in the determination
of the particle direction and energy. Photons (e.g., coming from π0 decays or from electron
bremsstrahlung) are identified as ECAL energy clusters not linked to the extrapolation of any charged particle trajectory to the ECAL. Electrons (e.g., coming from photon conversions in the tracker material or from b quark semileptonic decays) are identified as a primary charged particle track and potentially many ECAL energy clusters, corresponding to this track extrapo-lation to the ECAL and to possible bremsstrahlung photons emitted along the way through the tracker material. Muons (e.g., from b quark semileptonic decays) are identified as a track in the central tracker consistent with either a track or several hits in the muon system, associated with an energy deficit in the calorimeters. Charged hadrons are identified as charged particle tracks neither identified as electrons, nor as muons. Finally, neutral hadrons are identified as HCAL energy clusters not linked to any charged hadron trajectory, or as ECAL and HCAL energy excesses with respect to the expected charged hadron energy deposit.
The energy of photons is obtained from the ECAL measurement. The energy of electrons is determined from a combination of the track momentum at the main interaction vertex, the cor-responding ECAL cluster energy, and the energy sum of all bremsstrahlung photons attached to the track. The energy of muons is obtained from the corresponding track momentum. The energy of charged hadrons is determined from a combination of the track momentum and the corresponding ECAL and HCAL energy, corrected for zero-suppression effects and for the re-sponse function of the calorimeters to hadronic showers. Finally, the energy of neutral hadrons is obtained from the corresponding corrected ECAL and HCAL energy.
For each event, hadronic jets are clustered from either particle-flow candidates (for data and simulation) or stable particles excluding neutrinos (for generated events) using the infrared
and collinear-safe anti-kT algorithm [37, 38] with a distance parameter of 0.4. The jet
momen-tum is determined as the vectorial sum of momenta of all objects clustered into the jet. Extra proton-proton interactions within the same or nearby bunch crossings can contaminate the jet reconstruction. To mitigate this effect, particle-flow candidates built using tracks originating from pileup vertices are discarded and an offset correction is applied to account for remaining contributions [39]. Additional selection criteria are applied to each jet to remove jets potentially dominated by anomalous contributions from various subdetector components or reconstruc-tion failures. The momenta of jets reconstructed using particle-flow candidates in simulareconstruc-tion
5
and detector acceptance, and corrected on average accordingly. In situ measurements of the
momentum balance in dijet, photon+jet, Z+jet, and multijet events are used to account for
any residual differences in jet energy scale in data and simulation [40]. The jet energy resolution amounts typically to 15% at 10 GeV, 8% at 100 GeV, and 4% at 1 TeV.
Jets originating from the hadronization of b quarks are identified using the combined sec-ondary vertex (CSV) b-tagging algorithm [41]. The algorithm converts information on the displaced secondary vertex into a numerical discriminant, assigning high values to jets whose properties are more likely to be originating from b quarks. A tight working point on this dis-criminant is used in this analysis, which provides a misidentification rate for jets from light quarks and gluons of 0.1% and an efficiency for identifying b quark jets of about 55%.
The missing transverse momentum~pmiss
T , whose magnitude is referred to as pmissT , is defined as
the negative vectorial sum of the transverse momenta of all reconstructed particle flow candi-dates in the global event reconstruction.
Because no tracks are associated to photons, the assignment of the diphoton candidate to a vertex can only be done indirectly by exploiting the properties of each reconstructed vertex. Three discriminating variables are calculated for each reconstructed vertex: the sum of the squared transverse momenta of the charged-particle tracks associated with the vertex, and two
variables that quantify the vector and scalar balance of pT between the diphoton system and
the charged-particle tracks associated with the vertex. In addition, if either photon has an associated charged-particle track that has been identified as originating from a photon conver-sion to an electron-positron pair, the converconver-sion information is used. The variables are used as the inputs to a multivariate classifier based on a boosted decision tree (BDT) to choose the reconstructed vertex to be associated with the diphoton system. The average vertex finding efficiency of this algorithm is about 81% [14]. The vertex is considered to be correctly identi-fied if it is within 1 cm of the true vertex in the longitudinal direction. The contribution to the diphoton mass resolution from vertex displacements smaller than 1 cm is found to be negligible compared to the contribution from the photon energy resolution of the calorimeters.
A photon identification algorithm separates prompt photons from photon candidates result-ing from the misidentification of jet fragments [42]. These are mostly collimated photons from
neutral-hadron decays (π0, η0). The algorithm is implemented with a BDT trained on simulated
events. The input variables of the BDT are: the pseudorapidity and energy of the superclus-ter corresponding to the reconstructed photon, several variables characsuperclus-terizing the shape of the electromagnetic shower, and the isolation energy sums computed with the particle-flow algorithm [36]. Further information on the photon identification BDT can be found in [14].
5
Event selection
Each photon of the candidate pair entering the analysis is required to have a supercluster within
|η| < 2.5, excluding the region 1.4442 < |η| < 1.566, which corresponds to the ECAL
barrel-endcap transition region, and to satisfy selection criteria, described in Ref. [14], slightly more stringent than the trigger requirements, based on transverse momentum, isolation, and shower shape variables. The transverse momentum scaled by the invariant mass of the diphoton
can-didate (pT/mγγ) has to be greater than 1/3 (1/4) for the pT-leading (pT-subleading) photon.
The use of thresholds in pT/mγγ, rather than fixed thresholds in pT, prevents the distortion of
the low end of the mγγ spectrum. Furthermore, each photon must fulfill a requirement based
Jets are selected if they fulfill the pileup rejection criteria [43] and have pT >30 GeV. To avoid
double counting of photon candidates as jets, the minimum distance between each photon and a jet is required to satisfy ∆R(γ, jet) =
√
|∆η(γ, jet)|2+ |∆φ(γ, jet)|2 > 0.4, where∆η(γ, jet)
and∆φ(γ, jet)are the pseudorapidity and azimuthal angle differences between the photon and
the jet. Two collections of jets are selected in different pseudorapidity regions: |η| < 2.5 and
|η| <4.7. The two collections are used to study differential observables requiring at least one
or two selected hadronic jets in the event, respectively. The jets in the |η| < 2.5 collection
benefit from tracker information and this results in better reconstruction quality and energy
resolution; when requiring two jets in the same event, the|η|range is extended to 4.7 to increase
the selection acceptance. The same kinematic selection is applied to generator-level jets. Jets
with|η| <2.4 are identified as b jets at the reconstruction level if they satisfy the requirements
described in Section 4. At the generator level, at least one B hadron has to be clustered in a jet to be called a b jet.
Leptons (electrons and muons) are selected if they have pT > 20 GeV and |η| < 2.4. The
angular separation between the photon and the lepton∆R(γ, lepton)is required to be greater
than 0.35. Electrons must satisfy a set of loose requirements as described in Ref. [44] and they
are not selected in the pseudorapidity region 1.4442< |η| <1.566. Furthermore, the invariant
mass of the candidate electron and either of the two photons is required to be at least 5 GeV
from the nominal Z boson mass, in order to reject Z+γ→e+e−γevents with a misidentified
electron. Muons are required to pass a tight selection based on the quality of the track fit, the number of associated hits in the tracking detectors, and the longitudinal and transverse impact parameters of the track with respect to the event vertex and to satisfy a requirement on the relative isolation, corrected for pileup effects, calculated as the sum of the transverse energy of charged hadrons, neutral hadrons and photons in a cone of radius 0.4 around the muon. Generator-level leptons, required to satisfy the same kinematic selection, are “dressed”, i.e.,
the four-momenta of all photons in a cone of radius∆R= 0.1 around the lepton are added to
the four-momentum of the lepton.
The identification and trigger efficiencies are measured using data events containing a Z bo-son decaying to a pair of electrons, or to a pair of electrons or muons in association with a photon [32]. After applying corrections, based on control samples in data, to the input of the photon identification classifier, the efficiencies measured in data are found to be 3 (5)% lower
than in simulation for photons in the barrel (endcap) regions with R9 < 0.85 (0.9), where R9
is defined as the sum of the energy measured in a 3×3 crystal matrix, centered on the crystal
with the highest energy in the ECAL cluster of the candidate, divided by the energy of the candidate. Photon candidates undergoing a conversion before reaching the ECAL have wider
shower profiles and lower values of R9. A correction factor is applied to simulated events
to take into account the discrepancy in the efficiency between data and simulation. For the remaining photons, the predicted efficiencies are compatible with the ones measured in data.
6
Mass resolution estimator
The selected photon pairs are categorized according to their estimated relative mass resolution. For the typical energy range of the photons used in this analysis, corresponding to tens of GeV, the energy resolution estimator depends on the energy itself because of the stochastic and noise terms in the energy resolution of the ECAL [32, 34]. The nature of these two terms is such that the energy resolution improves at higher energy. This dependence is propagated to the
rela-tive mass resolution estimator σm, which is thus dependent on the mass of the diphoton pair,
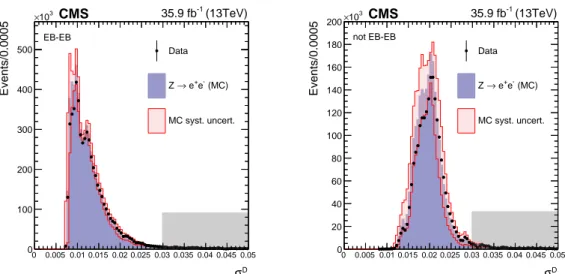
7 D m σ 0 0.005 0.01 0.015 0.02 0.025 0.03 0.035 0.04 0.045 0.05 Events/0.0005 0 100 200 300 400 500 3 10 × Data (MC) -e + e → Z MC syst. uncert. CMS 35.9 fb-1 (13TeV) EB-EB D m σ 0 0.005 0.01 0.015 0.02 0.025 0.03 0.035 0.04 0.045 0.05 Events/0.0005 0 20 40 60 80 100 120 140 160 180 200 3 10 × Data (MC) -e + e → Z MC syst. uncert. CMS 35.9 fb-1 (13TeV) not EB-EB
Figure 1: Comparison of the decorrelated mass resolution estimator σmD distributions in data
and simulation for Z →e+e−events where both electrons are reconstructed as photons,
pass-ing the selection defined in Section 5. The impact of the systematic uncertainty in the σE/E is
indicated by the red band. The distributions are shown separately for events with both elec-trons in the EB (left) and the remainder of the events, i.e., events with at least one photon in the EE (right). Events in the shaded gray region are discarded from the final analysis.
An event categorization simply based on such a variable would distort the shape of the mass distribution in the different categories and it would make the background distribution more complex to parametrize. In particular, a deficit of low-mass events would be observed in
cat-egories corresponding to low values of σm, invalidating the assumption of a smoothly falling
mass distribution on which the background model, described in Section 9.2, is based. To avoid
such an effect, the correlation between σm and the diphoton mass is removed, following the
methods in Ref. [6], and a new relative mass resolution estimator is built, σmD.
The modeling of the decorrelated mass resolution estimator is studied with simulated Z →
e+e−events, where electrons are reconstructed as photons. The per-photon resolution estimate
σE/E is affected by the imperfect modeling of the electromagnetic shower shape variables in
simulation, which are among the inputs of the regression used to estimate σE/E, as described
in Section 4. To minimize the disagreement [45], the per-photon resolution estimate is recom-puted using as input simulated shower shapes corrected to match those observed in data. A
systematic uncertainty of 5% is assigned to the value of σE/E for each photon candidate, to
cover the residual discrepancy. Figure 1 shows the comparison between data (dots) and
sim-ulation (histogram) for the decorrelated mass resolution estimator σmD, with the impact of the
systematic uncertainty in the σE/E (red band). Events with a value of σmDin the region depicted
in gray are discarded from the final analysis.
7
Event categorization
Events with both photons passing a minimum requirement on the output of the photon
iden-tification classifier, are sorted into categories of σmD to maximize the analysis sensitivity to the
SM Higgs boson. The number of categories and the positions of their σmD boundaries are
opti-mized simultaneously with the lower bound on the output of the photon identification
to saturate the maximum sensitivity achievable with this method for the present data set. The
boundaries of the σmD categorization are found to be 0, 0.0084, 0.012, 0.030, with a minimum
requirement on the output of photon identification classifier. Events with σmD > 0.030 are
dis-carded (shaded gray region in Fig. 1). The efficiency of the photon identification selection is roughly 80% for signal events in the fiducial phase space, discussed in Section 8. The cate-gories obtained from the optimization process correspond approximately to the configurations
where both photons are reconstructed in the central barrel (|η| <1) for the first category, both
photons are reconstructed in the barrel with at least one falling outside the central barrel for the second category, and at least one photon reconstructed in the endcap regions of the ECAL for the last category.
8
Observables and fiducial phase space
The analysis provides measurements of the production cross section of the Higgs boson in a fiducial phase space. This is defined by a set of selection criteria at generator level based on kinematic, geometrical and isolation variables, as well as on the topology of the event. By defin-ing a fiducial phase space, the measurements are compared to the theoretical predictions while avoiding the extrapolation to the full phase space and the consequent uncertainty. In order to extend such a comparison to future and alternative theoretical calculations, it is important to have a simple definition of the fiducial phase space so that it can be easily reproduced. Fur-thermore, the selection criteria in data, described in Section 5, are necessarily defined at the reconstruction level, while the fiducial phase space, for which theoretical predictions are com-puted, is defined without considering the effect of the detector response on the generator-level quantities. Because of the finite detector resolution, the two definitions do not exactly coincide, and for this reason events fulfilling the event selection criteria at the reconstruction level can originate from either inside or outside the fiducial phase space. To minimize the effect of events migrating, the selection criteria at the reconstruction level and the definition of this phase space are aligned as closely as possible.
The fiducial phase space for the analysis is defined by requiring that the generator-level
ra-tio between the pTof the pT-leading (pT-subleading) photon and mγγ, p
γ1
T /mγγ(p
γ2
T /mγγ), be greater than 1/3 (1/4), and that the absolute pseudorapidity of both photons be less than 2.5. In addition, the sum of the generator-level transverse energy of stable particles in a cone of
radius∆R= 0.3 around each photon candidate, Isoγ
gen, is required to be less than 10 GeV. This
requirement mimics at generator level the requirement on the output of the photon identifica-tion classifier applied on reconstructed quantities, as described in Secidentifica-tion 5. Further require-ments, that depend on the observable under study, can be applied on top of this “baseline” phase space definition. For observables involving only one jet, events with at least one jet with
|ηj| <2.5, selected as described in Section 5, are retained, corresponding to∼35% of the signal
events in the baseline phase space. Observables involving two jets are studied by requiring at
least two jets with|ηj| < 4.7 and defined as in Section 5, further restricting the region of the
phase space to ∼16% of the baseline selection. A VBF-enriched region of the fiducial phase
space, where a subset of the two-jet observables is measured, is defined by requiring the
pres-ence of two reconstructed and selected jets within|ηj| < 4.7, with a combined invariant mass
mj1j2 greater than 200 GeV and a pseudorapidity gap between the jets|∆ηj1,j2|greater than 3.5,
exploiting the main kinematic features of the VBF production mode. This set of criteria selects
∼3.8% of the signal events contained in the baseline phase space. The definition of the four
re-gions of the fiducial phase space is summarized in Table 1, which also gives a summary of the
9
the pT-leading (subleading) hadronic jet in the event, while y is used to denote the rapidity of
a particle or a system of particles. The transverse momentum and the rapidity of the diphoton
system, indicated with pγγ
T and|yγγ|, respectively, are sensitive probes of the Higgs boson
pro-duction mechanism, the modeling of the QCD radiation, and the PDFs of the proton. The cosine
of the polar angle in the Collins–Soper reference frame of the diphoton system [46], |cos(θ∗)|,
probes the spin and CP properties of the diphoton resonance. Observables involving jets are sensitive to the QCD parameters relevant to Higgs boson production. The separation in the
azimuthal angle between the diphoton and the two-jet systems,|∆φγγ,j1j2|, and the Zeppenfeld
variable,|ηj
1j2 −ηγγ|[47], probe specifically the properties of the VBF production mechanism.
The number of jets within|η| <2.5, b jets, and leptons are indicated with Njet, Njetb, and Nlepton,
respectively.
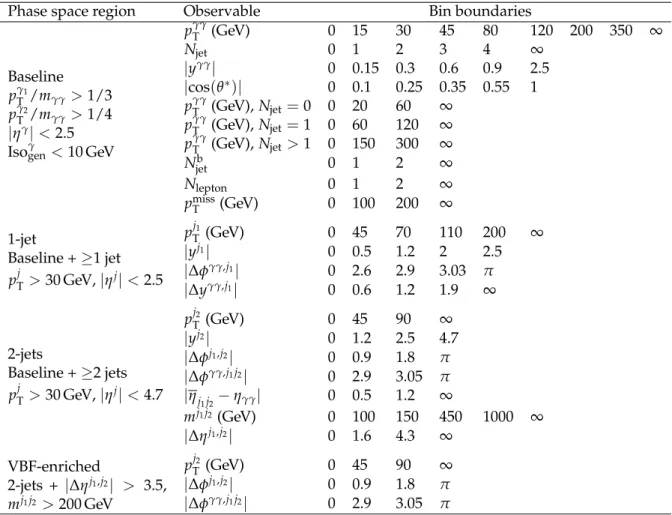
Table 1: The differential observables studied with the corresponding bins chosen, grouped by the region of the fiducial phase space where the measurements are performed.
Phase space region Observable Bin boundaries
Baseline pγ1 T /mγγ> 1/3 pγ2 T /mγγ> 1/4 |ηγ| < 2.5 Isoγ gen< 10 GeV pγγ T (GeV) 0 15 30 45 80 120 200 350 ∞ Njet 0 1 2 3 4 ∞ |yγγ| 0 0.15 0.3 0.6 0.9 2.5 |cos(θ∗)| 0 0.1 0.25 0.35 0.55 1 pγγ T (GeV), Njet= 0 0 20 60 ∞ pγγ T (GeV), Njet= 1 0 60 120 ∞ pγγT (GeV), Njet> 1 0 150 300 ∞ Njetb 0 1 2 ∞ Nlepton 0 1 2 ∞ pmiss T (GeV) 0 100 200 ∞ 1-jet Baseline + ≥1 jet pTj > 30 GeV, |ηj| < 2.5 pj1 T (GeV) 0 45 70 110 200 ∞ |yj1| 0 0.5 1.2 2 2.5 |∆φγγ,j1| 0 2.6 2.9 3.03 π |∆yγγ,j1| 0 0.6 1.2 1.9 ∞ 2-jets Baseline + ≥2 jets pTj > 30 GeV, |ηj| < 4.7 pj2 T (GeV) 0 45 90 ∞ |yj2| 0 1.2 2.5 4.7 |∆φj1,j2| 0 0.9 1.8 π |∆φγγ,j1j2| 0 2.9 3.05 π |ηj1j2− ηγγ| 0 0.5 1.2 ∞ mj1j2 (GeV) 0 100 150 450 1000 ∞ |∆ηj1,j2| 0 1.6 4.3 ∞ VBF-enriched 2-jets + |∆ηj1,j2| > 3.5, mj1j2 > 200 GeV pj2 T (GeV) 0 45 90 ∞ |∆φj1,j2| 0 0.9 1.8 π |∆φγγ,j1j2| 0 2.9 3.05 π
The inclusive fiducial cross section is also measured in restricted regions of the fiducial phase space, defined using additional criteria as follows:
• at least one lepton, at least one b-tagged jet, referred to as the ≥1-lepton, ≥1-b-jet
fiducial cross section (∼1.7×10⁻³of the baseline phase space);
• exactly one lepton, pmissT ≥100 GeV, referred to as the 1-lepton, high-pmissT fiducial
cross section (∼1.5×10⁻³of the baseline phase space);
• exactly one lepton, pmissT <100 GeV, referred to as the 1-lepton, low-pmissT fiducial cross section (∼7.4×10⁻³of the baseline phase space).
The first and second of these definitions loosely reproduce the event selections described in Ref. [14], which respectively target ttH and WH production mechanisms, with the W boson decaying leptonically. The third definition selects a region complementary to the second, pop-ulated mostly by events where the Higgs boson is produced in association with either a W or a Z boson.
For all the regions of the baseline phase space, the events contained in the baseline phase space that fail the additional requirements of a given region are collected in an additional bin (referred to as the “underflow”) and used to provide an additional constraint on the measurements, in particular to correctly account for migrations occurring between the baseline phase space and the region and to allow the profiling of the value of the Higgs boson mass in the signal-extraction fit, described in Section 11.
9
Statistical analysis
The events fulfilling the selection criteria are grouped into three categories, according to their
σmD, as described in Section 7. For each category, the final categorization employed for the signal
extraction is obtained by further splitting the events into the bins defined for each observable, as described in Section 8. The signal production cross section is extracted through a simul-taneous extended maximum likelihood fit to the diphoton invariant mass spectrum in all the
analysis categories. The likelihood in a given σmD category i and in given kinematic bin j of an
observable is reported in Eq. (1):
Lij(data|∆~σfid,~nbkg,θ~S,θ~B) = nmγγ
∏
l=1 ∑nb k=1∆σkfidK ij k(~θS)S ij k(mlγγ|~θS)L+n ij OOAS ij OOA(mlγγ|~θS) +n ij bkgBij(mlγγ|~θB) nijsig+nijbkg nlijev , (1) where:• nmγγis the number of bins of the mγγdistribution and nbis the number of kinematic
bins for the given observable;
• ∆~σfid = (∆σ1fid, . . . ,∆σnfidb) is the vector of fiducial cross sections being measured,
multiplied by the branching fraction of the diphoton decay channel;
• Kijk are the response matrices, which represent the efficiency that an event in the
k-th kinematic bin at generator level is reconstructed in k-the ij-k-th reconstruction-level
category (with the index i running over the σmD categories and the index j running
on the kinematic bins);
• the functions Sijk and Bijare the signal and background probability distribution
func-tions in mγγ for the bin ijk, which are described in the Sections 9.1 and 9.2,
respec-tively;
• L is the total integrated luminosity analyzed;
• nijev, nijsig, n ij
bkgare the numbers of observed, signal and background events in the ijth
reconstruction-level category, respectively;
• the terms nijOOASOOAij represent the contributions to the Higgs boson signal
9.1 Signal model 11
(OOA) Higgs boson signal is estimated from simulation to be approximately 1% of the total expected SM signal;
• the parametersθ~Sandθ~Bare the nuisance parameters associated with the signal and
background models, respectively. The complete likelihood is given in Eq. (2):
L(data|∆~σfid,~nbkg,~θS,θ~B) = ncat
∏
i=1 nb∏
j=1 LijPois(nijev|nijsig+nbkgij )Pdf(~θS)Pdf(~θB), (2) where:• ncatis the number of categories in σmD;
• Pois and Pdf indicate the Poisson distribution and the nuisance parameters
proba-bility density function, respectively.
The unfolding to the particle-level cross sections is achieved by extracting the vector ∆~σfid
directly from the likelihood fit, providing unfolded unregularized cross sections. No regular-ization of the results is applied, since the bins chosen are sufficiently larger than the resolution for a given observable. The uncertainties and the correlation matrices are obtained from the
test statistic q(∆~σfid)defined below and asymptotically distributed as a χ2with nb degrees of
freedom [48]: q(∆~σfid) = −2 log L(∆ ~σfid|~θˆ∆~σfid) L(∆ˆ~σfid|~θˆ) ! , (3)
where~θ = (nbkg,~θS,~θB). The notations~θˆand∆ˆ~σfidrepresent the best fit estimate of~θand∆~σfid,
respectively, and~θˆ∆~σfidindicates the best fit estimate of~θ, conditional on the value of∆~σ
fid. The
nuisance parameters, including the Higgs boson mass, are profiled in the fit across all the bins. 9.1 Signal model
For each observable, a parametric signal model is constructed separately for each fiducial-level bin (including an extra bin collecting the OOA events), reconstruction-level bin, and category
in σmD. Since the shape of the mγγ distribution is significantly different for events where the
vertex has been correctly identified compared to other events, these two components are mod-eled separately. The model is built as a fit to a sum of up to five Gaussian distributions of the simulated invariant mass shape, modified by the trigger, reconstruction, and identification
efficiency corrections estimated from data control samples, for each of the three values of mH
∈ {120, 125, 130}GeV. Signal models for other nominal values of mHbetween 120 and 130 GeV
are produced by interpolating the fitted parameters. The final signal model for a given cate-gory and a reconstruction-level bin is obtained by summing the functions, normalized to the expected signal yields, for each fiducial-level bin and vertex identification scenario.
9.2 Background model
A background model is produced for every bin of the observable and for each of the three
cat-egories in σmD. A discrete profiling method [49], originally developed for the H → γγ decay
observation analysis [42], is used. The background is evaluated by fitting to the mγγ
distribu-tion in data over the range 100<mγγ <180 GeV.
The choice of the function used to fit the background in a particular event class is included as a discrete nuisance parameter in the formulation of the likelihood. Exponentials, power-law
functions, polynomials in the Bernstein basis, and Laurent polynomials are used to represent
B(mγγ|~θB) in Eq. (1). A signal-plus-background hypothesis is fit to data by minimizing the
value of twice the negative logarithm of the likelihood. All functions are tried, with a “penalty term” added to account for the number of free parameters in the fit. The penalized likelihood
function eLB for a single fixed background fitting function B is defined as:
−2 ln eLB = −2 lnLB+NB, (4)
where LB is the “unpenalized” likelihood function and NB is the number of free parameters
in B. When fitting the complete likelihood, the number of degrees of freedom (number of exponentials, number of terms in the series, degree of the polynomial, etc.) is increased until
no significant improvement occurs in the likelihood between N+1 and N degrees of freedom
for the fit to the data distribution. The improvement is quantified by extracting the p-value
from the F-distribution between the fits using N+1 and N degrees of freedom and requiring
it to be smaller than 0.05.
10
Systematic uncertainties
Systematic uncertainties listed in this section are included in the likelihood as nuisance pa-rameters and are profiled during the minimization. Unless specified otherwise, the sources of uncertainty refer to the individual quantity studied, and not to the final yield. The total uncertainty in the inclusive and differential measurements is dominated by the statistical un-certainties.
The systematic uncertainties affecting the shape of the mγγdistribution are treated as Gaussian
variations. Those considered in this analysis are as follows:
• Vertex finding efficiency: the largest contribution to the uncertainty comes from the
modeling of the underlying event, plus the uncertainty in the measurement of the
ratio of data and simulation efficiencies obtained using Z → µ+µ− events. It is
handled as an additional nuisance parameter built into the signal model that allows the fraction of events in the right vertex/wrong vertex scenarios to change. The size of the uncertainty in the vertex selection efficiency is 1.5%;
• Energy scale and resolution: these corrections are studied with electrons from Z →
e+e−and then applied to photons. The main source of systematic uncertainty is the
different interactions of electrons and photons with the material upstream from the
ECAL. Uncertainties are assessed by changing the R9distribution, the energy
regres-sion training (using electrons instead of photons), and the electron selection used to
derive the corrections. The uncertainties in the different |η|and R9 bins are
propa-gated to the Higgs boson signal phase space in order to estimate the uncertainty in the additional energy smearing. In both cases, dedicated nuisance parameters are included as additional systematic terms in the signal model and amount to less than about 0.5%, depending on the photon category.
The sources of systematic uncertainty having an impact mainly on the category yield, while
leaving the shape of the mγγdistribution largely unaffected, are treated as log-normal
uncer-tainties. In this analysis, the following are considered:
• Integrated luminosity: the systematic uncertainty is estimated from data to be 2.5% [50];
• Trigger efficiency: the trigger efficiency is measured from Z →e+e−events using the
13
• Photon selection: the systematic uncertainty is taken as the uncertainty in the ratio
between the efficiency measured in data and in simulation; it ranges from 0.3 to 3.2% and results in an event yield variation from 0.7 to 4.0% depending on the photon category;
• Photon identification BDT score: the uncertainties in the signal yields in the
differ-ent categories of the analysis are estimated conservatively by propagating the un-certainty in the BDT inputs, which are estimated from the observed discrepancies between data and simulation, to the final photon identification BDT shape. This uncertainty has an effect of 3–5% on the signal yield, depending on the category;
• Per-photon energy resolution estimate: this is parametrized as a rescaling of the
resolu-tion estimate by±5% about the nominal value;
• Jet energy scale and resolution corrections: the uncertainties in these quantities are
prop-agated to the final signal yields and induce event migrations between jet bins. The size of such migrations is in the 10–20% range, depending on the jet bin;
• Pileup identification for jets: this uncertainty is estimated in events with a Z boson and
one balanced jet. The full discrepancy between data and simulation in the identifi-cation score of jets is taken as the estimated uncertainty. It results in migrations from
one jet bin to another, whose size is<1%;
• Background modeling: the choice of the background parametrization is handled using
the discrete profiling method. This is automatically included as a statistical tainty in the shape of the background function and no additional systematic uncer-tainty needs to be added;
• b tagging efficiency: this is evaluated by varying the ratio between the measured b
tagging efficiency in data and simulation within its uncertainty [52]. The resulting uncertainty in the signal yield is<1%;
• Lepton identification: for both electrons and muons, the uncertainty is computed by
varying the ratio of the efficiency measured in data and simulation by its uncer-tainty. The resulting differences in the selection efficiency, for observables involving leptons, is less than 1%;
• Missing transverse momentum: the size of this uncertainty is computed by shifting the
momentum scale and resolution of the pTof every particle-flow candidate entering
the computation of pmiss
T , by an amount that depends on the type of the reconstructed
object, as described in Ref. [53]. This has an effect on the yield per category below 1%; This results in events migrating from one bin to another and from one category
to another for observables involving pmissT ;
• PDF uncertainties: the effect of the uncertainty from the choice of PDF is assessed
by estimating the relative yield variation in each bin of the observable variables and category, after weighting the events of the simulated signal sample. The re-weighting is done using the PDF4LHC15 combined PDF set and NNPDF3.0 [30, 54]
using theMC2HESSIANprocedure [55]. The category migrations are found to be less
than 0.3%;
• Renormalization and factorization scale uncertainty: the size of this uncertainty is
esti-mated by varying the renormalization and factorization scales. The effect on cate-gory migrations is found to be negligible.
11
Results
The reconstructed diphoton invariant mass distributions are shown in Fig. 2 for the three σmD
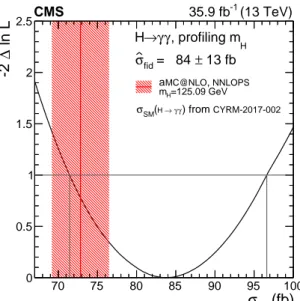
categories. The signal-plus-background fit is performed simultaneously in all three categories to extract the inclusive fiducial cross section. The best fit value of the inclusive fiducial cross section is:
ˆσfiducial=84±11 (stat)±7 (syst) fb=84±13 (stat+syst) fb (5)
The total uncertainty (13 fb) is dominated by its statistical component (11 fb). The primary con-tributions to the systematic component (7 fb) arise from the uncertainties in the photon identi-fication BDT score and in the per-photon energy resolution estimate, described in Section 10. The corresponding likelihood scan is shown in Fig. 3, together with the theoretical prediction for the cross section. In the measurement of both inclusive and differential fiducial cross sec-tions, the Higgs boson mass is treated as a nuisance parameter and profiled in the likelihood maximization. The value of the profiled mass is compatible with the world average [56].
The theoretical prediction for the inclusive cross section is σfiducialtheory = 73±4 fb. The
mea-sured value is in agreement with the prediction within 1 standard deviation. The prediction is
computed using simulated events generated with MADGRAPH5 aMC@NLO, where each of the
Higgs boson production mechanisms is normalized to the predictions from Ref. [13]. The sim-ulated events are used to compute the fiducial phase space acceptance for the SM Higgs boson with a mass of 125.09 GeV, corresponding to the measured world average value [56], and this value is then multiplied by the corresponding total cross section and branching fraction quoted in Ref. [13]. The uncertainties in the cross section and branching ratio predictions are also taken from Ref. [13] and propagated to the final prediction. The fiducial phase space acceptance is estimated to be 0.60 for the SM Higgs boson. This value amounts to 0.60, 0.60, 0.52, and 0.52 for ggH, VBF, VH, and ttH production, respectively. The associated QCD scale uncertainty is estimated by independently varying the renormalization and factorization scales used in the calculation by a factor of 2 upwards and downwards, excluding the combinations (1/2, 2) and (2, 1/2), and it amounts to approximately 1% of the acceptance value. The acceptance for the
ggH production mode is estimated using events generated withPOWHEG, both with and
with-out weighting the events to match the prediction from theNNLOPSprogram, leading in both
cases to a change of about 1%.
The measurements of the differential cross sections as functions of the observables under study are reported in Figs. 4–10. The figures show the best fit value, the 1 standard deviation uncer-tainty resulting from the likelihood scans for each bin of each observable, and the systematic contribution to the total uncertainty. The measurements are compared to theoretical predictions obtained using different generators for the calculation of the spectrum of the observables, with the cross section and branching fraction values taken from Ref. [13]. The contributions from
the VBF, VH, and ttH production mechanisms are simulated with the MADGRAPH5 aMC@NLO
program. For the ggH contribution, three different predictions are calculated and each of these in turn is added to the VBF, VH, and ttH contributions. The ggH contribution is simulated
with the MADGRAPH5 aMC@NLOprogram and its events are weighted to match theNNLOPS
prediction, as explained in Section 3. For the observables inclusive in the number of jets or de-scribing the kinematic observables of the first jet, the prediction for the ggH contribution is also
simulated using thePOWHEGprogram. The theoretical prediction for the|∆φγγ,j1j2|spectrum is
known to be not infrared-safe for values close to π [57], with large uncertainties related to soft jet production in ggH events. In this regime the theoretical uncertainties obtained with scale variations tend to be underestimated. This effect is particularly relevant in the last bin of the spectrum corresponding to the values 3.05–π.
15 Events / GeV 0 200 400 600 800 1000 1200 1400 1600 1800 2000 2200 Data S+B fit B component category 0 D m σ fid σ CMS 35.9 fb-1 (13TeV) γ γ → H (GeV) γ γ m 100 110 120 130 140 150 160 170 180 100 − 50 − 0 50 100 150 B component subtracted Events / GeV 0 1000 2000 3000 4000 5000 Data S+B fit B component category 1 D m σ fid σ CMS 35.9 fb-1 (13TeV) γ γ → H (GeV) γ γ m 100 110 120 130 140 150 160 170 180 200 − 100 − 0 100 200 B component subtracted Events / GeV 0 2000 4000 6000 8000 10000 12000 14000 Data S+B fit B component category 2 D m σ fid σ CMS 35.9 fb-1 (13TeV) γ γ → H (GeV) γ γ m 100 110 120 130 140 150 160 170 180 300 − 200 − 100 − 0 100 200 300 B component subtracted
Figure 2: The diphoton mass spectrum in data (black points), together with the best
signal-plus-background fit (red lines), for each σmDcategory employed for the measurement of the inclusive
fiducial cross section, as defined in Section 7. The two bands indicate the one and two standard deviation uncertainty in the background component.
The precision in the measurement of the differential fiducial cross sections varies widely de-pending on the observable under study. The observable that allows the most precise
measure-ment and the largest number of bins is pγγT , where 8 bins are defined and the measurements
have uncertainties around 40% on average, as shown in Fig. 4 (top left). The observables|yγγ|
and|cos(θ∗)|yield measurements with uncertainties at the level of∼35% in 5 bins, reported in
Fig. 4 (bottom left and right, respectively). The uncertainties in the measurement as a function
of the jet multiplicity, Njet, presented in Fig. 4 (top right), range from∼25% for the 0-jet bin up
to&100% for the high jet multiplicity bins. For the observables describing the properties of the
first additional jet j1, shown in Fig. 5, the average uncertainty is∼50% with four bins, with the
exception of pj1
T, where 5 bins are used and the uncertainties are around 70%. The spectrum of
(fb) fid σ 70 75 80 85 90 95 100 ln L ∆ -2 0 0.5 1 1.5 2 2.5 13 fb ± = 84 fid σ CYRM-2017-002 ) from γ γ → H ( SM σ NNLOPS , MC@NLO a =125.09 GeV H m CMS 35.9 fb-1 (13 TeV) H , profiling m γ γ → H
Figure 3: Likelihood scan (black curve) for the fiducial cross section measurement, where the value of the SM Higgs boson mass is profiled in the fit. The measurement is compared to the theoretical prediction (vertical red line), shown with its uncertainty (red hatched area), and it is found in agreement within the uncertainties.
ranging between ∼70 and ∼90% and employing three bins, except for mj1j2 for which 5 bins
are defined. As the measurements as functions of pj2
T,|∆φj1,j2|, and |∆φγγ,j1j2|are restricted to
the VBF-enriched region of the phase space, the uncertainties are between 110 and 150%, as
shown in Fig. 8. The double differential measurement as a function of pγγ
T and Njet, reported
in Fig. 9, allows the extraction of the cross section in 9 bins with uncertainties ranging from
∼35 to∼60%. The measurements as a function of Nb
jet, Nlepton, and pmissT , presented in Fig. 10,
have uncertainties, in all bins except the first, of 200–250%. In the first bin, which contains the vast majority of the selected events, the uncertainties are comparable to the uncertainty in the inclusive cross section measurement. The results are found to be in agreement with the SM predictions within the uncertainties.
The measurement of the inclusive fiducial cross section is also performed in regions of the fiducial phase space. These regions, as described in Section 8, represent a very limited fraction
(∼10−3) of the baseline phase space and target individual production mechanisms of the Higgs
boson. The results of these measurements are summarized in Fig. 11, where selected bins of the differential measurements are also reported, in order to provide a more comprehensive summary. The measurements are compared to the corresponding theoretical predictions,
ob-tained using MADGRAPH5 aMC@NLOsimulated signal events, with the ggH simulated events
weighted to match the NNLOPS program prediction. The values of the cross section and the
branching fraction are taken from Ref. [13]. The uncertainties in the measurements are around
250% for the 1-lepton, high pmissT and 1-lepton, low pmissT cross sections, and∼350% for the≥
1-lepton,≥1-b-jet cross section. The measurements are found to be compatible with the SM
17 0 50 100 150 200 250 300 350 400 450 500 (fb/GeV) γγ T p ∆ / fid σ∆ 4 − 10 3 − 10 2 − 10 1 − 10 1 10 2 10 3 10 4 10 5 10 MC@NLO H a t HX = VBF + VH + t + HX NNLOPS , MC@NLO ggH a + HX MC@NLO ggH a + HX POWHEG ggH CYRM-17-002 ) from γ γ → H ( SM σ syst unc. ⊕ Data, stat Systematic uncertainty >350 GeV)/150 γ γ T (p fid σ CMS 35.9 fb-1 (13 TeV) γ γ → H (GeV) γ γ T p 0 100 200 300 400 500 Ratio to prediction 0.5 − 0 0.5 1 1.52 2.5 0 1 2 3 >3 (fb) jet N ∆ / fid σ∆ 1 10 2 10 3 10 4 10 HX = VBF + VH + ttH aMC@NLO + HX NNLOPS , MC@NLO ggH a + HX MC@NLO ggH a CYRM-17-002 ) from γ γ → H ( SM σ syst unc. ⊕ Data, stat Systematic uncertainty | < 2.5 jet η > 30 GeV, | jet T p CMS 35.9 fb-1 (13 TeV) γ γ → H jet N 0 1 2 3 >3 Ratio to prediction 0 1 2 3 4 0 0.5 1 1.5 2 2.5 | (fb) γγ |y ∆ / fid σ∆ 10 2 10 3 10 MC@NLO H a t HX = VBF + VH + t + HX NNLOPS , MC@NLO ggH a + HX MC@NLO ggH a + HX POWHEG ggH CYRM-17-002 ) from γ γ → H ( SM σ syst unc. ⊕ Data, stat Systematic uncertainty CMS 35.9 fb-1 (13 TeV) γ γ → H | γ γ |y 0 0.5 1 1.5 2 2.5 Ratio to prediction 1 1.5 2 0 0.1 0.2 0.3 0.4 0.5 0.6 0.7 0.8 0.9 1 *)| (fb) θ |cos( ∆ / fid σ∆ 50 100 150 200 250 300 MC@NLO H a t HX = VBF + VH + t + HX NNLOPS , MC@NLO ggH a + HX MC@NLO ggH a + HX POWHEG ggH CYRM-17-002 ) from γ γ → H ( SM σ syst unc. ⊕ Data, stat Systematic uncertainty CMS 35.9 fb-1 (13 TeV) γ γ → H *)| θ |cos( 0 0.2 0.4 0.6 0.8 1 Ratio to prediction 0.5 1 1.5 2
Figure 4: Measurement of the differential cross section (black points) as functions of pγγ
T , Njet,
|yγγ|, and|cos(
θ∗)|. The error bars indicate 1 standard deviation uncertainty. The systematic
component of the uncertainty is shown by the blue band. The measurements are compared to different simulation programs (histograms) with their uncertainties (hatched areas), all nor-malized to the same theoretical predictions from Ref. [13]. When the last bin of the distribution is an overflow bin, the normalization of the cross section in that bin is indicated in the figure.
12
Summary
Measurements of the inclusive and differential fiducial cross sections for production of the Higgs boson in the diphoton decay channel have been performed using an integrated
lumi-nosity of 35.9 fb−1of proton-proton collision data collected by the CMS experiment at a
center-of-mass energy of 13 TeV. The measurements of the differential cross sections are reported as functions of a set of observables characterizing the diphoton system and particles produced in association with the Higgs boson. The measurements are performed for isolated photons in the fiducial phase space defined by requiring that both photons are isolated and within the pseudorapidity|ηγ| <2.5 and pT/mγγ >1/3(1/4)for the leading (subleading) photon. In this
50 100 150 200 250 300 (fb/GeV) 1 j T p ∆ / fid σ∆ 2 − 10 1 − 10 1 10 MC@NLO H a t HX = VBF + VH + t + HX NNLOPS , MC@NLO ggH a + HX MC@NLO ggH a + HX POWHEG ggH CYRM-17-002 ) from γ γ → H ( SM σ syst unc. ⊕ Data, stat Systematic uncertainty >200 GeV)/80 1 j T (p fid σ | < 2.5 1 j η > 30 GeV, | 1 j T p CMS 35.9 fb-1 (13 TeV) γ γ → H (GeV) 1 j T p 50 100 150 200 250 300 Ratio to prediction −1 0 1 2 3 4 0 0.5 1 1.5 2 2.5 | (fb) 1 j |y ∆ / fid σ∆ 5 10 15 20 25 30 35 40 45 MC@NLO H a t HX = VBF + VH + t + HX NNLOPS , MC@NLO ggH a + HX MC@NLO ggH a + HX POWHEG ggH CYRM-17-002 ) from γ γ → H ( SM σ syst unc. ⊕ Data, stat Systematic uncertainty | < 2.5 1 j η > 30 GeV, | 1 j T p CMS 35.9 fb-1 (13 TeV) γ γ → H | 1 j |y 0 0.5 1 1.5 2 2.5 Ratio to prediction 0.5 − 0 0.5 1 1.5 2 0 0.5 1 1.5 2 2.5 3 | (fb) 1 ,j γγ φ∆ | ∆ / fid σ∆ 1 10 2 10 3 10 4 10 5 10 MC@NLO H a t HX = VBF + VH + t + HX NNLOPS , MC@NLO ggH a + HX MC@NLO ggH a + HX POWHEG ggH CYRM-17-002 ) from γ γ → H ( SM σ syst unc. ⊕ Data, stat Systematic uncertainty | < 2.5 1 j η > 30 GeV, | 1 j T p CMS 35.9 fb-1 (13 TeV) γ γ → H | 1 ,j γ γ φ ∆ | 0 0.5 1 1.5 2 2.5 3 Ratio to prediction 0 0.5 1 1.5 2 0 0.5 1 1.5 2 2.5 | (fb) 1 ,j γγ y ∆ | ∆ / fid σ∆ 0 10 20 30 40 50 MC@NLO H a t HX = VBF + VH + t + HX NNLOPS , MC@NLO ggH a + HX MC@NLO ggH a + HX POWHEG ggH CYRM-17-002 ) from γ γ → H ( SM σ syst unc. ⊕ Data, stat Systematic uncertainty |>1.9)/0.7 1 ,j γ γ y ∆ (| fid σ | < 2.5 1 j η > 30 GeV, | 1 j T p CMS 35.9 fb-1 (13 TeV) γ γ → H | 1 ,j γ γ y ∆ | 0 0.5 1 1.5 2 2.5 Ratio to prediction−0.5 0 0.5 1 1.5 2 2.5
Figure 5: Measurement of the differential cross section (black points) as functions pj1
T, |yj1|, |∆φγγ,j1|, and|∆yγγ,j1|. The error bars indicate 1 standard deviation uncertainty. The
system-atic component of the uncertainty is shown by the blue band. The measurements are compared to different simulation programs (histograms) with their uncertainties (hatched areas), all nor-malized to the same theoretical predictions from Ref. [13]. When the last bin of the distribution is an overflow bin, the normalization of the cross section in that bin is indicated in the figure.
fiducial phase space, the cross section is measured to be 84±13 fb, compared with a theoretical
prediction of 73±4 fb. The double-differential measurement is performed as a function of the
transverse momentum of the diphoton system and the jet multiplicity in the event.
A subset of the differential observables describing the kinematics of the system of two addi-tional jets is studied in a vector-boson-fusion enriched fiducial phase space. The inclusive cross section is also measured in three regions of the fiducial phase space, additionally requiring the
presence of one selected lepton and missing transverse momentum pmissT <100 GeV, or one
se-lected lepton and pmissT ≥100 GeV, or at least one selected lepton and at least one b-tagged jet,
19 30 40 50 60 70 80 90 100 110 120 (fb/GeV) 2 j T p ∆ / fid σ∆ 2 − 10 1 − 10 1 10 2 10 MC@NLO H a t HX = VBF + VH + t + HX NNLOPS , MC@NLO ggH a + HX MC@NLO ggH a CYRM-17-002 ) from γ γ → H ( SM σ syst unc. ⊕ Data, stat Systematic uncertainty >90 GeV)/45 2 j T (p fid σ | < 4.7 1,2 j η > 30 GeV, | 1,2 j T p CMS 35.9 fb-1 (13 TeV) γ γ → H (GeV) 2 j T p 30 40 50 60 70 80 90 100 110 120 Ratio to prediction 1 −0 1 2 3 0 0.5 1 1.5 2 2.5 3 3.5 4 4.5 | (fb) 2 j |y ∆ / fid σ∆ 0 2 4 6 8 10 12 14 MC@NLO H a t HX = VBF + VH + t + HX NNLOPS , MC@NLO ggH a + HX MC@NLO ggH a CYRM-17-002 ) from γ γ → H ( SM σ syst unc. ⊕ Data, stat Systematic uncertainty | < 4.7 1,2 j η > 30 GeV, | 1,2 j T p CMS 35.9 fb-1 (13 TeV) γ γ → H | 2 j |y 0 0.5 1 1.5 2 2.5 3 3.5 4 4.5 Ratio to prediction −2 1 − 0 1 2 0 0.5 1 1.5 2 2.5 3 | (fb) 2 ,j1 j φ∆ | ∆ / fid σ∆ 0 2 4 6 8 10 MC@NLO H a t HX = VBF + VH + t + HX NNLOPS , MC@NLO ggH a + HX MC@NLO ggH a CYRM-17-002 ) from γ γ → H ( SM σ syst unc. ⊕ Data, stat Systematic uncertainty | < 4.7 1,2 j η > 30 GeV, | 1,2 j T p CMS 35.9 fb-1 (13 TeV) γ γ → H | 2 ,j 1 j φ ∆ | 0 0.5 1 1.5 2 2.5 3 Ratio to prediction 0.5 − 0 0.5 1 1.5 0 0.5 1 1.5 2 2.5 3 | (fb) 2 j1 ,j γγ φ∆ | ∆ / fid σ∆ 1 10 2 10 3 10 4 10 MC@NLO H a t HX = VBF + VH + t + HX NNLOPS , MC@NLO ggH a + HX MC@NLO ggH a CYRM-17-002 ) from γ γ → H ( SM σ syst unc. ⊕ Data, stat Systematic uncertainty | < 4.7 1,2 j η > 30 GeV, | 1,2 j T p CMS 35.9 fb-1 (13 TeV) γ γ → H | 2 j 1 ,j γ γ φ ∆ | 0 0.5 1 1.5 2 2.5 3 Ratio to prediction −2 1 −0 1 2 3
Figure 6: Measurement of the differential cross section (black points) as functions of pj2
T, |yj2|, |∆φj1,j2|, and|∆φγγ,j1j2|. The error bars indicate 1 standard deviation uncertainty. The
system-atic component of the uncertainty is shown by the blue band. The measurements are compared to two different simulation programs (histograms) with their uncertainties (hatched areas), both normalized to the same theoretical predictions from Ref. [13]. When the last bin of the distribution is an overflow bin, the normalization of the cross section in that bin is indicated in the figure.
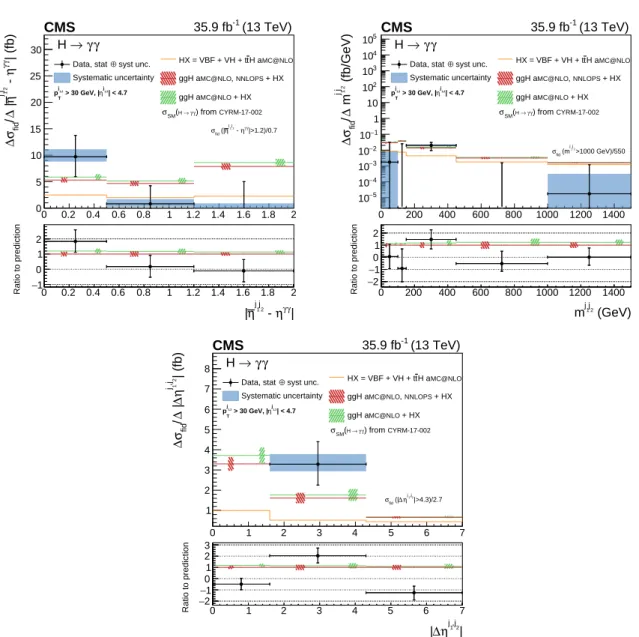
0 0.2 0.4 0.6 0.8 1 1.2 1.4 1.6 1.8 2 | (fb) γγ η - 2 j1 j η | ∆ / fid σ∆ 0 5 10 15 20 25 30 MC@NLO H a t HX = VBF + VH + t + HX NNLOPS , MC@NLO ggH a + HX MC@NLO ggH a CYRM-17-002 ) from γ γ → H ( SM σ syst unc. ⊕ Data, stat Systematic uncertainty |>1.2)/0.7 γ γ η - 2 j 1 j η (| fid σ | < 4.7 1,2 j η > 30 GeV, | 1,2 j T p CMS 35.9 fb-1 (13 TeV) γ γ → H | γ γ η - 2 j 1 j η | 0 0.2 0.4 0.6 0.8 1 1.2 1.4 1.6 1.8 2 Ratio to prediction −1 0 1 2 0 200 400 600 800 1000 1200 1400 (fb/GeV) 2 j1 j m ∆ / fid σ∆ 5 − 10 4 − 10 3 − 10 2 − 10 1 − 10 1 10 2 10 3 10 4 10 5 10 MC@NLO H a t HX = VBF + VH + t + HX NNLOPS , MC@NLO ggH a + HX MC@NLO ggH a CYRM-17-002 ) from γ γ → H ( SM σ syst unc. ⊕ Data, stat Systematic uncertainty >1000 GeV)/550 2 j 1 j (m fid σ | < 4.7 1,2 j η > 30 GeV, | 1,2 j T p CMS 35.9 fb-1 (13 TeV) γ γ → H (GeV) 2 j 1 j m 0 200 400 600 800 1000 1200 1400 Ratio to prediction 2 −−1 0 1 2 0 1 2 3 4 5 6 7 | (fb) 2 ,j1 j η∆ | ∆ / fid σ∆ 1 2 3 4 5 6 7 8 MC@NLO H a t HX = VBF + VH + t + HX NNLOPS , MC@NLO ggH a + HX MC@NLO ggH a CYRM-17-002 ) from γ γ → H ( SM σ syst unc. ⊕ Data, stat Systematic uncertainty |>4.3)/2.7 2 ,j 1 j η ∆ (| fid σ | < 4.7 1,2 j η > 30 GeV, | 1,2 j T p CMS -1 (13 TeV) 35.9 fb γ γ → H | 2 ,j 1 j η ∆ | 0 1 2 3 4 5 6 7 Ratio to prediction −2 1 −0 1 2 3
Figure 7: Measurement of the differential cross section (black points) as functions of |ηj
1j2 −
ηγγ|, mj1j2, and|∆ηj1,j2|. The error bars indicate 1 standard deviation uncertainty. The systematic component of the uncertainty is shown by the blue band. The measurements are compared to two different simulation programs (histograms) with their uncertainties (hatched areas), both normalized to the same theoretical predictions from Ref. [13]. When the last bin of the distri-bution is an overflow bin, the normalization of the cross section in that bin is indicated in the figure.
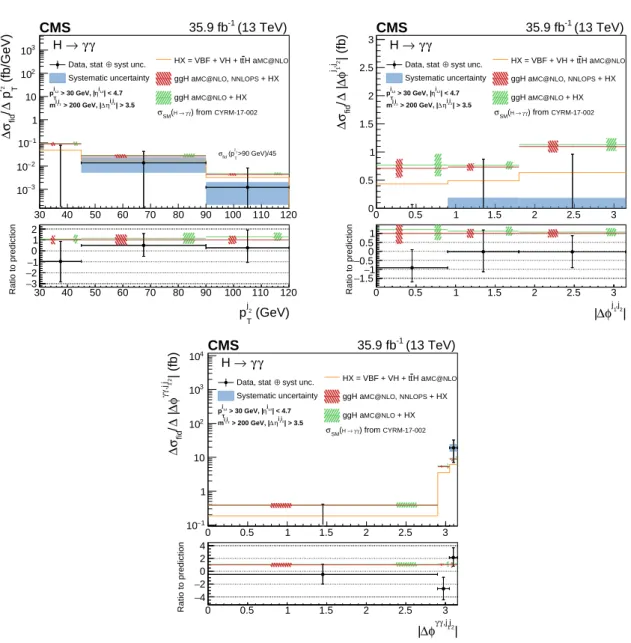
21 30 40 50 60 70 80 90 100 110 120 (fb/GeV) 2 j T p ∆ / fid σ∆ 3 − 10 2 − 10 1 − 10 1 10 2 10 3 10 MC@NLO H a t HX = VBF + VH + t + HX NNLOPS , MC@NLO ggH a + HX MC@NLO ggH a CYRM-17-002 ) from γ γ → H ( SM σ syst unc. ⊕ Data, stat Systematic uncertainty >90 GeV)/45 2 j T (p fid σ | < 4.7 1,2 j η > 30 GeV, | 1,2 j T p | > 3.5 2 j 1 j η ∆ > 200 GeV, | 2 j 1 j m CMS -1 (13 TeV) 35.9 fb γ γ → H (GeV) 2 j T p 30 40 50 60 70 80 90 100 110 120 Ratio to prediction −3 2 −−1 0 1 2 0 0.5 1 1.5 2 2.5 3 | (fb) 2 ,j1 j φ∆ | ∆ / fid σ∆ 0 0.5 1 1.5 2 2.5 3 MC@NLO H a t HX = VBF + VH + t + HX NNLOPS , MC@NLO ggH a + HX MC@NLO ggH a CYRM-17-002 ) from γ γ → H ( SM σ syst unc. ⊕ Data, stat Systematic uncertainty | < 4.7 1,2 j η > 30 GeV, | 1,2 j T p | > 3.5 2 j 1 j η ∆ > 200 GeV, | 2 j 1 j m CMS -1 (13 TeV) 35.9 fb γ γ → H | 2 ,j 1 j φ ∆ | 0 0.5 1 1.5 2 2.5 3 Ratio to prediction 1.5 −−1 0.5 − 0 0.51 0 0.5 1 1.5 2 2.5 3 | (fb) 2 j1 ,j γγ φ∆ | ∆ / fid σ∆ 1 − 10 1 10 2 10 3 10 4 10 MC@NLO H a t HX = VBF + VH + t + HX NNLOPS , MC@NLO ggH a + HX MC@NLO ggH a CYRM-17-002 ) from γ γ → H ( SM σ syst unc. ⊕ Data, stat Systematic uncertainty | < 4.7 1,2 j η > 30 GeV, | 1,2 j T p | > 3.5 2 j 1 j η ∆ > 200 GeV, | 2 j 1 j m CMS 35.9 fb-1 (13 TeV) γ γ → H | 2 j 1 ,j γ γ φ ∆ | 0 0.5 1 1.5 2 2.5 3 Ratio to prediction 4 − 2 −0 2 4
Figure 8: Measurement in a VBF-enriched region of the fiducial phase space of the differential
cross section (black points) as functions of pj2
T,|∆φj1,j2|, and|∆φγγ,j1j2|. The error bars indicate 1
standard deviation uncertainty. The systematic component of the uncertainty is shown by the blue band. The measurements are compared to two different simulation programs (histograms) with their uncertainties (hatched areas), both normalized to the same theoretical predictions from Ref. [13]. When the last bin of the distribution is an overflow bin, the normalization of the cross section in that bin is indicated in the figure.