Received 05/04/2020 Review began 05/13/2020 Review ended 05/15/2020 Published 05/23/2020 © Copyright 2020
Yurdaisik et al. This is an open access article distributed under the terms of the Creative Commons Attribution License CC-BY 4.0., which permits unrestricted use, distribution, and reproduction in any medium, provided the original author and source are credited.
Evaluation of Chest CT Findings in 50
Coronavirus Disease 2019 (COVID-19)
Patients Treated in Turkey
Isil Yurdaisik , Fuad Nurili
1. Radiology, Istinye University Gaziosmanpasa Medical Park Hospital, Istanbul, TUR 2. Radiology, Memorial Sloan Kettering Cancer Center, New York, USA
Corresponding author: Isil Yurdaisik, [email protected]
Abstract
Objectives
The objective of this study was to evaluate chest CT outcomes during the treatment of 50 coronavirus disease 2019 (COVID-19) patients treated in Turkey who presented with symptoms such as fever, cough, and dyspnea, and to analyze these results in line with the current
literature.
Methods
Patients’ demographic data such as age and gender, symptoms on admission, contact history, comorbidities, and PCR and CT outcomes were recorded and analyzed. In CT examinations, laterality, the presence of consolidation and/or ground-glass opacities (GGO), and central and/or peripheral distribution were analyzed. In addition, segmental analysis was performed with CT results.
Results
In CT scans, involvement was found at the right lung in 10 (20%) patients and left lung in 1 (2%) patient, whereas bilateral involvement was found in 39 (78%) patients. Peripheral distribution was found in 18 (36%) patients and central + peripheral distribution in 28 (56%) patients. Density of the lesions was GGO in 44 (88%), whereas consolidation + GGO was found in 6 (12%) patients. The mean number of involved segments was 6.92 ± 6.74 (min-max: 1-20). There was a significant correlation between the involvement of the R3 segment and fever (r = 0.288; p = 0.042).
Conclusions
Typical COVID-19 patterns on chest CT were GGO, bilateral involvement, peripheral, and central + peripheral distribution. Our results indicate that chest CT may be helpful in diagnosing the disease and monitoring its progression. However, since clinical pictures of COVID-19 may differ, CT outcomes should be carefully interpreted.
Categories: Radiology, Infectious Disease
Keywords: covid-19, infections, tomography, radiology, ct
Introduction
1 2
Open Access Original
A viral pneumonia of unknown cause emerged in Wuhan province of Hubei state in China at the end of December 2019. It has been later found that the source of this novel-type pneumonia was wild animals sold in a seafood market in Wuhan [1]. The outbreak started in China has increasingly spread all over the world, and today the numbers of cases and deaths are increasing globally. The novel coronavirus named as COVID-19 (coronavirus disease 2019) by the World Health Organization (WHO) was declared as a global pandemic on March 12, 2020 [2]. The rapid spread of the outbreak increased the importance of correct diagnostics methods that give rapid outcomes for the isolation and management of the cases. Patients infected by COVID-19 typically present with complaints of fever, dry cough, dyspnea, headache, sore throat, and muscle pain [3]. The reverse transcriptase polymerase chain reaction (RT-PCR) test, which is a nucleic acid test, remains the gold standard in the diagnosis of COVID-19 [4]. However, this test requires laboratory specifications and takes a long time. In addition, there is a probability of false-negative results with this test. Recent studies have reported a low sensitivity at 60-71% for RT-PCR test in the determination of COVID-19 [5-7]. Low sensitivity has been attributed to low viral load and laboratory errors [6]. False-negative results are unfavorable for the control of this infectious disease. Repeat tests may be required, leading to challenges in terms of the availability of test kits and related infrastructure.
Chest CT is an imaging modality commonly used in the diagnosis and progression monitoring in COVID-19. Sensitivity of initial CT imaging in the detection of the disease has been reported to be between 56 and 98% in the literature [6,7]. CT typically shows ground-glass opacities (GGO) and consolidation in multiple lobes [8]. The number of studies analyzing chest CT in COVID-19 patients is limited in the literature. Majority of the studies published on this issue have been reported from the Far East [8-10]. There is no consensus in the literature on the use of chest CT for the diagnosis of COVID-19.
The objective of this study was to evaluate chest CT outcomes in COVID-19 patients who presented with symptoms such as fever, cough, and dyspnea, and to analyze these results in line with the current literature.
Materials And Methods
This study was designed as retrospective and conducted in a single center in Istanbul, Turkey. Ethics approval was received from the Local Ethics Committee of our hospital. The study was performed in accordance with the ethical principles of the Declaration of Helsinki.
Study population
The study included 50 patients who presented to the emergency department of our pandemic hospital with the complaints of fever, cough, and dyspnea, and then referred to our clinic for radiological imaging between March 10, 2020, and March 20, 2020. Patients with the diagnosis of COVID-19 confirmed by RT-PCR who underwent chest CT imaging for one or more times and with CT outcomes indicating pneumonia were included. Patients with normal chest CT findings and those who underwent only chest X-ray were excluded from the study. Patients’ demographic data such as age and gender, symptoms on admission, contact history, comorbidities, and PCR and CT outcomes were recorded and analyzed. In CT examinations, laterality, the presence of consolidation and/or GGO, and central and/or peripheral distribution were analyzed. In addition, segmental analysis was performed with CT results.
CT imaging technique and interpretation of results
All CT scans were performed using a 128-slice multidetector CT scanner (Somatom Definition AS+, Siemens, Erlangen, Germany). CT parameters were as follows: slice thickness of 1.0 mm,
reconstruction interval of 1.0-3.0 mm, tube voltage of 120 kVp, and tube flow automatic exposure controlled standard flow. The scanning was performed with the patient in the supine position at the end of inspiration on the axial plane between the lung apex and the diaphragm. Radiology staff was provided to wear protective equipment during the scans.
In CT analysis, the presence of GGOs, consolidation and mixed pattern, laterality of the involvement, central or peripheral distribution or mixed pattern, segmentation, nodules, and pleural effusion were evaluated. GGO was defined as a hazy increase in the lung attenuation without opacity of the underlying vessels. GGO + consolidation was considered as an opacification area that obscured underlying vessels in GGOs. The outer one-third of the lung was accepted as peripheral and the remaining part as central.
CT results were examined by two independent radiologists with 25 and 8 years of experience, respectively. In the case of disagreement, the definitive decision was made with consensus. Patients with suspected COVID-19 were immediately reported to the relevant clinician.
Segmental analysis
Segments of the right and left lungs were analyzed according to the following distribution: Right 1 (R1): apical; right 2 (R2): posterior; right 3 (R3): anterior segments of the upper lobe; right 4 (R4): lateral; right 5 (R5): medial segments of the middle lobe; right 6 (R6): superior; right 7 (R7): medial basal; right 8 (R8): anterior basal; right 9 (R9): lateral basal; and right 10 (R10): posterior basal segments of the lower lobe. Left 1 (L1): apical; left 2 (L2): posterior; left 3 (L3): anterior; left 4 (L4): lingula-superior; left 5 (L5): lingula-inferior segments of the upper lung; left 6 (L6): superior; left 7 (L7): medial basal; left 8 (L8): anterior basal; left 9 (L9): lateral basal; and left 10 (L10): posterior basal segments of the lower lobe.
Statistical analysis
Data obtained in this study were analyzed using the Statistical Package for Social Sciences (SPSS) Version 22 (IBM Corp., Armonk, NY, USA). Normality of the variables was evaluated using the Kolmogorov-Smirnov test. Non-parametric tests were used for the non-normally distributed variables. Correlation between the nonparametric variables was evaluated using Spearman’s correlation. Quantitative variables were expressed as mean, standard deviation, median, and minimum and maximum descriptive values. Qualitative variables expressed given as frequency and percentage. p-Values < 0.05 were considered statistically significant.
Results
A total of 50 patients who presented to the emergency department of our hospital and referred to the radiology clinic and were diagnosed with COVID-19 confirmed by RT-PCR tests were included in the study. Of all patients, 35 (70%) were males and 15 (30%) were females. Patients aged between 20 and 79 years with a mean age of 53.84±16.07 years (median: 53.5 years). The mean age was found as 50.06 ± 15.07 years (min-max: 20-73 years) in male patients and 62.67 ± 15.34 years (min-max: 37-79 years) in female patients. When age ranges of the patients were examined, 4 (8%) were in the 20-30 age group, 8 (16%) in the 31-40 age group, 9 (18%) in the 41-50 age group, 5 (10%) in the 51-60 age group, 18 (36) in the 61-70 age group, and 6 (12%) in the 71-80 age group.
When symptoms on admission were examined, 4 (8%) patients were asymptomatic, whereas 5 (10%) had only fever, 1 (2%) had only dry cough, 10 (20%) had fever + cough, and 25 (50%) had fever and cough accompanied by dyspnea. No statistically significant correlation was found between age, and fever (r = 0.001; p = 0.996), cough (r = 0.182; p = 0.205), and dyspnea (r =
-0.073; p = 0.182).
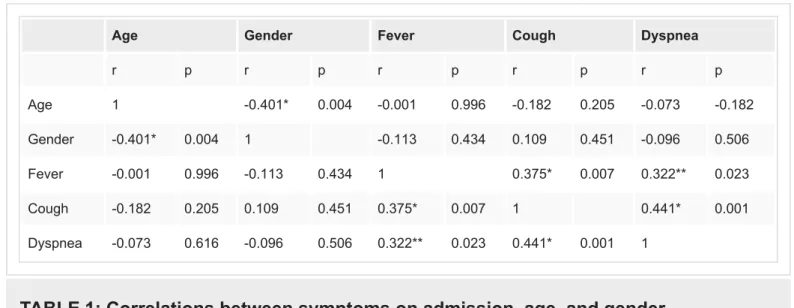
Of our patients, 29 (58%) were smokers. Comorbidities of the patients included obesity in 13 (26%), hypertension in 32 (64%), diabetes mellitus in 17 (34%), renal dysfunction in 9 (18%), cardiovascular disease in 20 (40%), COPD in 17 (34%), malignancy in 5 (10%), and tuberculosis in 12 (24%). While 9 (18%) patients had no comorbidity, 32 (64%) patients were found to have more than one comorbidity. The correlations between symptoms on admission, age, and gender variables are shown in Table 1. Of the patients, 25 (50%) had a history of abroad contact and 8 (16%) had family contact, whereas 17 (34%) did not remember the history.
Age Gender Fever Cough Dyspnea
r p r p r p r p r p Age 1 -0.401* 0.004 -0.001 0.996 -0.182 0.205 -0.073 -0.182 Gender -0.401* 0.004 1 -0.113 0.434 0.109 0.451 -0.096 0.506 Fever -0.001 0.996 -0.113 0.434 1 0.375* 0.007 0.322** 0.023 Cough -0.182 0.205 0.109 0.451 0.375* 0.007 1 0.441* 0.001 Dyspnea -0.073 0.616 -0.096 0.506 0.322** 0.023 0.441* 0.001 1
TABLE 1: Correlations between symptoms on admission, age, and gender
*p < 0.001; **p < 0.05.
Chest CT scans were performed on the first day of admission in all patients. In CT evaluation, the mean number of lesions was 13 ± 11.71 (min-max: 0-58). Involvement was found at the right lung in 10 (20%) patients and left lung in 1 (2%) patient, whereas bilateral involvement was found in 39 (78%) patients. When distribution of the involvement was examined, central distribution was found in 2 (4%) patients, peripheral distribution in 18 (36%) patients, and central + peripheral distribution in 28 (56%) patients. Density of the lesions was GGOs in 44 (88%) patients, whereas consolidation + GGO was found in 6 (12%) patients. Consolidation only was not observed in any patient. The other chest CT findings included nodule in seven (14%) patients and pleural effusion in eight (16%) patients.
The mean number of involved segments was 6.92 ± 6.74 (min-max: 1-20). Involvement was observed in all segments in 10 (20%) patients. When distribution of the involved segments was examined, the most commonly involved were the sixth segments in both the lobes, the rate of involvement was found to be 75% in the R6 segment, 72% in L6, 72% in R10, 68% IN L3, 68% IN L7, 66% IN R7, and 66% IN R8.
The rate of involvement in the R1 segment (30%) was nearly half of the rate in the L1 segment (56%). In addition, right and left lobe involvements were nearly parallel, and the rate of right basal involvement slightly increased toward the bases (72% in the R10 segment and 62% in the L10 segment).
In the case of the involvement of L1 and L2 segments, R7, R8, and R9 segments were also involved. The rates of involvement of the L3 segment with L4 (60%) and L5 (58%) segments and
the involvement of L6 segment with L7 (68%) and L8 (62%) segments were found to be high. It was found that in the case of the involvement of the L10 segment, almost all lobes at the left were also involved. Similarly, in the case of the involvement of the L6 segment, almost all other segments at the left were also involved.
No correlation was found between the segmental involvement, gender, and age. The distribution of segmental involvements according to the age groups is given in Table 2.
20-30 years 31-40 years 41-50 years 51-60 years 61-70 years 71-80 years
n = 4 8% n = 8 16% n = 9 18% n = 5 10% n = 18 36% n = 6 12% n % n % n % n % n % n % Left 1 1 25 2 25 8 88.89 4 80 9 50 4 66.67 2 1 25 3 37.5 9 100 4 80 9 50 4 66.67 3 1 25 3 37.5 9 100 5 100 12 66.67 4 66.67 4 1 25 2 25 6 66.67 4 80 12 66.67 5 83.33 5 1 25 2 25 6 66.67 4 80 11 61.11 5 83.33 6 2 50 3 37.5 8 88.89 3 60 15 83.33 5 83.33 7 1 25 2 25 9 100 4 80 13 72.2 5 83.33 8 1 25 2 25 7 77.78 4 80 12 66.67 5 83.33 9 2 50 1 12.5 8 88.89 3 60 11 61.11 4 66.67 10 2 50 3 37.5 7 77.78 3 60 12 66.67 4 66.67 Right 1 0 0 1 12.5 1 11.11 3 60 7 38.89 3 50 2 0 0 4 50 7 77.78 4 80 12 66.67 4 66.67 3 0 0 2 25 7 77.78 2 40 11 61.11 3 50 4 0 0 1 12.5 7 77.78 3 60 15 83.33 4 66.67 5 0 0 1 12.5 5 55.56 3 60 14 77.78 4 66.67 6 2 50 2 25 8 88.89 5 100 16 88.89 5 83.33 7 1 25 1 12.5 7 77.78 4 80 16 88.89 4 66.67 8 1 25 1 12.5 7 77.78 4 80 16 88.89 4 66.67 9 0 0 2 25 7 77.78 4 80 15 83.33 4 66.67 10 2 50 5 62.5 6 66.67 5 100 14 77.78 4 66.67
TABLE 2: Distribution of segmental involvements according to the age groups
Right: 1, apical; 2, posterior; 3, anterior segments of the upper lobe; 4, lateral; 5 medial segments of the middle lobe; 6, superior; 7, medial basal; 8, anterior basal; 9, lateral basal; 10, posterior basal segments of the lower lobe.
Left: 1, apical; 2, posterior; 3, anterior; 4, lingula-superior; 5, lingula-inferior segments of the upper lobe; 6, superior; 7, medial basal; 8, anterior basal; 9, lateral basal; 10, posterior basal segments of the lower lobe.
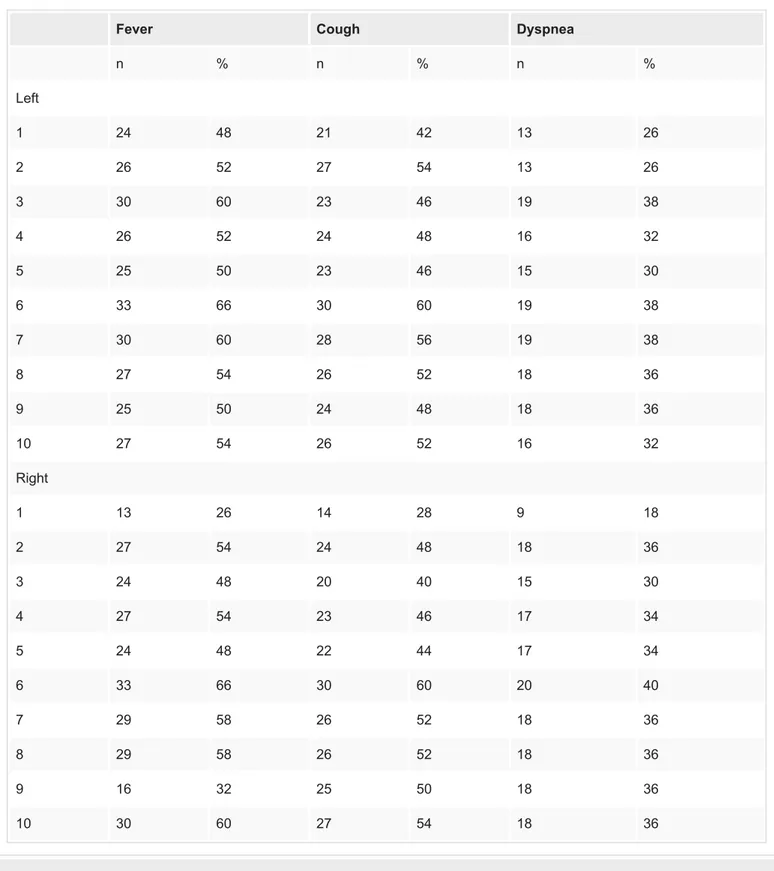
In the statistical analysis of segmental involvement and symptoms on admission, there was a significant correlation between the involvement of the R3 segment and fever (r = 0.288; p = 0.042). The rate of fever was high in patients with the involvement of R6, L6, and R10
segments. However, the difference was not statistically significant (p > 0.05). The rate of cough increased in the case of the involvement of R6 and L6 segments. The distribution of admission symptoms according to the involved segments is shown in Table 3.
Fever Cough Dyspnea n % n % n % Left 1 24 48 21 42 13 26 2 26 52 27 54 13 26 3 30 60 23 46 19 38 4 26 52 24 48 16 32 5 25 50 23 46 15 30 6 33 66 30 60 19 38 7 30 60 28 56 19 38 8 27 54 26 52 18 36 9 25 50 24 48 18 36 10 27 54 26 52 16 32 Right 1 13 26 14 28 9 18 2 27 54 24 48 18 36 3 24 48 20 40 15 30 4 27 54 23 46 17 34 5 24 48 22 44 17 34 6 33 66 30 60 20 40 7 29 58 26 52 18 36 8 29 58 26 52 18 36 9 16 32 25 50 18 36 10 30 60 27 54 18 36
TABLE 3: Distribution of admission symptoms according to the involved segments
Right: 1, apical; 2, posterior; 3, anterior segments of the upper lobe; 4, lateral; 5, medial segments of the middle lobe; 6, superior; 7, medial basal; 8, anterior basal; 9, lateral basal; 10, posterior basal segments of the lower lobe.
Left, 1, apical; 2, posterior; 3, anterior; 4, lingula-superior; 5, lingula-inferior segments of the upper lobe; 6, superior; 7, medial basal; 8, anterior basal; 9, lateral basal; 10, posterior basal segments of the lower lobe.
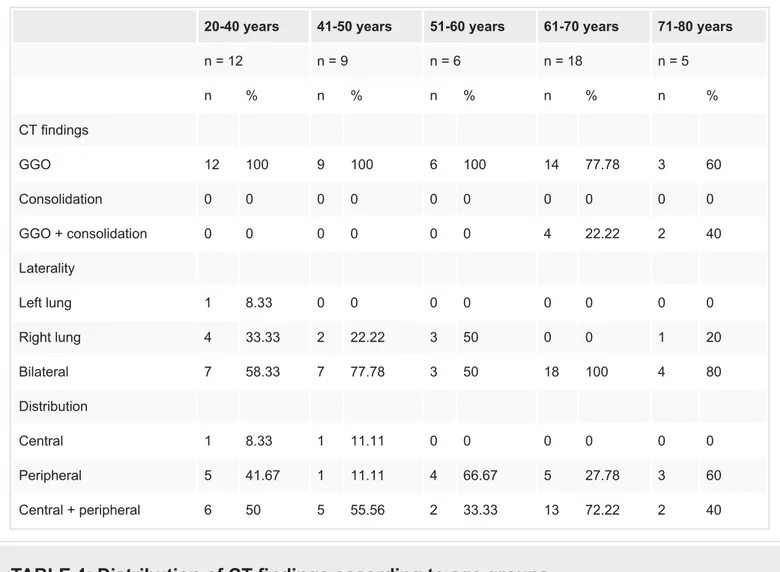
Two patients (4%) died in the hospital. Ten patients (20%) are currently followed in the intensive care units, whereas 11 (22%) patients are followed up in the other services of the hospital. Of all patients, 32 (64%) were discharged upon clinical and laboratory improvement. The distribution of chest CT findings according to the age groups is shown in Table 4.
20-40 years 41-50 years 51-60 years 61-70 years 71-80 years
n = 12 n = 9 n = 6 n = 18 n = 5 n % n % n % n % n % CT findings GGO 12 100 9 100 6 100 14 77.78 3 60 Consolidation 0 0 0 0 0 0 0 0 0 0 GGO + consolidation 0 0 0 0 0 0 4 22.22 2 40 Laterality Left lung 1 8.33 0 0 0 0 0 0 0 0 Right lung 4 33.33 2 22.22 3 50 0 0 1 20 Bilateral 7 58.33 7 77.78 3 50 18 100 4 80 Distribution Central 1 8.33 1 11.11 0 0 0 0 0 0 Peripheral 5 41.67 1 11.11 4 66.67 5 27.78 3 60 Central + peripheral 6 50 5 55.56 2 33.33 13 72.22 2 40
TABLE 4: Distribution of CT findings according to age groups
GGO, ground-glass opacities
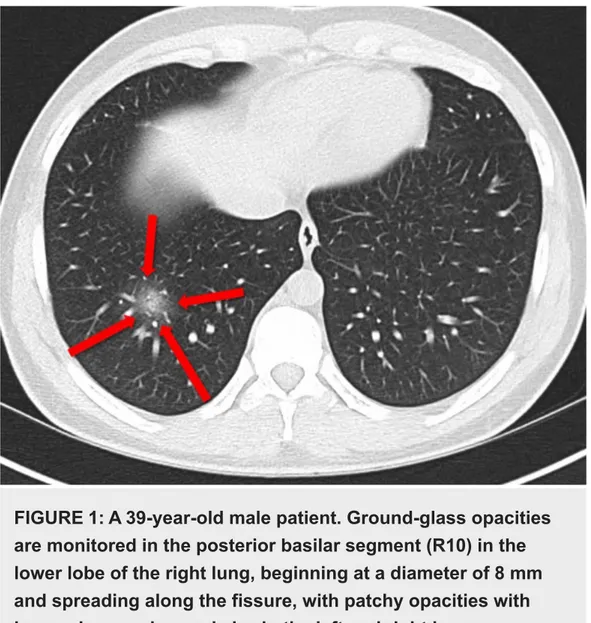
FIGURE 1: A 39-year-old male patient. Ground-glass opacities
are monitored in the posterior basilar segment (R10) in the
lower lobe of the right lung, beginning at a diameter of 8 mm
and spreading along the fissure, with patchy opacities with
increasing number and size in the left and right lower
hemithoraces.
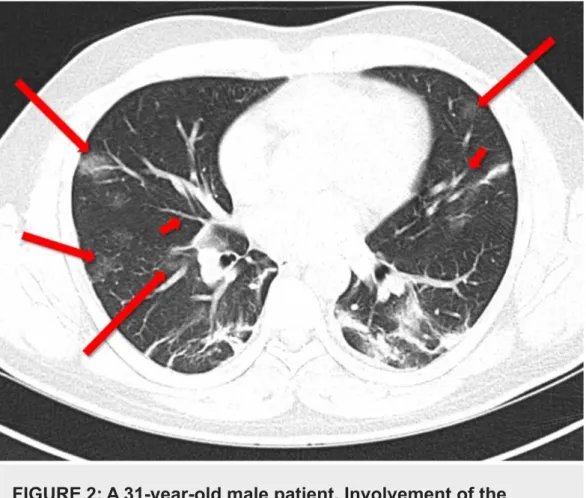
FIGURE 2: A 31-year-old male patient. Involvement of the
bilateral sixth segments, L4 and R4. Note both central and
peripheral distribution of ground-glass opacities (long arrows).
Peripheral focal infiltrative areas, marked bilateral
peribronchial thickening, and bronchiectasis are observed on
the bilateral side (short arrows).
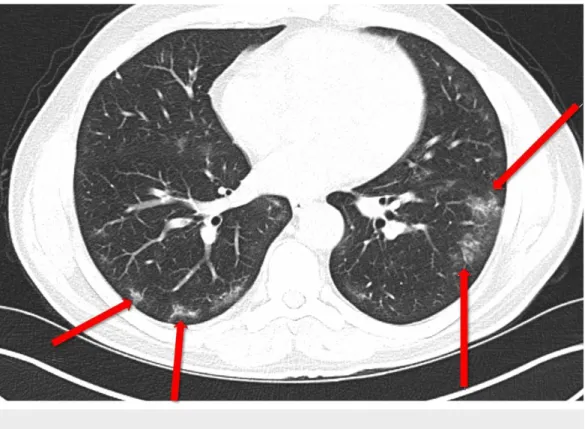
FIGURE 3: A 62-year-old female patient. Peripheral localized
bilateral ground-glass opacities are more commonly observed
on the left side.
Discussion
It is still not known when COVID-19, which is a rapidly spread pandemic, will peak and begin to decrease. So far, there is no drug or vaccination to treat this disease. Given the high spread rate of this pandemic, the importance of diagnostic methods that give rapid outcomes increases in terms of social isolation. Today, there are mainly two methods for the diagnosis of COVID-19: RT-PCR, which is a nucleic acid test, and chest CT imaging. The number of studies on this issue in the literature is limited, and these studies have reported different sensitivity and specificity rates for these methods [6,11,12].
According to the Centers for Disease Prevention and Control, RT-PCR remains the standard diagnostic method for COVID-19 [13]. One the other hand, chest CT scans are commonly used to aid the diagnosis. Although COVID-19 emerged later in Turkey, it is still continuing to spread in Turkey and worldwide.
In our study, we performed an analysis to contribute to the data in the literature on the use of chest CT in the diagnosis of COVID-19.
The Centers for Disease Prevention and Control reports the most common symptoms in COVID-19 as fever, cough, and dyspnea [14]. In our study, symptoms on admissions were found to be fever (82%), cough (74%), and dyspnea (54%). In a study by Song et al. conducted in Wuhan in 51 patients, the most common symptoms were fever (96%) and cough (47%) [15]. In another study by Bai et al. of COVID-19 patients, the rate of patients with fever was reported as 65% [16]. In a study by Li et al. of 51 patients, the most common symptoms on admission was fever (90.2%) followed by cough (2%) [4]. The differences between the studies may be due to the sociocultural and geographic differences.
In our study, the patients aged between 20 and 79 years, although most commonly the patients were in the age group of 61-70 years (36%). The mean age of the patients was 53.84 years. In a study by Wang et al., the mean age of COVID-19 patients was reported as 56 years [17].
In our study, CT scans showed a bilateral involvement in the majority (78%) of the patients. In a study by Caruso et al. from Italy, bilateral distribution was found in 53 (91%) of 58 patients [11]. When other studies in the literature were reviewed, the rate of bilateral involvement was reported as 86% by Song et al., 75% by Bai et al., and 76% by Kanne [7,15,16]. In our study, peripheral distribution was observed in 36% and peripheral + central distribution in 56%. In a study by Zhao et al., the distribution was reported as peripheral in 87.1% of the patients [18]. In a study by Yoon et al. from Korea, peripheral distribution was found in 60% of the patients and central + peripheral distribution in 20% of the patients [19]. In our study, the most typical CT findings included GGO (88%) and consolidation + GGO appearance (12%). Song et al. reported GGO as 77%, consolidation as 55%, and consolidation + GGO as 59% [15]. In a study by Long et al. of 36 patients, GGO was found in 30.6%, consolidation in 16.7%, and consolidation + GGO in 52.7% of the patients [12]. In a systematic review by Salehi et al., 30 studies were reviewed and GGO was found in 88% and consolidation in 31.8% [20].
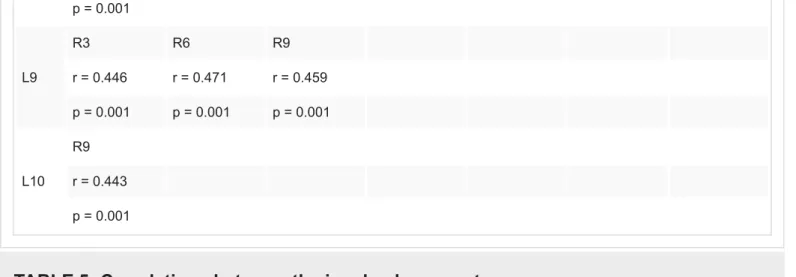
In our study, segmental analysis of chest CT findings was conducted. The most commonly involved lung segments were R6 (76%) and L6 (72%). In the case of the involvement of both R6 and L6 segments, the rate of patients with cough increased. The rate of patients with fever was high in the case of the involvement of R6, L6, and R10 segments, although the difference was not statistically significant. In the case of the involvement of the L6 segment, almost all other left segments were also involved. There were correlations between the involvements of some segments. No significant difference was found between segmental involvement, age, and gender. The involved lung segments with the highest correlations are given in Table 5. There was almost a symmetrical distribution among the segments, and it was observed that the involvement spread to the adjacent lobe without completion of the segmental distribution in a lobe. L2 L3 L4 L5 L7 R7 R8 R1 r = 0.445 r = 0.449 r = 0.445 r = 0.469 r = 0.449 r = 0.470 r = 0.470 p = 0.001 p = 0.001 p = 0.001 p = 0.001 p = 0.001 p = 0.001 p = 0.001 R2 L1 L2 r = 0.468 r = 0.454 p = 0.001 p = 0.001 R3 L9 R6 R7 R8 r = 0.446 r = 0.468 r = 0.464 r = 0.464 p = 0.001 p = 0.001 p = 0.001 p = 0.001 R6 L1 L9 R3 r = 0.445 r = 0.471 r = 0.468 p = 0.001 p = 0.001 p = 0.001 L2 R1 R3
R7 r = 0.448 r = 0.470 r = 0.464 p = 0.001 p = 0.001 p = 0.001 R8 L2 R1 R3 r = 0.448 r = 0.470 r = 0.464 p = 0.001 p = 0.001 p = 0.001 R9 L3 L6 L8 L9 L10 r = 0.468 r = 0.460 r = 0.443 r = 0.459 r = 0.443 p = 0.001 p = 0.001 p = 0.001 p = 0.001 p = 0.001 L1 L5 R2 R6 r = 0.470 r = 0.468 r = 0.445 p = 0.001 p = 0.001 p = 0.001 L2 L5 R1 R2 R7 R8 r = 0.463 r = 0.445 r = 0.454 r = 0.448 r = 0.448 p = 0.001 p = 0.001 p = 0.001 p = 0.001 p = 0.001 L3 L5 R1 R9 r = 0.459 r = 0.449 r = 0.468 p = 0.001 p = 0.001 p = 0.001 L4 R1 r = 0.445 p = 0.001 L5 L1 L2 L3 R1 r = 0.470 r = 0.463 r = 0.459 r = 0.469 p = 0.001 p = 0.001 p = 0.001 p = 0.001 L6 R9 r = 0.460 p = 0.001 L7 R1 r = 0.449 p = 0.001 L8 R9 r = 0.443
p = 0.001 L9 R3 R6 R9 r = 0.446 r = 0.471 r = 0.459 p = 0.001 p = 0.001 p = 0.001 L10 R9 r = 0.443 p = 0.001
TABLE 5: Correlations between the involved segments
Study limitations
Main limitations of this study include its retrospective design and the relatively small number of patients. In addition, patients could not be grouped according to the severity of the disease. However, there is still no published and internationally recognized guideline on this issue. The limited number of studies in the literature strengthens our study.
Conclusions
In this study, we found that typical COVID-19 patterns on chest CT were GGO, bilateral involvement, peripheral, and central + peripheral distribution. Our results indicate that chest CT may be helpful in diagnosing the disease and monitoring its progression. However, since clinical pictures of COVID-19 may differ, CT outcomes should be carefully interpreted. As the number of studies on this issue in the literature increase, the use of CT in COVID-19 will be further clarified.
Additional Information
Disclosures
Human subjects: Consent was obtained by all participants in this study. Local Ethics
Committee of our hospital issued approval 2/2020.K-024. Ethics approval was received from the Local Ethics Committee of our hospital (Date:25/03/2020, No:2/2020.K-024). . Animal
subjects: All authors have confirmed that this study did not involve animal subjects or tissue. Conflicts of interest: In compliance with the ICMJE uniform disclosure form, all authors
declare the following: Payment/services info: All authors have declared that no financial support was received from any organization for the submitted work. Financial relationships: All authors have declared that they have no financial relationships at present or within the previous three years with any organizations that might have an interest in the submitted work.
Other relationships: All authors have declared that there are no other relationships or
activities that could appear to have influenced the submitted work.
References
1. Wuhan Municipal Health Commission announces pneumonia epidemic . (2020). Accessed: March 27, 2020: https://crofsblogs.typepad.com/h5n1/2019/12/wuhan-municipal-health-commission-announces-pneumonia-epidemic.html.
https://www.who.int/docs/default-source/coronaviruse/situation-reports/20200312-sitrep-52-covid-19.pdf?sfvrsn=e2bfc9c0_4.
3. Liu KC, Xu P Lv WF, Qiu XH, Yao JL, Gu JF, Wei W: CT manifestations of coronavirus disease-2019: a retrospective analysis of 73 cases by disease severity. Eur J Radiol. 2020, 126:108941. 10.1016/j.ejrad.2020.108941
4. Li G, Fan Y, Lai Y: Coronavirus infections and immune responses . J Med Virol. 2020, 92:424-432. 10.1002/jmv.25685
5. Ai T, Yang Z, Hou H, et al.: Correlation of chest CT and RT-PCR testing in coronavirus disease 2019 (COVID-19) in China: a report of 1014 cases [Online ahead of print]. Radiology. 2020, 10.1148/radiol.2020200642
6. Fang Y, Zhang H, Xie J, Lin M, Ying L, Pang P, Ji W: Sensitivity of chest CT for COVID-19: comparison to RT-PCR [Online ahead of print]. Radiology. 2020, 10.1148/radiol.2020200432 7. Kanne JP: Chest CT findings in 2019 novel coronavirus (2019-nCoV) infections from Wuhan, China: key points for the radiologist. Radiology. 2020, 295:16-17. 10.1148/radiol.2020200241 8. Chung M, Bernheim A, Mei X, et al.: CT imaging features of 2019 novel coronavirus
(2019-nCoV). Radiology. 2020, 295:202-207. 10.1148/radiol.2020200230
9. Huang C, Wang Y, Li X, et al.: Clinical features of patients infected with 2019 novel coronavirus in Wuhan, China. Lancet. 2020, 395:497-506. 10.1016/S0140-6736(20)30183-5 10. Lei J, Li J, Li X1, Qi X: CT imaging of the 2019 novel coronavirus (2019-nCoV) pneumonia .
Radiology. 2020, 295:18. 10.1148/radiol.2020200236
11. Caruso D, Zerunian M, Polici M, et al.: Chest CT features of COVID-19 in Rome, Italy . Radiology. 2020, 3:201237. 10.1148/radiol.2020201237
12. Long C, Xu H,Shen Q, et al.: Diagnosis of the coronavirus disease (COVID- 19): rRT-PCR or CT?. Eur J Radiol. 2020, 25:108961. 10.1016/j.ejrad.2020.108961
13. Interim guidelines for collecting, handling, and testing clinical specimens for COVID-19 . (2020). Accessed: May 23, 2020: https://www.cdc.gov/coronavirus/2019-ncov/lab/guidelines-clinical-specimens.html.
14. Symptoms of coronavirus . (2020). Accessed: May 23, 2020:
https://www.cdc.gov/coronavirus/2019-ncov/symptoms-testing/symptoms.html. 15. Song F, Shi N, Shan F, et al.: Emerging 2019 novel coronavirus (2019-nCoV) pneumonia .
Radiology. 2020, 295:210-217. 10.1148/radiol.2020200274
16. Bai HX, Hsieh B, Xiong Z, et al.: Performance of radiologists in differentiating COVID-19 from viral pneumonia on chest CT [Online ahead of print]. Radiology. 2020,
10.1148/radiol.2020200823
17. Wang D, Hu B, Hu C, et al.: Clinical characteristics of 138 hospitalized patients with 2019 novel coronavirus-infected pneumonia in Wuhan, China. JAMA. 2020, 323:1061-1069. 10.1001/jama.2020.1585
18. Zhao W, Zhong Z, Xie X, Yu Q, Liu J: CT scans of patients with 2019 novel coronavirus (COVID-19) pneumonia. Theranostics. 2020, 19:4606-4613. 10.7150/thno.45016 19. Yoon SH, Lee KH, Kim JY, et al.: Chest radiographic and CT findings of the 2019 novel
coronavirus disease (COVID- 19): analysis of nine patients treated in Korea. Korean J Radiol. 2020, 21:494-500. 10.3348/kjr.2020.0132
20. Salehi S, Abedi A, Balakrishnan S, Gholamrezanezhad A: Coronavirus disease 2019 (COVID-19): a systematic review of imaging findings in 919 patients. AJR Am J Roentgenol. 2020, 14:1-7. 10.2214/AJR.20.23034