ECONOMY SLOWING DOWN, CURRENT ACCOUNT
RECOVERING
Zümrüt İmamoğlu* ve Barış Soybilgen
†Executive Summary
Following this month’s data releases, Betam’s economic indicators for the first quarter are now complete. The Industrial Production Index (IPI) in the first quarter decreased by 1.5 percent, import volume index and export volume index increased by 0.9 percent and 3.4 percent, respectively. The faster increase in exports compared to imports is good news both in terms of GDP growth and the current account deficit. However, our indicators still show that domestic demand is slowing down. There is no change in our annual and quarterly forecast from last month. Betam’s quarter on quarter (QoQ) growth forecast for the first quarter of 2012 is 0.3 percent. We estimate the corresponding year on year (YoY) growth rate to be 3.5 percent.
Following the slow down in domestic demand the current account deficit continues to shrink. In March, the trade deficit fell to $7.4 billion from $9.8 billion and the current account deficit fell to $6.1 billion from $9.6 billion. At the end of the first quarter, the 12-month current account deficit * Dr. Zümrüt İmamoğlu, Betam, Research Associate.
[email protected] † Barış Soybilgen, Betam, Research Assistant, [email protected]
Table 1. Betam’s quarterly and annual growth rate forecasts
O
Source: Betam
*sa: seasonally and calendar day adjusted **ca: calendar day adjusted
amounted to $71.8 billion. We estimate that the ratio of current account deficit to GDP has fallen down to 9.3 percent in at the end of the first quarter from 9.9 percent in the last quarter of 2011.
Contribution of net exports will be key in first quarter growth
After March data release, outlook of Turkish economy became a bit clearer. Turkish economy, growing at astonishingly high rates for last two years, is slowing down, mainly due to the slow down in domestic demand. Real GDP growth rate
2012 1. Quarter
Forecast Real GDP growth, %
(quarter on quarter, sa*) 0,3
Real GDP growth, %
(year on year, ca**) 3,5
Current account deficit
(% of GDP, annual) 9,3
Economic Outlook and Forecasts:
May 2012
in 2012 will mainly be determined by the extent of contribution of net exports. The good news is exports increased more than imports in the first quarter, implying positive contribution to growth and a decrease in the current account deficit. To reach a sustainable current account deficit rate and an annual real GDP growth rate of 4 percent by the end of 2012, net exports should continue contributing to growth in the coming quarters as well. It will be hard for Turkey to achieve soft landing in the economy if European recession deepens and demand for Turkish exports decrease.
Our indicators show that the slowdown in domestic demand in the first quarter is consumption driven. Consumer goods imports have been decreasing for three consecutive months and there is a large decline in non-commercial automobile production (8.3 percent). Investment demand on the other hand looks moderate. Intermediate goods imports increased and investment goods imports peeked in March.
The slow down in the economy is adversely affecting government revenues and the fiscal stance. In the first quarter, inflation adjusted Special Consumption Tax (SCT) revenue decreased by 5.2 percent. The decline in tax revenue will adversely affect the budget deficit in 2012, but trying to offset it by taking austerity measures would adversely affect the GDP growth and hence should be avoided. On the other hand, mild recession in Europe and expected slowdown in China is leading to lower oil prices, which make life easier for the Central Bank, as it is trying to lower the inflation rate without interrupting the outlook for growth.
Private consumption expenditure is on the decline
In the first quarter of 2012, Betam’s indicators that are used to forecast private consumption expenditure declined compared to the last quarter. Consumer goods imports, nondurable goods manufacturing and durable goods manufacturing decreased by 5.1 percent, 0.5 percent and 2.9 percent, respectively. SCT income decreased by 5.2 percent in the first quarter of 2012 because of the decline in consumer goods manufacturing and imports. Turkstat Consumer Confidence Index increased by 1.3 percent. We expect a small decline in consumption demand in the first quarter compared to last quarter.
Surge in investment goods imports
Investment goods imports surged in March, increasing by 10 percent. With this increase, the rise in investment goods imports reached 7.7 percent on a quarterly basis. However, investment goods manufacturing decreased by 5 percent.
In March, non-commercial automobile production experienced a great decline (10.2 percent). This decline also affected the quarterly numbers. Non-commercial automobile production decreased by 8.3 percent in the first quarter compared to the last quarter. Moreover, IPI fell by 1.5 percent and real sector confidence index decreased by 0.1 percent in the first quarter.
Despite the fall in IPI, our expectation for private investment expenditure in the first quarter is that it might increase slightly.
Exports increased more than imports in the first quarter
Figure 2 shows monthly changes of seasonally adjusted import and export volume indices. In March, export volume index increased by 1.1 percent and import volume index increased by 3.2 percent. Most of the increase in imports was caused by the increase in imports of investment goods and in part by the increase in imports of intermediate goods. Quarterly data showed that in the first quarter export volume index increased by 3.4 percent significantly more than the increase in import volume index of 0.9 percent. First quarter trade statistics show that Turkey’s exports to EU are stagnant and might get worse if the recession in Europe deepens.
Current account deficit decreased in the first quarter
In March, compared to same month of previous year, there is a significant fall in trade account deficit. It decreased from $9.8 billion to $7.4 billion. Current account deficit was $6.1 billion in March, a reduction of about $2.5 billion compared to the same month of the previous year. The
12-month current account deficit fell from $77.2 billion to $71.8 billion in the first quarter from the last quarter of the previous year. The decline in the current account deficit was mainly caused by the slowdown in imports. We expect that as domestic consumption slows down, current account deficit will fall. However, if investment and intermediate goods continue to increase, as in March, and adverse effects of stagnation in Europe continue to limit the increase in exports, the decline in current account deficit might stall. In April exports declined compared to the same month of the last year, hence we could see an increase in the current account deficit for April when data is released next month.
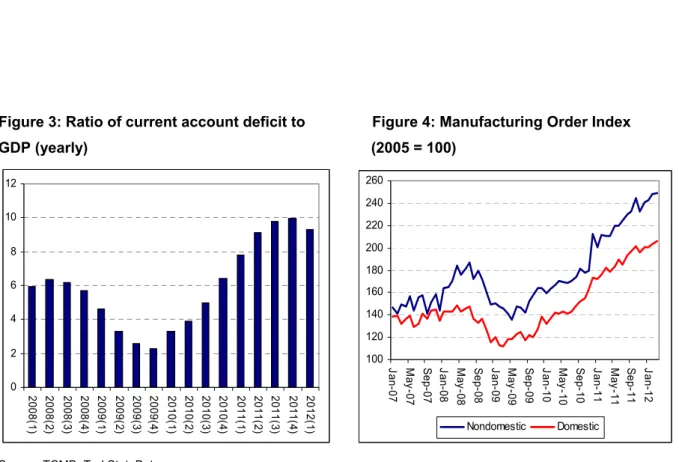
We forecast the current account to GDP ratio at the end of the first quarter to fall down to 9.3 percent from 9.9 percent at the end of 2011. (Figure 3).
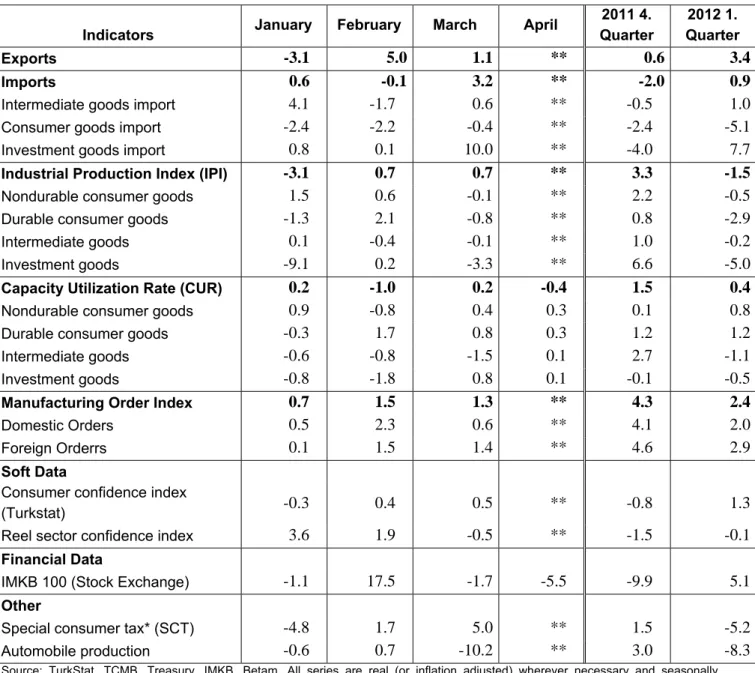
Table 2. Monthly and quarterly changes of Betam’s selected indicators (real and sa)
Indicators January February March April
2011 4. Quarter 2012 1. Quarter Exports -3.1 5.0 1.1 ** 0.6 3.4 Imports 0.6 -0.1 3.2 ** -2.0 0.9
Intermediate goods import 4.1 -1.7 0.6 ** -0.5 1.0
Consumer goods import -2.4 -2.2 -0.4 ** -2.4 -5.1
Investment goods import 0.8 0.1 10.0 ** -4.0 7.7
Industrial Production Index (IPI) -3.1 0.7 0.7 ** 3.3 -1.5
Nondurable consumer goods 1.5 0.6 -0.1 ** 2.2 -0.5
Durable consumer goods -1.3 2.1 -0.8 ** 0.8 -2.9
Intermediate goods 0.1 -0.4 -0.1 ** 1.0 -0.2
Investment goods -9.1 0.2 -3.3 ** 6.6 -5.0
Capacity Utilization Rate (CUR) 0.2 -1.0 0.2 -0.4 1.5 0.4
Nondurable consumer goods 0.9 -0.8 0.4 0.3 0.1 0.8
Durable consumer goods -0.3 1.7 0.8 0.3 1.2 1.2
Intermediate goods -0.6 -0.8 -1.5 0.1 2.7 -1.1
Investment goods -0.8 -1.8 0.8 0.1 -0.1 -0.5
Manufacturing Order Index 0.7 1.5 1.3 ** 4.3 2.4
Domestic Orders 0.5 2.3 0.6 ** 4.1 2.0
Foreign Orderrs 0.1 1.5 1.4 ** 4.6 2.9
Soft Data
Consumer confidence index
(Turkstat) -0.3 0.4 0.5 ** -0.8 1.3
Reel sector confidence index 3.6 1.9 -0.5 ** -1.5 -0.1
Financial Data
IMKB 100 (Stock Exchange) -1.1 17.5 -1.7 -5.5 -9.9 5.1
Other
Special consumer tax* (SCT) -4.8 1.7 5.0 ** 1.5 -5.2
Automobile production -0.6 0.7 -10.2 ** 3.0 -8.3
Source: TurkStat. TCMB. Treasury. IMKB. Betam. All series are real (or inflation adjusted) wherever necessary and seasonally adjusted.
*This tax is collected on sales of goods such as gas. fuel oils. alcohol. tobacco products and automobiles. **Data not yet released
Figure 1: Capacity utilization rate and industrial production index (sa. left axis for CUR and right axis for IPI)
60 65 70 75 80 85 Ja n-07 May -07 Se p-07 Ja n-08 May -08 Se p-08 Ja n-09 May -09 Se p-09 Ja n-10 May -10 Se p-10 Ja n-11 May -11 Se p-11 Ja n-12 95 100 105 110 115 120 125 130 135 CUR IPI
Source : TurkStat. Betam
Figure 2: Volume indices of exports and imports (sa) 120.00 130.00 140.00 150.00 160.00 170.00 180.00 190.00 200.00 210.00 Jan-07 May -07 S ep-07 Jan-08 May -08 S ep-08 Jan-09 May -09 S ep-09 Jan-10 May -10 S ep-10 Jan-11 May -11 S ep-11 Jan-12 Export Import
Source : TurkStat. Betam
Figure 3: Ratio of current account deficit to Figure 4: Manufacturing Order Index GDP (yearly) (2005 = 100)
Source: TCMB. TurkStat. Betam * Betam’s forecasts 0 2 4 6 8 10 12 2008( 1) 2008( 2) 2008( 3) 2008( 4) 2009( 1) 2009( 2) 2009( 3) 2009( 4) 2010( 1) 2010( 2) 2010( 3) 2010( 4) 2011( 1) 2011( 2) 2011( 3) 2011( 4) 2012( 1) 100 120 140 160 180 200 220 240 260 Jan-07 Ma y-07 S ep-07 Jan-08 Ma y-08 S ep-08 Jan-09 Ma y-09 S ep-09 Jan-10 Ma y-10 S ep-10 Jan-11 Ma y-11 S ep-11 Jan-12 Nondomestic Domestic
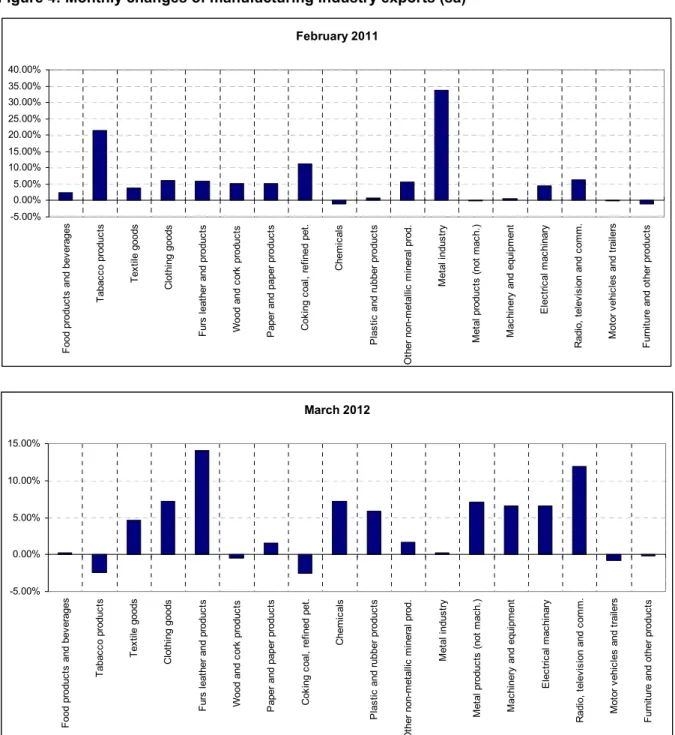
Figure 4: Monthly changes of manufacturing industry exports (sa)
Source: TurkStat. Betam
March 2012 -5.00% 0.00% 5.00% 10.00% 15.00% F ood pr oduc ts and bev erages T abac co produc ts T ex til e goods C lot hi ng goods F urs leat her and pr oduc ts Wood and co rk produc ts P aper and paper pr oduc ts C ok ing c oal , ref ine d pet . C hem ic al s P las tic and r ubber pro duc ts O ther non-m et allic m in er al p ro d. M et al indus tr y M et al produc ts (not m ac h. ) M ac hi nery and e qui pm ent E lec tr ic al m ac hi nary R adi o, t el ev is ion and c om m . M ot or v ehi cl es and t rai le rs F urni tur e and ot her pr oduc ts February 2011 -5.00% 0.00% 5.00% 10.00% 15.00% 20.00% 25.00% 30.00% 35.00% 40.00% F ood produc ts and bev erages T abac co produc ts T ex til e goods C lot hi ng goods F urs leat her and produc ts Wood and c or k produc ts P aper and paper produc ts C ok ing c oal , r ef ined pet . C hem ic al s P las tic
and rubber produc
ts O ther non-m et al lic m iner al prod. M et al indus tr y M et al pr oduc ts ( not m ac h. ) M ac hi nery an d equi pm ent E lec tr ic al m ac hi nary R adi o, t el ev is ion and c om m . M ot or v ehi cl es and t rai le rs F ur ni ture and ot her produc ts