NON-AGRICULTURAL EMPLOYMENT STAGNATES
Seyfettin Gürsel
*Gökçe Uysal
and Ayşenur Acar
Abstract
Seasonally adjusted labor market data shows that non-agricultural unemployment rate increased by 0.1 percentage
point and reached 11.1 percent in the period of April 2014 compared to the period of March 2014. According to
predictions based on the seasonally adjusted application per vacancy statistics calculated using Kariyer.net,
non-agricultural unemployment will increase in the period of May 2014.
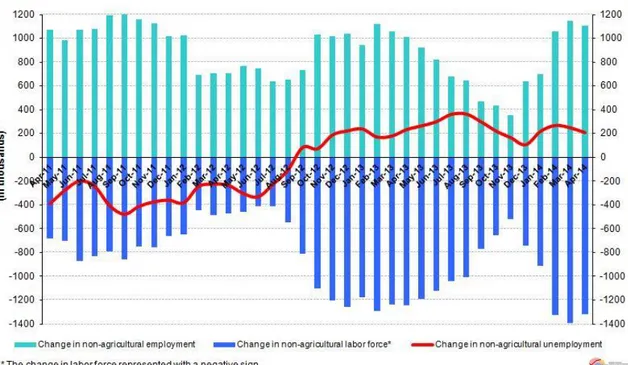
Stagnation in both non-agricultural labor force and employment
According to the data released by TurkSTAT, non-agricultural labor force increased by 1 million 315 thousand (6
percent) and non-agricultural employment increased by 1 million 108 thousand (5.7 percent) in the period of April
2014 (Figure 1). Consequently, the number of persons unemployed in non-agricultural sectors increased by 207
thousand. However, we believe that the revisions in labor market series are the culprit behind these increases.
Annual increases in non-agricultural labor force and employment have been stagnating for the last 3 periods
(Figure 1).
Figure 1 Year-on-year changes in non-agricultural labor force, employment and unemployment
Source: TurkSTAT,Betam
An increase of 0.1 percentage point in non-agricultural unemployment
According to seasonally adjusted data, non-agricultural labor force increased by 62 thousand in the period of April
2014 compared to the period of February 2014, and reached 22 million 992 thousand (Figure 2, Table 1).
Non-agricultural employment increased by 32 thousand and reached 20 million 440 thousand. Hence, the number
of persons unemployed in non-agricultural sectors increased by 30 thousand. Non-agricultural unemployment rate
*Prof. Dr. Seyfettin Gürsel, Betam, Director, [email protected]
Yrd. Doç. Dr. Gökçe Uysal, Betam, Vice Director, [email protected] Ayşenur Acar, Betam, Research Assistant, [email protected]
Labor Market Outlook:
July 2014
www.betam.bahcesehir.edu.tr
2
increased by 0.1 percentage point and reached 11.1 percent in the period of April 2014 compared to the period of
March 2014.
Figure 2 Seasonally adjusted non-agricultural labor force, employment and unemployment
Source: TurkStat,Betam
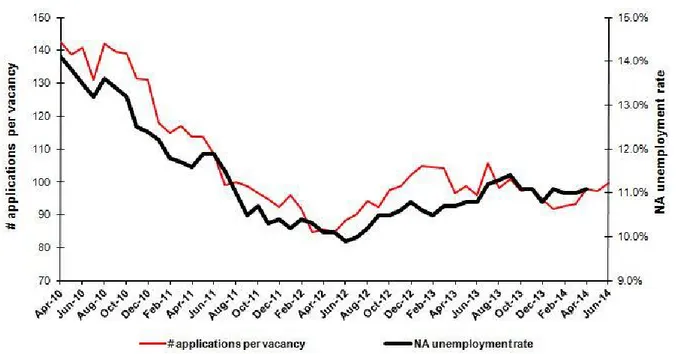
According to Kariyer.net data, non-agricultural unemployment will increase
Predictions based on the seasonally adjusted application per vacancy statistics calculated using Kariyer.net
1and
prediction model proposed by Betam researcher Barış Soybilgen indicate that non-agricultural unemployment will
increase in the period of May 2014. The prediction model could be found in the Betam Research Brief 168.
Figure 3 Seasonally adjusted non-agricultural unemployment rate and application per vacancy
Source: Kariyer.net, TurkStat,Betam
1 Betam has been calculating application per vacancy using series released by Kariyer.net for a while. Seasonal and calendar adjustment
procedure is applied to application per vacancy series. A decrease in applications per vacancy may be caused by an increase in vacancies or by a decrease in the number of applications. An increase in vacancies signals economic growth while decreasing number of applications indicates a decrease in number of people looking for a job. Monthly labor market series released by TurkStat is the average of three months. Therefore, application per vacancy statistics calculated using Kariyer.net series is the average of three months as well.
Service sector continues to create employment
Seasonally adjusted sectoral labor market series show that employment in construction sector decreased by 80
thousand in the period of April 2014 (Table 2, Figure 4).
2Employment in manufacturing has been stagnating for the
last two periods. On the other hand, employment in service sector increased by 100 thousand in the periods of
March and April 2014.
2Employment in each sector is seasonally adjusted separately. Hence the sum of these series may differ from the seasonally adjusted series of
www.betam.bahcesehir.edu.tr
4
Figure 4 Employment by sectors (in thousands)
3Source: TurkStat,Betam
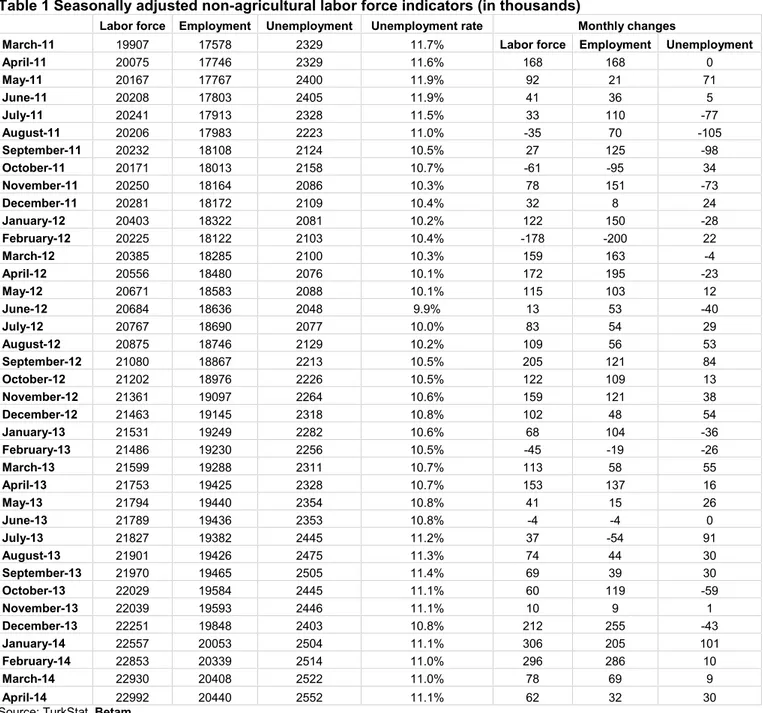
Table 1 Seasonally adjusted non-agricultural labor force indicators (in thousands)
Labor force Employment Unemployment Unemployment rate Monthly changes
March-11 19907 17578 2329 11.7% Labor force Employment Unemployment
April-11 20075 17746 2329 11.6% 168 168 0 May-11 20167 17767 2400 11.9% 92 21 71 June-11 20208 17803 2405 11.9% 41 36 5 July-11 20241 17913 2328 11.5% 33 110 -77 August-11 20206 17983 2223 11.0% -35 70 -105 September-11 20232 18108 2124 10.5% 27 125 -98 October-11 20171 18013 2158 10.7% -61 -95 34 November-11 20250 18164 2086 10.3% 78 151 -73 December-11 20281 18172 2109 10.4% 32 8 24 January-12 20403 18322 2081 10.2% 122 150 -28 February-12 20225 18122 2103 10.4% -178 -200 22 March-12 20385 18285 2100 10.3% 159 163 -4 April-12 20556 18480 2076 10.1% 172 195 -23 May-12 20671 18583 2088 10.1% 115 103 12 June-12 20684 18636 2048 9.9% 13 53 -40 July-12 20767 18690 2077 10.0% 83 54 29 August-12 20875 18746 2129 10.2% 109 56 53 September-12 21080 18867 2213 10.5% 205 121 84 October-12 21202 18976 2226 10.5% 122 109 13 November-12 21361 19097 2264 10.6% 159 121 38 December-12 21463 19145 2318 10.8% 102 48 54 January-13 21531 19249 2282 10.6% 68 104 -36 February-13 21486 19230 2256 10.5% -45 -19 -26 March-13 21599 19288 2311 10.7% 113 58 55 April-13 21753 19425 2328 10.7% 153 137 16 May-13 21794 19440 2354 10.8% 41 15 26 June-13 21789 19436 2353 10.8% -4 -4 0 July-13 21827 19382 2445 11.2% 37 -54 91 August-13 21901 19426 2475 11.3% 74 44 30 September-13 21970 19465 2505 11.4% 69 39 30 October-13 22029 19584 2445 11.1% 60 119 -59 November-13 22039 19593 2446 11.1% 10 9 1 December-13 22251 19848 2403 10.8% 212 255 -43 January-14 22557 20053 2504 11.1% 306 205 101 February-14 22853 20339 2514 11.0% 296 286 10 March-14 22930 20408 2522 11.0% 78 69 9 April-14 22992 20440 2552 11.1% 62 32 30
6
Table 2 Seasonally adjusted employment by sector (in thousands)
Agriculture Manufacturing Construction Service Monthly changes
March-11 5462 4914 1623 11040 Agriculture Manufacturing Construction Service
April-11 5359 4958 1637 11150 -103 44 14 110 May-11 5313 4915 1661 11191 -46 -43 24 41 June-11 5362 4826 1675 11301 49 -89 14 110 July-11 5380 4846 1701 11367 18 20 26 66 August-11 5441 4816 1759 11408 61 -30 58 41 September-11 5374 4866 1762 11481 -67 50 3 73 October-11 5409 4823 1680 11510 35 -43 -82 29 November-11 5403 4870 1672 11622 -6 47 -8 112 December-11 5329 4873 1640 11659 -74 3 -32 37 January-12 5336 4864 1713 11745 7 -9 73 86 February-12 5283 4808 1567 11746 -53 -56 -146 1 March-12 5232 4850 1582 11853 -51 42 15 107 April-12 5260 4930 1660 11890 28 80 78 37 May-12 5307 4908 1725 11951 47 -22 65 61 June-12 5250 4900 1735 12001 -57 -8 10 50 July-12 5248 4926 1723 12041 -2 26 -12 40 August-12 5240 4892 1756 12098 -8 -34 33 57 September-12 5306 4911 1776 12179 66 19 20 81 October-12 5349 4917 1784 12274 43 6 8 95 November-12 5360 5003 1804 12289 11 86 20 15 December-12 5346 5051 1785 12309 -14 48 -19 20 January-13 5335 5073 1827 12350 -11 22 42 41 February-13 5308 5023 1818 12389 -27 -50 -9 39 March-13 5296 5083 1799 12406 -12 60 -19 17 April-13 5288 5176 1822 12427 -8 93 23 21 May-13 5230 5200 1746 12493 -58 24 -76 66 June-13 5181 5163 1761 12512 -49 -37 15 19 July-13 5176 5146 1702 12533 -5 -17 -59 21 August-13 5193 5117 1737 12573 17 -29 35 40 September-13 5189 5096 1769 12600 -4 -21 32 27 October-13 5106 5090 1851 12644 -83 -6 82 44 November-13 5068 5064 1804 12725 -38 -26 -47 81 December-13 5058 5131 1908 12808 -10 67 104 83 January-14 5406 5232 1974 12846 348 101 66 38 February-14 5544 5359 2051 12928 138 127 77 82 March-14 5622 5365 2011 13032 78 6 -40 104 April-14 5592 5373 1931 13137 -30 8 -80 105