ANALYSING THE EFFECTS OF CROSS-BORDER ELECTRICITY TRADE ON
POWER PRODUCTION FROM DIFFERENT ENERGY SOURCES
A Master’s Thesis
by
DENİZ EGE BOZ
Graduate Program in
Energy Economics, Policy and Security
İhsan Doğramacı Bilkent University
Ankara
April 2020
DEN İZ EG E BO Z AN ALY SIN G T H E EFF ECT S O F C RO SS -BO RD ER ELE C TRI C IT Y T RA D E O N P O WE R P R O D U C TIO N F R O M D IFF ER EN T EN ER G Y S O U RC E S Bi lke n t U n iv ers ity 2 0 2 0ANALYSING THE EFFECTS OF CROSS-BORDER ELECTRICITY TRADE ON
POWER PRODUCTION FROM DIFFERENT ENERGY SOURCES
The Graduate School of Economics and Social Sciences
of
İhsan Doğramacı Bilkent University
by
Deniz Ege Boz
In Partial Fulfillment of the Requirements for the Degree of
MASTER OF ARTS IN ENERGY ECONOMICS, POLICY AND
SECURITY
Graduate Program in Energy Economics, Policy and Security
………..
İhsan Doğramacı Bilkent
University Ankara
III
ABSTRACT
ANALYSING THE EFFECTS OF CROSS-BORDER ELECTRICITY TRADE ON POWER PRODUCTION FROM DIFFERENT ENERGY SOURCES
Boz, Deniz Ege
M.A. Program in Energy Economics, Policy and Security
Supervisor: Prof. Dr. M. Hakan Berument April 2020
This thesis provides empirical evidence to emphasize the crucial role of cross-border electricity trade for decreasing the use of fossil fuels in power industries and
attaining higher electricity supply from solar and wind energy sources. We collected data for 48 countries across three continents (the Americas, Europe and Asia) from 1991 to 2018 to create a world sample that would reflect the diversity of various energy mixes in different electricity markets. We showed the existence of long-term relationships between power production from natural gas, solar, wind and the level of cross-border electricity trade through panel unit root and panel cointegration tests. Later on, we conducted panel data analyses that utilize the fixed-effect approach with interactive variables. The empirical evidence reveals that when electricity production from solar and wind energy sources interacts with cross-border electricity trade, power production from natural gas decreases statistically significantly. Furthermore, we created efficiency indices for solar and wind energy sources and provide evidence for the increased utilization of solar and wind electricity production in the presence of cross-border electricity trade.
Key Words: Electricity Markets, Electricity Trade, Panel Data Analysis, Renewable and Non-Renewable Sources.
IV
ÖZET
ULUSLARASI ELEKTRİK TİCARETİNİN FARKLI ENERJİ KAYNAKLARINDAN ELEKTRİK ÜRETİMİNE ETKİLERİNİN ANALİZİ
Boz, Deniz Ege
Yüksek Lisans, Enerji Ekonomisi ve Enerji Güvenliği Politikaları Programı Tez Danışmanı: Prof. Dr. M. Hakan Berument
Nisan 2020
Bu tez, enerji endüstrilerinde fosil yakıtların kullanımını azaltmak, güneş ve rüzgar enerjisi kaynaklarından daha yüksek elektrik tedariki elde etmek için uluslararası elektrik ticaretinin önemli rolünü vurgulamak adına ampirik kanıtlar sunmaktadır. Dünyada farklı elektrik piyasalarındaki kurulu güçlerin sahip olduğu enerji çeşitliliğini yansıtabilmek adına, üç kıtadan (Amerika, Avrupa ve Asya) 48 ülke seçilmiş ve 1991'den 2018'e yılları için veri toplanmıştır. Panel birim kök testi ve panel
eşbütünleşme (koentegrasyon) testleri ile doğal gaz, güneş, rüzgardan enerji üretimi uluslararası elektrik ticareti seviyesi arasında uzun vadeli ilişkilerin varlığını
gösterilmiştir. Daha sonra, etkileşimli değişkenlerle sabit etkili yaklaşımı kullanan panel veri analizleri yapılmıştır. Ampirik kanıtlar, bir ülkede güneş ve rüzgar enerjisi kaynaklarından elektrik üretiminin uluslararası elektrik ticareti ile etkileşime
girmesinin, doğal gazdan elektrik üretiminin istatistiksel olarak manalı ölçüde azalttığını ortaya koymaktadır. Ayrıca, güneş ve rüzgar enerjisi kaynakları için
verimlilik endeksleri oluşturulmuştur ve uluslararası elektrik ticareti yapan ülkelerde güneş ve rüzgar enerjisinden elektrik üretiminin kullanımının arttığını dair ampirik kanıtlarla gösterilmiştir.
Anahtar kelimeler: Elektrik Piyasaları, Elektrik Ticareti, Panel Veri Analizi, Yenilenebilir ve Yenilenebilir olmayan Kaynaklar
V
ACKNOWLEDGEMENTS
I would like to express my sincere gratitude to my supervisor, Prof. Hakan Berument for his excellent guidance, encouragement, and patience through the development of this thesis.
I am very grateful to Mr. Barış Sanlı for his valuable support and advices.
I would like to thank to Prof. Nükhet Doğan for her valuable comments.
I am very thankful to my family for their encouragement and support during my studies.
VI
TABLE OF CONTENTS
ABSTRACT……… III ÖZET……… IV ACKNOWLEDGEMENTS………. V TABLE OF CONTENTS………. VILIST OF TABLES……… VII
CHAPTER I: INTRODUCTION………... 1
CHAPTER II: LITERATURE REVIEW………. 5
CHAPTER III: DATA………... 9
CHAPTER IV: EMPRICAL ANALYSIS……… 14
4.1 Initial Analysis……… 14
4.1.1 Panel Unit Root Test………. 14
4.1.2 Panel Cointegration Analysis……… 19
4.2 Empirical Evidence………. 23
4.3 Analysis of Efficiency Indices……….. 29
CHAPTER V:CONCLUSION………. 36
APPENDIX………. 38
VII
LIST OF TABLES
1. VARIABLE NAMES AND LABELS USED IN ESTIMATION TABLES……… 12 2. DESCRIPTIVE STATISTICS………..13 3. PESARAN’S PANEL UNIT ROOT TEST (1991 -2018)……… 17 4. PESARAN’S PANEL UNIT ROOT TEST (2010 -2016)……… 18 5. PEDRONI’S PANEL COINTEGRATION TEST AMONG ELECTRICITY
PRODUCTION FROM DIFFERENT RESOURCES (1991-2018)……… 22 6. INTERACTIVE EFFECTS OF ELECTRICITY PRODUCTION FROM SOLAR
PV AND CROSS-BORDER TRADE ON NATURAL GAS (1991-2018)….. 27 7. INTERACTIVE EFFECTS OF ELECTRICITY PRODUCTION FROM WIND
AND CROSS-BORDER TRADE ON NATURAL GAS (1991-2018)………. 28 8. EFFECTS OF CROSS-BORDER TRADE ON THE EFFICIENCY OF
ELECTRICITY PRODUCTION FROM SOLAR PV (2010-2016) ………….. 34 9. EFFECTS OF CROSS-BORDER TRADE ON THE EFFICIENCY OF
ELECTRICITY PRODUCTION FROM WIND (2010-2016) ……… 35
A1. LIST OF SAMPLE COUNTRIES BY CONTINENT………... 38
A2. RESULTS OF PANEL COINTEGRATION TEST AMONG VARIABLES IN
DDDMODEL (1) (1991-2018)……….. 39
A3. RESULTS OF PANEL COINTEGRATION TEST AMONG VARIABLES IN
DDDMODEL (2) (1991-2018)……….. 40
A4. RESULTS OF PANEL COINTEGRATION TEST AMONG VARIABLES IN
DDDMODEL (3) AND (4) (2010-2016)………. 41
A5. RESULTS OF PANEL COINTEGRATION TEST AMONG VARIABLES IN
DDDMODEL (1) WITH COAL (1991-2018)……….... 42
A6. RESULTS OF PANEL COINTEGRATION TEST AMONG VARIABLES IN
1
CHAPTER I
INTRODUCTION
The power industry is one of the most carbon-emitting industries on the global level
since the majority of power plants in the world still use carbon-based fossil fuels to
generate electricity. Amid rising concerns over climate crisis and decreasing costs of
renewable technologies, a number of countries have been increasing their uptake of
solar and wind energy applications to attain sustainable, low-carbon economies in
the long-run. However, replacing fossil-fuel based power plants completely with
renewable energy sources is a challenging task, especially from a technical
perspective. It is well known that rising shares of solar and wind energy sources put
technical constraints on grid operations by increasing short-term volatility in power
production due to their intermittent nature. Also, their capacities cannot be utilized
to the full extent in the presence of high demand fluctuations and in the absence of
high response baseload power plants. For instance, on the island of Cyprus, wind
capacities stay idle because baseload is only provided by fuel oil power plants
(Özden, 2019). In this thesis, we argue that besides helping to solve technical
constraints and gaining economic benefits from trade, increasing the levels of
cross-border electricity trade is crucial for decreasing the use of fossil fuels in power
industries and attaining higher electricity supply from solar and wind energy sources.
By providing empirical evidence using annual data from 1991 to 2018 over a world sample containing 48 countries across three continents (Americas, Europe, and Asia);
2
we assessed the effects of the levels of cross-border electricity trade on electricity markets using various econometric specifications. First, we showed that there exist
long-run relationships among electricity production from natural gas, solar, wind energy sources, and the level of cross-border electricity trade. Afterward, we
conducted panel data analyses using the fixed effects approach by utilizing
interactive variables containing cross-border electricity trade. As a result, we were
able to demonstrate that as the level of cross-border electricity trade of a country
increases together along with electricity production from solar and wind energy
sources; electricity production from natural gas power plants decreases statistically
significantly. Furthermore, we provided evidence that for countries with positive
economic growth, rising levels of cross-border electricity trade leads to more
efficient electricity production from solar and wind energy sources. Our results
emphasize the importance of increasing interconnection capacities and integration
among electricity markets in terms of completing a global energy transition in the
long-run and accelerate the transition process.
The energy mix of installed capacities all around the world is quite diverse and after
the electricity is produced and ready to be transmitted, there is no certainty which
type of energy source has been used for it. It is possible that most of the electricity
traded across borders has been produced from carbon-based coal or natural gas.
Hence, it is critical to have a detailed analysis of the effects of such a beneficial tool
for creating flexibility1 in power systems (cross-border electricity trade) on an
1 According to the International Energy Agency, the flexibility of a power system refers to "the extent
to which a power system can modify electricity production or consumption in response to variability, expected or otherwise” (IEA, 2019).
3
aggregate level. Theoretically, considering the priorities solar and wind energy sources have in the merit orders of many electricity markets; we expect that
co-existence of cross-border electricity trade and growing shares of solar and wind energy sources in total electricity production to create diminishing effects on the
usage of fossil fuels in power industry relative to these two types of energy. Hence,
we hypothesize that in the existence of adequate flexibility in the system, more units
of produced electricity from solar and wind energy sources can be supplied to the
end consumers.
As investments on solar and wind energy sources increase, trading electricity more
across borders can create the required additional flexibility to better accommodate
existing power supply. For many countries around the world (especially in the
European Union), cross-border trade of electricity and market integration have
started to be considered as a favorable option to alleviate the adverse effects on grid
operations caused by high growth rates of renewable deployment. Nonetheless, the
full potential of benefits is far from being realized in most of the countries. Currently,
electricity is still one of the least traded types of energy by far compared to liquid
global markets of oil, natural gas, and coal. Global exports of electricity are around
3% of total production, in contrast to 64% for oil and 31% for gas and 16% for coal
(Pollitt & Oseni, 2014).
The rest of the thesis is organized as follows. Section 2 presents the review of
previous studies analyzing different aspects of cross-border electricity trade and
points out the contribution of this thesis to the existing literature. Section 3
4
and panel cointegration tests, and the estimations. Finally, Section 5 gives the concluding remarks and policy implications of the findings.
5
CHAPTER II
LITERATURE REVIEW
Physical laws governing the electromagnetic activity of photons necessitates overall electricity supply and demand to be synchronized at all times on the transmission
lines, within a very small range of frequency. Electricity grid operators have to deal with serious instability issues as shares of solar and wind energies increase in overall
installed capacity. Unlike any other fossil fuel-based or nuclear power plants, the production of electricity from solar and wind energy sources are not continuous and
fluctuate according to weather conditions, which is not an estimable phenomenon
with high accuracy. Hence, it becomes very challenging to reinforce congestion
management, frequency balancing and optimization of economic dispatch2 for
system operators. Consequentially, the overall capacity factor and efficiency of the
entire power system may decrease which results in both financial losses and physical
losses of generated power.
Countries in the electricity network zones of North America and European Network
of Transmission System Operators for Electricity (ENTSO-E) demonstrated collective
efforts to achieve sustainable cross-border trade policies and build more efficient
and dynamic generation and transmission capacities. The successful development
2Economic dispatch is the short-term determination of the optimal output of a number of electricity generation facilities, to meet the system load, at the lowest possible cost, subject to transmission and operational
6
and functioning of the Nord Pool Network3 provided a good demonstration of the laudable outcomes that can arise from cross-border electricity trade. Clark, Zipkin,
Bobo & Rong argue in their 2017 paper that the Nord Pool Network exhibits a good model of an integrated system that enables increases of aggregate efficiency and
capacity factors of intermittent renewable energy sources. Thus, many scholars such
as Li and Kimura (2015), Rose, McBennett, Palchak and Cochran (2018) and
Martinez- Anidoa, Migliavaccab, Sorannob, and Vriesc (2013) identified electricity
markets with high potential to procure aggregate efficiency gains in both economic
and technical terms as a result of increased cross-border transmission network
capacities. They developed corresponding economic, regulatory and institutional
models within theoretical and real market conditions that will facilitate cross-border
electricity trade. These models aimed to invoke the necessary conditions in each
state’s electricity market and regulatory structures which would enable adaptation
to more integrated electricity markets and transmission networks.
Bahar and Sauvage (2013) developed a theoretical model for measuring the effects
of relative electricity prices and net transfer capacity on electricity exports. By using
Samuelson (1954)’s iceberg specification, they incorporated the effects of different
regulatory policies on electricity prices. Later, they simulated scenarios within the
European Power Markets to assess the effects of price differences and net transfer
capacity on the level of cross-border electricity trade. By assuming that exporters
face trade costs when sending electricity to an interconnected country, they
concluded that differences in relative prices and to less extent relative net transfer
3 Nord Pool Network is established in 2001. As of today 7 countries is part of the Nord Pool Network:
7
capacity do have a significant and positive impact on the level of cross-border electricity trade. Hence, their results suggest that price differentials in
interconnected electricity markets in Europe are the main driver of electricity trade.
Agostini, Shahriyar, and Silva (2017) identified political, regulatory and
infrastructural obstacles for the short-term electricity exchanges among countries in
South America. Since most countries in South America lack well-established
regulatory frameworks to facilitate the integration of large electricity grids; Agostini
et al. (2017) proposed a regulatory model that allows short-term electricity
exchanges between countries by utilizing the production surpluses in local markets
that were going to waste in the absence of demand. Based on the empirical analysis
of simulations which considered international trade of electricity centering Chile and
its neighboring countries; they supported the argument that market integration
among South American countries is economically feasible in the long run. Rose et al.
(2018) created a highly detailed thesis supported by the National Renewable Energy
Laboratory (NREL) of the United States Department of Energy to examine the
potential cross-border electricity trade and market integration between India and Sri
Lanka which would be initiated in 2025. One of the prominent conclusions they have
attained was that a 500-MW high voltage direct current transmission link would
generate annual production cost savings of USD 180 million and improve power
system operations between these countries.
Similar studies were undertaken by Martinez-Anido et al. (2013) as well as Li and
Kamura (2016) by analyzing costs and benefits of increased power grid
8
respectively. Furthermore, Ji, Jia, Chiu, and Xu (2016) examined the global grid as a network by defining nations as nodes and international electricity trade as links.
Their work revealed the existing physical connections among grid networks on a global level and identified sub-groups of networks. In which, they argued that
adequate capacity of transmission technologies in strategic geographical locations
can significantly facilitate cross-border electricity trade of an entire identified
network. On the other hand, Oseni and Pollitt (2014) focused on the institutional
arrangements needed for facilitating regional electricity cooperation while Clark et
al. (2017) argued that government, private sector, and public interests are inclined to
have contradicting interest within electricity markets and provided investigation of
some noteworthy cases.
Such empirical findings deliberated on the effective expansion of cross-border
electricity trade all over the world with specific case-studies. Nonetheless, there is a
lack of a large-scale empirical analysis focusing on the overall effects of cross-border
electricity trade on electricity production from fossil fuels and renewable energy
sources. How the interaction of cross-border electricity trade and increasing shares
of solar and wind technologies have affected the overall electricity production from
fossil fuels and how cross-border electricity trade has affected production from solar
and wind energy sources emerge as important questions to be answered. This thesis
aims to fill this gap by breaking down and assessing the endogenous relationship
among cross-border electricity trade and electricity production output from natural
9
CHAPTER III
DATA
In our sample, annual panel data covering 28 years from 1991 to 2018, including 48
countries (15 countries from Americas, 15 from Asia and 18 countries from Europe)
are used for the empirical analyses in this thesis (list of countries are presented in
the Appendix). International electricity data of Energy Information Administration
(EIA) is the main source of our data where all sample countries are selected from.
However, the additional data has been gathered from multiple resources to
eliminate existing gaps as much as possible. Electricity production data of fossil
fuel-based power plants (coal and natural gas) has been gathered from the United
Nations Database and the World Bank Data since EIA only reports joint electricity
production data for fossil fuels. Electricity production data of renewable
technologies (solar and wind) are taken from the International Renewable Agency
database for the 2017-2018 period since the EIA data ends in 2016. Unavailable
electricity export and import data of European countries have been supplemented
from the ENTSOE Database. Unavailable data of electricity export and imports for
non-European OECD countries have been gathered from the International Energy
Agency Monthly Electricity Statistics by being converted to annual data. Table 1 gives
the variable names and labels used in estimations as well as their respective data
source. Descriptive statistics are presented in Table 2.
Electricity markets around the world can exhibit profoundly different characteristics due to various reasons. Existing natural resources, available technology and
10
infrastructure, and regulations in the market are some of the straightforward examples which result in such diversity. In order to create a sample that will
incorporate the extent of this diversity; we have selected countries with different levels of market interconnections from all around the world. The variables used in
the analyses include electricity production from coal, natural gas, solar and wind
energy sources. Among these variables, electricity production from coal is excluded
from the estimations because panel cointegration tests suggest that it does not have
long-run relationships with electricity production from solar and wind energy
sources in our world sample of 48 countries for the last 28 years.4
The series used in this thesis for the electricity production from natural gas, solar and
wind sources are in their logarithmic forms to investigate the relationship between
the rates of production rather than in levels. Levels of cross-border electricity trade
and GDP growth rate are other variables included in the analyses designated as
‘trade’, and ‘GDP’. The cross-border electricity trade is the sum of electricity exports
and imports of country i in absolute values, denominated by the first lag of total
electricity production of country i. The division is made with the lag of total
electricity production to prevent the endogeneity problem since electricity exports
are correlated with electricity production. Solar and wind efficiency indices which are
discussed in section 4.3 are created to assess the effects of cross-border electricity
trade on the production efficiency from Variable Renewable Energy Sources (VREs)5.
The indices measure the productiveness of solar and wind capacities of a sample
4 This makes sense because high carbon emissions and other environmental concerns force countries
to make use of more environmentally friendly alternatives.
11
country by taking into account the share of solar and wind in total electricity
production and comparing it to the share of solar and wind in total installed capacity.
GDP growth rate is formulated as the first difference of the logarithm of GDP. The unit of measurement for all variables concerning production or trade of electricity
production is billion kWh. The unit of measurement for installed capacities is billion
12
Table 1. Variable Names and Labels Used in Estimation Tables
Variable Name Variable Label Source of Data
Logarithm of electricity
production from natural gas Natural Gas World Bank Data, UN Data
Logarithm of electricity
production from solar PV Solar EIA, IRENA
Logarithm of electricity
production from wind turbines Wind EIA, IRENA
Level of Cross-Border Electricity Trade as a Ratio of Previous Year’s Total Electricity Production
Trade EIA, IEA
GDP growth rate GDP EIA
Efficiency of Solar Capacity as a Ratio of the Efficiency of Overall Installed Capacity
Solar Efficiency
EIA, IRENA
Efficiency of Wind Capacity as a Ratio of the Efficiency of Overall Installed Capacity
Wind Efficiency
13
Table 2. Descriptive Statistics
Whole Sample 2010-2016
Variables in Levels
Mean Standard Dev.
Min Max Number of
Observations
Mean Standard Dev.
Min Max Number of
Observations Natural gas (billion kWh) 56.02 149.19 0.00 1454.22 1282 80.29 196.13 0.00 1418.10 320 Solar (billion kWh) 1.58 8.66 0.00 175.86 1295 3.26 8.68 0.00 66.52 336 Wind (billion kWh) 5.77 24.77 0.00 358.96 1296 12.48 32.67 0 237.07 336 Trade 0.13 0.21 0.00 1.20 1340 0.15 0.23 0.00 1.07 336 GDP 1277.4 2600.2 8.27 22051.7 1340 1659.4 3270.2 20.5 19400.2 336 Solar efficiency 0.25 0.33 0.00 5.89 610 0.28 0.37 0.00 5.89 322 Wind efficiency 0.47 0.25 0.00 1.56 830 0.57 0.26 0.00 1.56 306 13
14
CHAPTER IV
EMPIRICAL ANALYSIS
4.1 Initial Analysis
In order to assess any long-run relationship among fossil fuels and solar,
wind-generated electricity, and how these relationships altered with cross-border
electricity trade; we perform panel unit and panel cointegration tests and estimation
of models allowing the assessments.
4.1.1 Panel Unit Root Tests
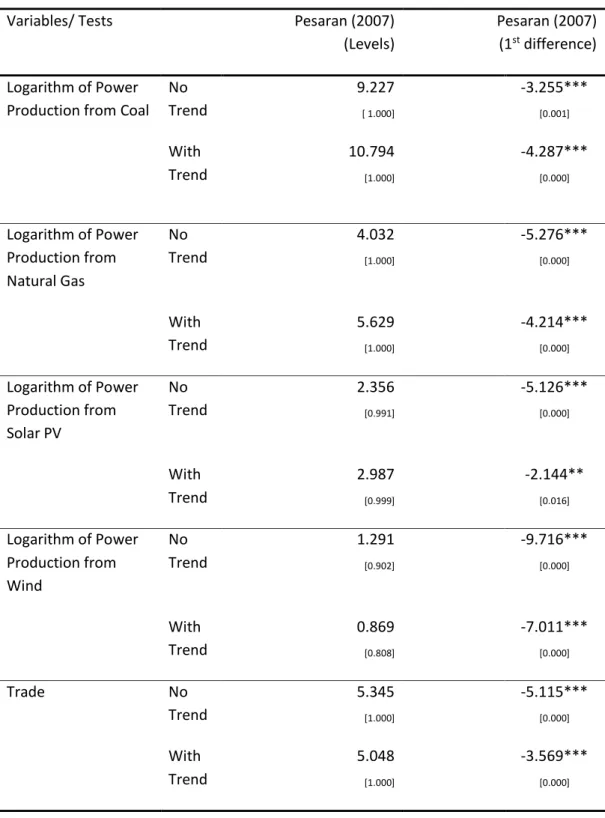
Table 3 reports Paseran (2007)’s panel unit root test with constant and with constant
& time trend for the rates of power production from different natural resources and
cross-border electricity trade over the span of 28 years (1991 to 2018)6 and relates
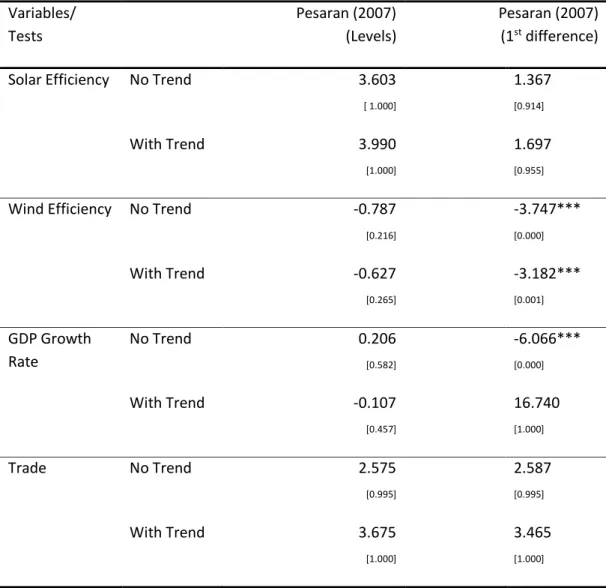
to the estimations of models (1) and (2). On the other hand, Table 4 reports the
results of the same test with the same conditions but relates to the variables used in
models (3) and (4) which have the same sample countries but are estimated for the
period 2010 to 2016. The reason behind this preference is elaborated in sub-section
4.3.
Baltagi (2005) argues that the information contained in cross-section data would
enhance the power of the unit-root tests in contrast to univariate unit root tests. In
6 The data availability for electricity production from natural gas and coal for 2017 and 2018 is very
15
this thesis, the estimates from a second-generation panel unit root test are used for multivariate time series’ unit root processes. The first generation of panel unit root
tests such as Levin and Lin (1992, 1993), Levin et al. (2002) Maddala and Wu (1999), Choi (1999, 2001) are based on the cross-sectional independence hypothesis. Yet,
the data used in this thesis have cross-sectional dependence since many of the
energy sources used in electricity production as well as the technological
commodities used in production are subject to international trade among countries
in our data set. On the other hand, the cross-sectional independence hypothesis is
rather restrictive and somewhat unrealistic in the majority of macroeconomic
applications of unit root tests (Hurlin & Mignon, 2007).
Pesaran (2007) Panel Unit Root Test in the Presence of Cross-section Dependence
(CIPS) test allows for heterogeneity in the autoregressive coefficient of the
Dickey-Fuller(DF) regression and the presence of a single unobserved common factor with
heterogeneous factor loadings in the data. The statistic is constructed from the
results of panel-member-specific (A)DF regressions where cross-section averages of
the dependent and independent variables (including the lagged differences to
account for serial correlation) are included in the model. The averaging of the
group-specific results follow the procedure in the Im, Pesaran, and Shin (2003) test. Under
the null hypothesis of stationarity at the order of (1), the test statistic has a
non-standard distribution which uses 𝑍𝑡 statistics.
The main goal of carrying out this test is to assess the order of integration of all
variables under thesis and conduct a co-integration analysis among them later on. The precondition for a cointegration analysis requires all the variables of interest to
16
be integrated of order one, I (1). The null hypotheses of all tests are the presence of a unit root; hence, the desired results would be not to reject the null hypothesis.
Obtained results indicate that the existence of a unit root process of I (1) for the logarithm of power production from coal, natural gas, solar and wind, as well as the
efficiency indices for the electricity production from solar and wind, cross-border
electricity trade and GDP growth rate, cannot be rejected for all cases without trend
and with trend. Hence, all the variables used in the models (1) to (4) can have
cointegrated relationships among themselves depending on the results of reported
17
Table 3: Pesaran’s Panel Unit Root Test (1991 – 2018)
Variables/ Tests Pesaran (2007) (Levels)
Pesaran (2007) (1st difference)
Logarithm of Power Production from Coal
No Trend 9.227 [ 1.000] -3.255*** [0.001] With Trend 10.794 [1.000] -4.287*** [0.000] Logarithm of Power Production from Natural Gas No Trend 4.032 [1.000] -5.276*** [0.000] With Trend 5.629 [1.000] -4.214*** [0.000] Logarithm of Power Production from Solar PV No Trend 2.356 [0.991] -5.126*** [0.000] With Trend 2.987 [0.999] -2.144** [0.016] Logarithm of Power Production from Wind No Trend 1.291 [0.902] -9.716*** [0.000] With Trend 0.869 [0.808] -7.011*** [0.000] Trade No Trend 5.345 [1.000] -5.115*** [0.000] With Trend 5.048 [1.000] -3.569*** [0.000]
Notes: Null Hypothesis: Series is I (1). Pesaran (2007) uses 𝑍𝑡 statistics. All Lag Lengths are set at (0). (***) means the parameter is significant at 1%. (**) means the parameter is significant at 5%. (*) means parameter is significant at 10%.
18
Table 4: Pesaran’s Panel Unit Root Test (2010 – 2016)
Variables/ Tests Pesaran (2007) (Levels) Pesaran (2007) (1st difference)
Solar Efficiency No Trend 3.603 [ 1.000] 1.367 [0.914] With Trend 3.990 [1.000] 1.697 [0.955]
Wind Efficiency No Trend -0.787 [0.216] -3.747*** [0.000] With Trend -0.627 [0.265] -3.182*** [0.001] GDP Growth Rate No Trend 0.206 [0.582] -6.066*** [0.000] With Trend -0.107 [0.457] 16.740 [1.000] Trade No Trend 2.575 [0.995] 2.587 [0.995] With Trend 3.675 [1.000] 3.465 [1.000]
Notes: Null Hypothesis: Series is I (1). Pesaran (2007) uses 𝑍𝑡 statistics. All Lag Lengths are set at (2). (***) means the parameter is significant at 1%. (**) means the parameter is significant at 5%. (*) means parameter is significant at 10%.
19
4.1.2 Panel Cointegration Analysis
Pedroni’s panel cointegration test is employed in order to provide evidence for the
existence of any long-run relationship between electricity production from fossil fuels (coal and natural gas) and electricity production renewable energy sources
(solar and wind). Several tests have been proposed in the literature for panel
cointegration like (Pedroni,2004) and (Kao, 1999). They are both based on (Engle &
Granger, 1987)’s methodology which is two-step (residual-based) cointegration
tests. On the other hand, Fisher-type tests are using an underlying Johansen
methodology (Wu & Maddala, 1999) which relaxes the assumption of a unique
cointegrating vector among variables. The focus of our thesis requires analyzing the
cointegrating properties of a two-dimensional vector of I(1) variables. The trade
variable we included in our estimation is a sheer exogenous variable which we
expect to observe the effects of, on the long-run relationship between fossil
fuel-based and renewable-fuel-based electricity production. In addition, Pedroni’s panel
cointegration test is residual-based and the estimated slope coefficients are
permitted to vary across individual members of the panel (Pedroni, 2004). The test is
appropriate for various cases of heterogeneous dynamics, endogenous regressors,
and individual-specific constants and trends (Westerlund, 2007).
Pedroni’s panel cointegration test includes seven test statistics. These test statistics
are v, o, group-rho, t (non-parametric), group-t (non-parametric),
panel-adf (parametric), and group-panel-adf (parametric). All test statistics are normalized to be
distributed under N (0,1) and diverge to negative infinity as the p-value converges to
20
test. Four or more test statistics out of seven having p-values less than 0.10 enables us to reject the null of cointegration and conclude that the variables of interest have
a cointegrated relationship (Pedroni, 2004). The optimal lag length is chosen based on Schwarz Information criteria.
Before analyzing how cross-border electricity trade may affect the relationship
between the methods of electricity production from different energy sources, we
assessed if there is a pair-wise long-run relationship among the chosen energy
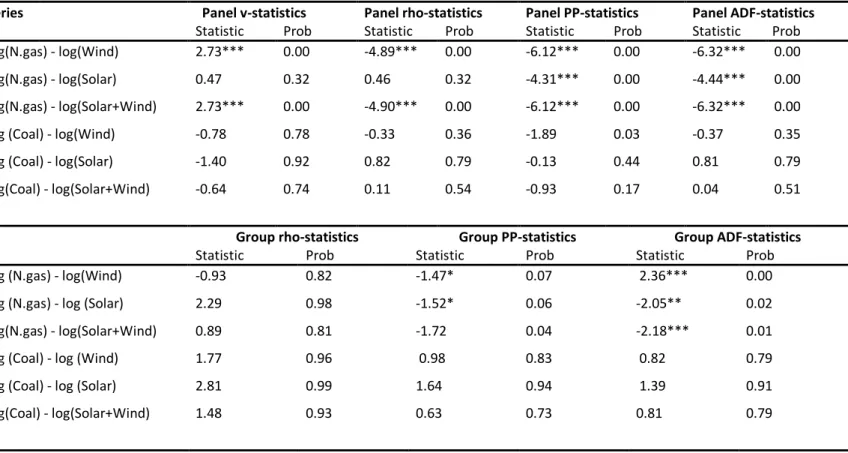
sources. Test results tabulated in Table 5 indicate that there exists a cointegrated
relationship between the logarithm of electricity production from natural gas and
logarithm of electricity production from renewable energy sources (solar and wind).
In the relationship between natural gas and solar; four out of seven test statistics
reject the null of no cointegration at the 10% level of significance while in the
relationship between natural gas and wind; six out of seven statistics reject no
cointegration. Considering the relationship with the combination of solar and wind;
six test statistics reject the null at 5%. On the other hand, the logarithm of electricity
production from coal does not seem to have a cointegrated relationship with any of
the renewable energy sources or their combination. Only one out twenty-one test
statistics reject the null of no cointegration. As a result, we can claim that only
natural gas has long-term relationships with VREs. Correspondingly, we have
selected these variables to be used in our model.
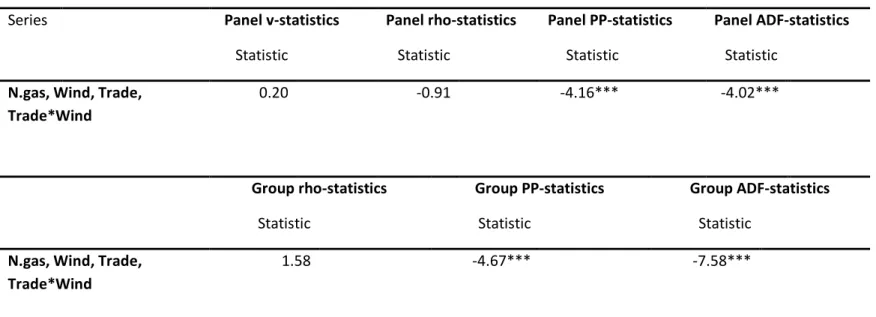
Next, we tested for panel cointegration among logarithms of power production from
natural gas, the logarithm of power production from solar and wind energy sources
21
(See Appendix Table A.2 and A.3). At least four out of seven test statistics rejected the null of no cointegration, thus, we can claim that there also exists a long-run
relationship among the level of cross-border electricity trade, logarithm of power production from natural gas, solar and wind energy sources.
22
Table 5. Pedroni’s Panel Cointegration Test Among Electricity Production from Different Natural Resources (1991-2018)
Null Hypothesis: No cointegration
Distribution: All test statistics are normalized to be distributed under N (0,1)
Trend and Lag Assumptions: No deterministic trend - Automatic lag length selection based on SIC
Rejection Criteria: Following (Pedroni, 2004), if at least four out of seven test statistics have p-values less than 0.10, we reject the null of no
cointegration and consider selected variables cointegrated. . (***) means the parameter is significant at 1%. (**) means the parameter
I is significant at 5%. (*) means parameter is significant at 10%.lgsldk
Series Panel v-statistics Panel rho‐statistics Panel PP-statistics Panel ADF-statistics
Statistic Prob Statistic Prob Statistic Prob Statistic Prob
log(N.gas) - log(Wind) 2.73*** 0.00 -4.89*** 0.00 -6.12*** 0.00 -6.32*** 0.00
log(N.gas) - log(Solar) 0.47 0.32 0.46 0.32 -4.31*** 0.00 -4.44*** 0.00
log(N.gas) - log(Solar+Wind) 2.73*** 0.00 -4.90*** 0.00 -6.12*** 0.00 -6.32*** 0.00
log (Coal) - log(Wind) -0.78 0.78 -0.33 0.36 -1.89 0.03 -0.37 0.35
log (Coal) - log(Solar) -1.40 0.92 0.82 0.79 -0.13 0.44 0.81 0.79
log(Coal) - log(Solar+Wind) -0.64 0.74 0.11 0.54 -0.93 0.17 0.04 0.51
Group rho-statistics Group PP-statistics Group ADF-statistics
Statistic Prob Statistic Prob Statistic Prob
log (N.gas) - log(Wind) -0.93 0.82 -1.47* 0.07 2.36*** 0.00
log (N.gas) - log (Solar) 2.29 0.98 -1.52* 0.06 -2.05** 0.02
log(N.gas) - log(Solar+Wind) 0.89 0.81 -1.72 0.04 -2.18*** 0.01
log (Coal) - log (Wind) 1.77 0.96 0.98 0.83 0.82 0.79
log (Coal) - log (Solar) 2.81 0.99 1.64 0.94 1.39 0.91
log(Coal) - log(Solar+Wind) 1.48 0.93 0.63 0.73 0.81 0.79
23
4.2 Empirical Evidence
Tables 6 and 7 below reports the estimates of panel data analyses reporting the
separate and integrated effects of VREs and cross-border electricity trade on the
logarithm of electricity production from natural gas in our world sample over 28 years.
Panel A and Panel B in both tables present the estimates obtained from fixed-effects
and random-effects models. Hausman Test is used for the selection between fixed and
random effects. Also, heteroskedasticity corrections are applied to all estimates using
Huber-White covariances and standard errors. In retrospect, the extent to which
electricity is traded across borders varied significantly both within and across
countries. This feature allowed us to assess the effect of electricity trade on the
orientation of the relationship among natural gas and VREs by using the fixed effects
approach as suggested by the Hausman Test. In the models (1) and (2):
𝑦𝑖𝑡ng = β11.log(solar)it + β12(trade)it + β13 [(trade)it ×log(solar)it ] + ɛ1it (1)
𝑦𝑖𝑡ng = β21.log(wind)it + β22(trade)it + β23 [(trade)it ×log(wind)it ]+ ɛ2it (2)
We have created interactive variables comprising of the combination of electricity traded across borders and electricity produced using solar PV and wind
turbines to assess their integrated effects on the rate of electricity production from natural gas. Since the sample size is large with 1,219 observations and encompasses
countries from multiple continents, the unobserved variables that are constant over
24
included variables in the model. These time-independent effects are prone to create inefficient estimates, which is also suggested by the results of the Hausman test.
Thus, we estimate our model using the fixed effects approach which mainly evaluates the within variation of included cross-section units in the sample. By
employing the fixed effect model, regressors’ time-independent characteristics
related to geographical disposition are excluded from the analysis. This exclusion
causes our models to mainly capture the effects of the dynamic features among
countries. The estimates of Random Effects which consider time-independent factors
in the idiosyncratic error term were also posted to add robustness to the results, yet
they are statistically insignificant. The effects of existing regulations and policies
regarding the exchange of electricity produced in the electricity markets could have
also been subject to elimination from the results. Since changes in direct or indirect
financial support dramatically affect new installments of VREs, this would have been
uncaptured information that could have affected the outcome of the results in an
undesired way. Yet, this is not the case for the specified models in Tables 6 and 7
where time period covers 28 years in which regulatory policies regarding power
markets have been on a dynamic path in the world. For instance, Germany reduced
its solar subsidy, a feed-in tariff for photovoltaic roof systems, from 55 Eurocents per
kilowatt-hour in 2005 to 12 Eurocents per kilowatt-hour in 2016 (Paltsey, 2016). The
new installation of solar photovoltaic capacity in Spain declined from 2700 MW in
2008, before the government changed its support structure for solar energy, to 160
MW in 2012. In Turkey, since feed-in tariffs for solar energy started in 2015, solar
25
As reported in Tables 6 and 7, there are positive relationships among electricity production from natural gas and VREs. Overall electricity demand, hence, production
has been growing in the world for the past 28 years. When the sample time period started in 1991, electricity production levels from VREs were almost nonexistent and
we know that they have only been increasing until today. Thus, the positive
relationship indicates that the overall usage of natural gas for electricity production
in the world has been increasing as well together along VREs. On the other hand, the
signs of the interactive variables’ parameters are negative for both models which
means that the orientation of the relationship between natural gas and VREs
reverses when coupled with cross-border trade of electricity. The estimated
coefficient of β3 is -0.031 for the model with solar electricity and -0.010 for the
model with wind electricity. Both coefficients are significant at 5% in both models.
These estimates indicate that for any country i; if increasing rates of electricity
production from solar and wind sources co-exist with cross-border electricity trade,
the rate of electricity production from natural gas has decreased for that country i.
This result is plausible considering the economic differences between natural gas
power plants and VREs within the changing market conditions of power industries
going through energy transition. VREs attract financial and technical incentives
through implementations of regulatory policies. For instance, feed-in tariffs can offer
both financial and technical incentives through guaranteed purchase price over a
certain time period plus priority of dispatch by the grid operator in day-ahead and
intra-day markets. Besides, VREs have really low marginal costs in production
because they do not use any additional input of relatively expensive raw material as
26
pressure in the long run on wholesale market prices both domestically and internationally and pushed high marginal cost power plants out of the market.
Hence, it can be inferred that cross-border electricity trade has a supportive function in the fulfillment of an energy transition in favor of VREs by exerting downward
27
Table 6: Interactive Effects of Electricity Production from Solar PV and Cross-Border Trade on Natural Gas (1991-2018)
Notes: ‘solar’ is the logarithm of electricity production from solar PV. Regressor ‘trade’ is (electricity exports + imports)/1st lag of total electricity production. Cross section units consists of 48 countries and specified time period is 1991 to 2018. (***) means the parameter is significant at 1%. (**) means the parameter is significant at 5%. (*) means parameter is significant at 10%.
Dependent Variable: Logarithm of electricity production from natural gas
Panel A: With-in group Fixed Effect Panel EGLS (Cross Section Weights)
Panel B: Random Effects (RE) Panel EGLS (Cross Section Random Effects) Explanatory Variables Coefficient t-Statistic Coefficient t-Statistic solar 0.019*** 9.22 0.043*** 3.98 trade -0.217 -0.96 -1.513 -0.48 solar* trade -0.031*** -6.75 -0.069 -0.84 R2 0.999 0.013 R ̅2 0.999 0.010 Prob (F-statistic) 0.000 0.000
Hausman c2 Fixed Effects
Number of Observations of Unbalanced Panel 1219
28
Table 7: Interactive Effects of Electricity Production from Wind and Cross-Border Trade on Natural Gas (1991-2018)
Notes: ‘wind’ is the logarithm of electricity production from wind turbines. Regressor ‘trade’ is (electricity exports + imports)/1st lag of total electricity production. Cross section units consists of 48 countries and specified time period is 1991 to 2018. (***) means the parameter is significant at 1%. (**) means the parameter is significant at 5%. (*) means parameter is significant at 10%.
Dependent Variable: Logarithm of electricity production from natural gas
Panel A: With-in group Fixed Effect Panel EGLS (Cross Section Weights)
Panel B: Random Effects (RE)
Panel EGLS (Cross Section Random Effects) Explanatory Variables Coefficient t-Statistic Coefficient t-Statistic wind 0.033*** 14.19 0.080*** 5.49 trade -0.074 -0.35 -1.150 -0.39 wind* trade -0.010*** -3.98 -0.024 -0.43 R2 0.999 0.047 R ̅2 0.999 0.045 Prob (F-statistic) 0.000 0.000
Hausman c2 Fixed Effects
Number of observations of Unbalanced Panel 1,219
29
4.3 Analyses of Efficiency Indices
A further investigation of the relationship among cross border electricity trade and
VREs are conducted through the models (3) and (4):
𝑦𝑖𝑡se = β31.(trade)it + β32 [ 𝚫log(GDP)it ] + β33 [(trade)it × 𝚫log(GDP)it ]+ ɛ3it (3) 7
𝑦𝑖𝑡we = β41.(trade)it + β42 [ 𝚫log(GDP)it ] + β43 [(trade)it × 𝚫log(GDP)it]+ ɛ4it (4) 8
Models (3) and (4) consider the effects of cross-border electricity trade and GDP
growth rate on the effective efficiency of electricity production from VREs, and add
robustness to the suggested results from models (1) and (2). Solar and wind
efficiency indices are created with the purpose of capturing the share of VREs in total
electricity production given their existing share in the overall installed capacity for
country i at time t. It is claimed that the effective efficiency of electricity production
increases as the index gets bigger.9 Furthermore, additional panel cointegration tests
are conducted to assess if there exist long term relationships among cross-border
electricity trade, GDP growth rate and each of our solar and wind efficiency indices
(See Appendix Table A.4). In all the cases, 4 out of 7 test statistics rejected the null
hypothesis of no cointegration. Hence, within the 2010-2016 period, we claim there
7 ‘se’ is abbreviation for solar efficiency. 8 ‘we’ is abbreviation for wind efficiency
9The mathematical formula of the index is the following:
(𝑠𝑜𝑙𝑎𝑟; 𝑤𝑖𝑛𝑑) 𝑒𝑓𝑓𝑖𝑐𝑖𝑒𝑛𝑐𝑦 =𝑒𝑙𝑒𝑐𝑡𝑟𝑖𝑐𝑖𝑡𝑦 𝑝𝑟𝑜𝑑𝑢𝑐𝑡𝑖𝑜𝑛 𝑓𝑟𝑜𝑚 (𝑠𝑜𝑙𝑎𝑟 𝑃𝑉; 𝑤𝑖𝑛𝑑) /𝑡𝑜𝑡𝑎𝑙 𝑒𝑙𝑒𝑐𝑡𝑟𝑖𝑐𝑖𝑡𝑦 𝑝𝑟𝑜𝑑𝑢𝑐𝑡𝑖𝑜𝑛 𝑐𝑎𝑝𝑎𝑐𝑖𝑡𝑦 𝑜𝑓 (𝑠𝑜𝑙𝑎𝑟 𝑃𝑉; 𝑤𝑖𝑛𝑑) /𝑡𝑜𝑡𝑎𝑙 𝑖𝑛𝑠𝑡𝑎𝑙𝑙𝑒𝑑 𝑐𝑎𝑝𝑎𝑐𝑖𝑡𝑦
30
existed a long term relationship between solar, wind efficiency indices and cross border trade as well as between solar, wind efficiency indices and GDP growth rate.
In Table 8 and Table 9 below, we report the estimates of specification (3) and (4) using panel data analysis with the fixed effects approach; to capture the integrated
effects of cross-border electricity trade and economic development on the effective
efficiencies of electricity production from VREs. We have chosen the time period
2010 to 2016 resulting in a smaller size of 329 observations for this analysis. The
reason behind this is to have a more balanced panel in which a relatively vast
majority of the countries in our sample have started producing electricity using solar
and wind energy sources. Prior to 2010 many countries had zero solar and/or wind
capacities, and this has caused our efficiency indices to be mathematically
incalculable for those countries. Considering the time period 2016 – 2018, even
though IRENA offers access to data of solar and wind capacities and generations of
all countries, electricity export and import data of the majority of countries in Asia
and the Americas are unavailable. Hence, it would not be possible to capture the
effects of cross-border trade in our world sample while including the 2016-2018
period.
Electricity demand is one of the dynamically decisive factors determining the level of
electricity production utilized from solar and wind energy sources. Yet, we cannot
use electricity demand in our regression equation directly. Since our efficiency
indices involve total electricity production in its numerator, using electricity demand
as a regressor would not be appropriate due to the high correlation between
31
regressor, we would introduce endogeneity to our model and cause our estimators to be less efficient. Hence, we have employed the GDP growth rate as an indicator of
economic development which would be reflective of electricity demand growth.
The Hausman tests for selecting between Fixed Effects and Random Effects in these
models do not give a clear answer. Nonetheless, we have chosen to employ the
Fixed Effects approach in specifications of (3) and (4) for an underlying reason. In
order to employ Random Effects in the specified models, we have to be able to claim
that cov (αi ,tradeit) = 0 ; which means that cross-border electricity trade is
uncorrelated with αi (the time-independent part of idiosyncratic error term ɛit ). This
is unlikely to hold true since the geographical disposition of any country i in the
sample can play a big part in the amount of cross-border electricity trade occurring
at time t. A simple illustration of this can be given over isolated countries in the
sample such as Australia and Japan where the ocean surrounds all land and these
countries do not have any border with other countries that enable interconnected
transmission lines. Hence, the cross-border trade of electricity is bound to be zero
for them. On the other hand, losing the information coming from the
time-independent geographical disposition is tolerable since we are not interested in
capturing the overall efficiency of VREs through these indices. The overall efficiency
of VREs would capture how many hours they produce electricity in a year under
dynamic weather conditions compared to how many hours they do not. Yet, we are
trying to find out the effects of cross-border trade on the effective efficiency levels
of VREs which only capture how much of the electricity they produce is supplied to
32
The empirical evidence we report supports that the rate of growth in the share of capacities of VREs may not result in an equivalent growth in the share of VREs in
total electricity production. Even though continuously investing in solar and wind capacities would definitely increase the level of electricity production from these
energy sources; significant differences can occur between the increases in the share
of capacity and in the share of electricity production. Three factors prominent in
creating this difference are the intermittent nature of VREs, physical constraints on
transmission and distribution capacities and fluctuations in load. All these can either
lead to potential curtailments in electricity supply or excess electricity production
from VREs that cannot be supplied to the system and going to waste. The likelihood
of potential curtailments and excess production increases significantly as the share
of VREs increase in the overall installed capacity of countries and when power
systems do not have enough flexibility to accommodate the production coming from
VREs. For power systems with relatively weak and small grids, or with ambitious
VREs deployment targets; it is very beneficial to proactively initiate reforms and
investments in the market that will provide additional flexibility to the system, even
at the early deployment stages of VREs (IEA, 2019). Within this context, we expect to
see that cross-border trade of electricity has positively affected the effective
efficiency of electricity production from VREs by providing additional flexibility to the
electricity supply systems of countries.
As can be seen from Fixed Effects columns in Tables 8 and 9, the interactive term of
cross-border electricity trade and GDP growth rate have positive relations with our
efficiency indices for solar and wind electricity production, at the 1% significance
33
with rising levels of cross-border trade, the amount of electricity utilized by solar and wind power generation rises. Cross-border trade of electricity enables countries to
gain access to a more diversified portfolio of power plants, producing electricity over a wider geographic area. By exploiting time and load differences among integrated
international markets, the excess power production of solar PV and wind turbines
that would have gone to waste otherwise can be utilized through exports. Also,
ancillary services that comprise the balancing mechanism of the electrical system
can be supported by electricity imports when unexpected curtailments occur in
VREs. The benefit of electricity imports would be realized to a greater extent as the
share of VREs increases in total installed capacity and electricity production from
high response fossil fuel-based power generation (natural gas power plants)
declines. Therefore, cross-border electricity trade fosters the effective production
efficiency of VREs, paving the way for the accelerated growth of renewable share in
overall electricity production. The results depicted in Table 8 and 9 provide the
necessary empirical evidence that cross-border trade of electricity adds significant
flexibility to the power system to better accommodate existing electricity production
from VREs. Even though it cannot be precisely known that which energy source
produces the electricity that is traded across borders; as cross-border electricity
trade increases, electricity production from VREs has an increased chance of being
utilized either in domestic or international markets. Further thesis can investigate
these indices for sub-Saharan African countries with rising levels of economic growth
34
Table 8: Effects of Cross-Border Trade on the Efficiency of Electricity Production from Solar PV (2010-2016)
Notes: ‘Solar Efficiency’ is an index created to capture efficiency of electricity production solar PV given its existing capacity. The index gives
the overall ratio of the respective share of solar PV in total electricity production and in total installed capacity. Efficiency increases as the ratio gets higher. Regressor ‘GDP’ is GDP growth rate. Cross section units consists of 47 countries and specified time period is 2010 to 2016. (***) means the parameter is significant at 1%. (**) means the parameter is significant at 5%. (*) means parameter is significant at 10%.
Dependent Variable: Solar Efficiency
Panel A: With-in group Fixed Effect Panel EGLS (Cross Section Weights)
Panel B: Random Effects (RE)
Panel EGLS (Cross Section Random Effects) Explanatory Variables Coefficient t-Statistic Coefficient t-Statistic trade 0.196** 2.58 -0.027* -1.68 GDP -0.755*** -4.80 -2.915 -3.57 trade*GDP 3.186*** 3.97 9.518 3.38 R2 0.960 0.019 R ̅2 0.953 0.010 Prob (F-statistic) 0.000 0.098 Number of Observations 329 34
35
Table 9: Effects of Cross-Border Trade on the Efficiency of Electricity Production from Wind (2010-2016)
Notes: : ‘Wind Efficiency’ is an index created to capture efficiency of electricity production from wind turbines given its existing capacity.
The index gives the overall ratio of the respective shares of wind in total electricity production and in total installed capacity. Efficiency increases as the ratio gets higher. Regressor ‘GDP’ is GDP growth rate. Cross section units consists of 47 countries and specified time period is 2010 to 2016. (***) means the parameter is significant at 1%. (**) means the parameter is significant at 5%. (*) means parameter is significant at 10%.
Dependent Variable: Wind Efficiency
Panel A: With-in group Fixed Effect Panel EGLS (Cross Section Weights)
Panel B: Random Effects (RE)
Panel EGLS (Cross Section Random Effects) Explanatory Variables Coefficient t-Statistic Coefficient t-Statistic trade 0.760*** 4.37 0.253** 2.52 GDP -1.568*** -6.31 -1.873*** -3.57 trade*GDP 4.167*** 2.92 4.436 1.42 R2 0.930 0.019 R̅2 0.917 0.010 Prob (F-statistic) 0.000 0.098 Number of Observations 329 35
36
CHAPTER V
CONCLUSION
In this thesis, we measured the integrated effects of cross-border electricity trade and electricity production from solar and wind energy sources; on the electricity
production from carbon-based natural gas power plants over the 1991-2018 period for 48 countries. The empirical evidence reveals that the overall electricity production
from natural gas, solar and wind energy sources are in an increasing path in our world sample over the specified time period. However, we also found that when solar and
wind electricity production increases in interconnected energy markets where
electricity is traded across borders, electricity production from natural gas power
plants decrease statistically significantly.
Under the circumstances created by climate emergency, many of the countries in the
world and their respective institutions pledged to an energy transition process to
renewable energy sources. Transformation in the power industries carries a vital role
in this process. Hence, pointing out the long-term relationship among carbon-based
and renewable energy sources in electricity production within a techno-economic
framework including cross-border trade is very important for long-term planning in
power industries. Considering the current amounts of electricity trade happening
across markets and the anticipated increases in the future with the interconnection
expansion plans of states like China and India; there exist an uncertainty about the
37
which type of energy source benefits (in terms of production rates) from the additional demand/supply flexibility cross-border trade creates within interconnected
markets. Our results demonstrated that among different types of energy sources with long term relationships in electricity production, solar and wind benefits from
cross-border trade and electricity production from carbon-based natural gas power plants
are exposed to curtailment effects. It can be anticipated from our results that
increasing levels of cross-border trade together along increasing solar and wind
capacities will benefit the energy transformation process in the long run.
Furthermore, we created an efficiency index both for solar and wind energy-based
electricity production. We conducted panel data analysis using the fixed effects
approach on 48 countries but this time over the 2010-2016 period where most of the
sample countries have started generating power from these renewable energy
sources. This time, we examined the integrated effects of cross-border electricity
trade with economic growth (as an indicator of growing electricity demand). Our
results showed that cross-border trade increases the chance of electricity produced
from intermittent solar and wind energy sources to be utilized either in domestic or
international markets. Hence, cross-border trade contributes significantly to their
effective efficiency levels of solar and wind electricity production. These findings also
add robustness to our inferences in the first model where it is argued that
38
APPENDIX
Table A.1: List of Sample Countries by Continent
Americas Asia Europe
Bolivia Australia Austria
Brazil Bangladesh Belgium
Canada China Czech Rep.
Chile India Denmark
Colombia Indonesia Finland
Costa Rica Israel France
El Salvador Japan Germany
Guatemala Jordan Greece
Mexico Lebanon Italy
Nicaragua Mongolia Netherlands
Panama New Zealand Norway
Paraguay Pakistan Poland
Peru Philippines Russian Federation
United States South Korea Spain
Uruguay Thailand Sweden
Switzerland
Turkey
39
Table A.2. Results of Panel Cointegration Test Among Variables in Model (1) (1991-2018)
Null Hypothesis: No cointegration
Distribution: All test statistics are normalized to be distributed under N (0,1)
Trend and Lag Assumptions: No deterministic trend - Automatic lag length selection based on SIC
Rejection Criteria: Following (Pedroni, 2004), if at least four out of seven test statistics have p-values less than 0.10, we reject the null of no
cointegration and consider selected variables cointegrated. (***) means the parameter is significant at 1%. (**) means the parameter is significant at 5%. (*) means parameter is significant at 10%.
Notes: ‘N.gas’ and ‘Solar’ are the logarithm of electricity production from natural gas power plants and solar PV. Trade’ is (electricity exports +
imports)/1st lag of total electricity production. Cross section units consists of 48 countries and specified time period is 1991 to 2018 Series Panel v-statistics Panel rho‐statistics Panel PP-statistics Panel ADF-statistics
Statistic Statistic Statistic Statistic
N.gas, Solar, Trade, Trade*Solar
-3.05 3.00 -2.34*** -2.31***
Group rho-statistics Group PP-statistics Group ADF-statistics
Statistic Statistic Statistic
N.gas, Solar, Trade, Trade*Solar
3.57 -2.51*** -4.86***
40
Table A.3. Results of Panel Cointegration Test Among Variables in Model (2) (1991-2018)
Null Hypothesis: No cointegration
Distribution: All test statistics are normalized to be distributed under N (0,1)
Trend and Lag Assumptions: No deterministic trend - Automatic lag length selection based on SIC
Rejection Criteria: Following (Pedroni, 2004), if at least four out of seven test statistics have p-values less than 0.10, we reject the null of no
cointegration and consider selected variables cointegrated. (***) means the parameter is significant at 1%. (**) means the parameter is significant at 5%. (*) means parameter is significant at 10%.
Notes: ‘N.gas’ and ‘Wind are the logarithm of electricity production from natural gas power plants and wind turbines. Trade’ is (electricity
exports + imports)/1st lag of total electricity production. Cross section units consists of 48 countries and specified time period is 1991 to 2018.
Series Panel v-statistics Panel rho‐statistics Panel PP-statistics Panel ADF-statistics
Statistic Statistic Statistic Statistic
N.gas, Wind, Trade, Trade*Wind
0.20 -0.91 -4.16*** -4.02***
Group rho-statistics Group PP-statistics Group ADF-statistics
Statistic Statistic Statistic
N.gas, Wind, Trade, Trade*Wind
1.58 -4.67*** -7.58***
41
Table A.4. Results of Panel Cointegration Test Among Variables in Model (3) and (4) (2010-2016)
Null Hypothesis: No cointegration
Distribution: All test statistics are normalized to be distributed under N (0,1)
Trend and Lag Assumptions: No deterministic trend - Automatic lag length selection based on SIC
Rejection Criteria: Following (Pedroni, 2004), if at least four out of seven test statistics have p-values less than 0.10, we reject the null of no
cointegration and consider selected variables cointegrated. (***) means the parameter is significant at 1%. (**) means the parameter is significant at 5%. (*) means parameter is significant at 10%. Notes: ‘GDP’ is GDP growth rate. Trade’ is (electricity exports + imports)/1st lag of total electricity production. Cross section units consists of 47 countries and specified time period is 2010 to 2016.
Series Panel v-statistics Panel rho‐statistics Panel PP-statistics Panel ADF-statistics
Statistic Statistic Statistic Statistic
Solar Efficiency, Trade, GDP, Trade*GDP
0.33 4.54 -2.33*** -1.74**
Wind Efficiency, Trade, GDP, Trade*GDP
-2.46 4.32 -7.43*** -4.46***
Group rho-statistics Group PP-statistics Group ADF-statistics
Statistic Statistic Statistic
Solar Efficiency, Trade, GDP, Trade*GDP
7.01 -13.16*** -7.98***
Wind Efficiency, Trade, GDP, Trade*GDP
6.82 -9.54*** -6.66***
42
Table A.5. Results of Panel Cointegration Test Among Variables in Model (1) with Coal (1991-2018)
Null Hypothesis: No cointegration
Distribution: All test statistics are normalized to be distributed under N (0,1)
Trend and Lag Assumptions: No deterministic trend - Automatic lag length selection based on SIC
Rejection Criteria: Following (Pedroni, 2004), if at least four out of seven test statistics have p-values less than 0.10, we reject the null of no
cointegration and consider selected variables cointegrated. (***) means the parameter is significant at 1%. (**) means the parameter is significant at 5%. (*) means parameter is significant at 10%.
Notes: ‘Coal’ and ‘Solar’ are the logarithm of electricity production from coal power plants and solar PV. Trade’ is (electricity exports +
imports)/1st lag of total electricity production. Cross section units consists of 48 countries and specified time period is 1991 to 2018. Series Panel v-statistics Panel rho‐statistics Panel PP-statistics Panel ADF-statistics
Statistic Statistic Statistic Statistic
Coal, Solar, Trade, Trade*Solar
-3.17 3.73 2.35 2.98
Group rho-statistics Group PP-statistics Group ADF-statistics
Statistic Statistic Statistic
Coal, Solar, Trade, Trade*Solar
3.26 -0.49 1.15