1941 http://journals.tubitak.gov.tr/medical/ © TÜBİTAK
doi:10.3906/sag-2008-124
Correlation between serum vitamin D level and dichotomous distribution of
hematological parameters in a cohort of 12709 patients
Oktay OLMUŞÇELİK1, Ömür Gökmen SEVİNDİK2,*
1Department of Internal Medicine, Faculty of Medicine, İstanbul Medipol University, İstanbul, Turkey 2Department of Hematology, Faculty of Medicine, Istanbul Medipol University, İstanbul, Turkey
* Correspondence: [email protected]
1. Introduction
Vitamin D3, a fat-soluble prohormone, is synthesized in the skin after exposure to sunlight. It is further metabolized in the liver and kidney to become active form of Vitamin D, 1,25-Dihydroxyvitamin D (1,25-(OH)2D). In the active form, (1alpha,25-(OH)2D), Vitamin D binds to its receptor (VDR) to modulate gene expression and regulate mainly ion homeostasis. It plays several roles in the body, influencing bone health as well as serum calcium and phosphate levels [1]. According to the degree of its deficiency, lack of Vitamin D may lead to the development of rickets or osteomalacia. Besides its effects on bone metabolism or calcium homeostasis, Vitamin D modulates growth, inflammation, neuromuscular immune function and possibly hematopoiesis [2-6].
Hematopoiesis occurs in the bone marrow and is strictly regulated with the help of various cytokines, hormones, growth factors, and even vitamins to supply for a steady state of the circulating red blood cells (RBC), white blood cells (WBC), and platelets (PLT). Lack or deficiency of any of these regulatory factors can potentially slow down the hematopoietic process and lead to a certain decrease in the production of any one or more of these three cell lines [7]. Vitamin D deficiency is generally associated with a slowed hematopoiesis and an outcome of varying degrees of peripheral blood cytopenia(s) [6].
Although, there are conflicting reports about the role of Vitamin D on hematopoiesis, there are numerous reports indicating a correlation between Vitamin D deficiency and anemia. Commonly proposed mechanisms, which relates
Background/aim: Recent evidence suggests that Vitamin D deficiency may be associated with varying degrees of peripheral blood
cytopenia(s). However, the effect of Vitamin D on hematopoiesis is largely unknown. According to predefined inclusion criteria, here we analyzed the correlation between serum Vitamin D level and hematological parameters.
Materials and methods: In the present cohort study, a total of 12.709 patients were screened. In the first data set, all patients were
included. However, in the second one, only patients (9.936) with no complete blood count (CBC) abnormality and any nutritional deficiency (Iron, Vitamin B12 and Folic acid) were evaluated. According to the level of Vitamin D levels, patients were divided into the four groups. Vitamin D level was 10 ng/mL in group 1, 10–20 ng/mL in group 2, 20–30 ng/mL in group 3, and above of 30 ng/mL in group 4. Hematological parameters were analyzed and compared with Vitamin D levels. Hb level and RBC, WBC, ANC, ALC counts were excepted as major hematological parameters.
Results: Median age of the 12709 subjects was 41 years and 61.9% was female. We have not observed statistically significant difference
between datasets regarding both demographic parameters and median Vitamin D levels. Posthoc analysis revealed a positive trend regarding major hematological parameters through group 2 (10–20 ng/ml) when compared to other Vitamin D groups except for platelet counts (All P values were <0.001). Regression analysis also revealed that patients who were classified under group 2 possessed a more potent hematopoiesis when compared to others in similar age, are same sex, and having similar baseline CRP values. In contrast to other cells, the number of thrombocytes were higher in group 1. Furthermore, all CBC and hemoglobin levels decreased with the increased level of Vitamin D except basophil.
Conclusion: Our study reports a correlation between major hematological parameters and Vitamin D levels in a particularly large
patient population who lacks a significant confounder like chronic illnesses or conditions which may change hematological parameters.
Key words: Vitamin D, hematopoiesis, normal, healthy, hematological parameters
Received: 16.08.2020 Accepted/Published Online: 07.11.2020 Final Version: 17.12.2020
Vitamin D deficiency to anemia, were the increased level of inflammatory cytokines and hepcidin, which directly suppresses hematopoiesis and interrupts iron recycling, and reduction in the production of erythropoietin [8]. This causal relationship was most pronounced in patients who had renal anemia and erythropoietin (EPO) hypo-responsiveness [9]. Some studies have documented a beneficial effect of Vitamin D replacement in patients who are diagnosed with iron deficiency anemia or anemia of chronic disorder, even in stabilization for a need of erythroid stimulating agent in patients with chronic kidney disorder [10, 11]. But there are also reports, there even exists a recently published systematic review and metaanalysis, showing no potential beneficial effect of Vitamin D replacement therapy on the treatment of supplementation on hemoglobin concentration or anemia [11,12]. Besides anemia, Vitamin D has also some ambivalent effect on the production and life span of white blood cells and platelets. Studies in vitro have shown that Vitamin D suppresses colony formation of normal human granulocyte macrophage progenitors (CFU-GM) and, by contrast, induces differentiation of colonies into monocyte-macrophages [13].
In this context, the role of the serum Vitamin D level and hematopoietic parameters is a matter of debate and needs a larger cohort of patient data. In addition, the net effect of increased levels of Vitamin D, which exceeds the normal threshold on hematopoiesis is not well defined. Some reports indicate even a negative correlation between hematological parameters and increased levels of Vitamin D [12, 14–17]. In this term, we have analyzed the correlation between Vitamin D and hematological parameters.
Further studies were necessary to understand exact mechanism of this effect of Vitamin D on hematopoiesis. For example a well-designed trial aiming to document the effect of Vitamin D on hematopoiesis should include serial bone marrow samples from patients who possess different levels of Vitamin D. In addition, the level of erythropoietin and other factors playing roles in hematopoiesis should also be evaluated. As such an approach is neither feasible nor acceptable, peripheral blood counts can be used as a surrogate to analyze the integrity of hematopoiesis.
2. Materials and methods
Ethical approval was obtained from the local ethical committee of Medipol University. Whole patient registry of Medipol Hospital Complexes, which consist of 8 different hospitals located in İstanbul, screened and patients who were admitted to check-up and outpatient internal medicine clinics and met the predefined inclusion criteria (Figure 1) enrolled in the study. In the present cohort study, 12.709 patients in total were screened from 2013 to 2019. In the first dataset (Dataset A) all patients were analyzed. However, in the second one (Dataset B),
only patients (9.936) with no complete blood count (CBC) abnormality and any nutritional deficiency (Iron, Vitamin B12 and Folic acid) were evaluated. We have summarized inclusion, exclusion criteria, and the production of two datasets (Dataset A & B) in a flow-chart (Figure 1).
First available concomitant Vitamin D level and CBC parameters of the subjects were recorded and analyzed. All samples were studied in the same central reference laboratory which is located in Medipol Mega Hospital with the same methodology and same reference ranges. Seasonal and locational Vitamin D deficiency was defined as harboring a Vitamin D level of 10 ng/mL or less, according to the national guidelines.
CBC levels were analyzed by Hematology Analyzer (XN-1000, SYSMEX, Osaka, Japan), CRP levels were analyzed by biochemistry auto-analyzer (Cobas 6000, Roche, Tokyo, Japan) with immunoturbidimetric method. Serum Vitamin D levels were analyzed by ECLIA – Elecsys Vitamin D total II - (Cobas 6000, Roche, Tokyo, Japan) with electrochemiluminescence immunological method. Methods were conducted according to the manufacturer protocols.
The relationship between the distribution of CBC parameters among different Vitamin D groups were analyzed and reported. Hb level and RBC, WBC, ANC, ALC counts were excepted as major hematological parameters
2.1 Statistical analysis
All statistical analysis was performed using SAS 9.4 software (SAS Institute Inc., Cary, NC, USA). Characterization of the study population was conducted using descriptive statistics including means and standard deviations of the mean if the variable has a normal distribution or median (range), otherwise. Discrete variables were expressed as frequency as percentages.
Correlation between different hematological parameters and vitamin D levels were assessed using Pearson’s and/or Spearman’s correlation tests. Beside the correlational linear analysis between hematological parameters and Vitamin D, we have decided to group Vitamin D levels according to the quartiles with a mandatory initial group including the patients who has a certain deficiency in Vitamin D.
Differences in hematological parameters among the four different Vitamin D groups were evaluated using analysis of variance (ANOVA) including Tukey’s posttest for pairwise comparison. Multivariate linear regression analysis was used to evaluate the global effect of potential confounders like age, sex, CRP level (reflecting the inflammatory status) on the predictive capability of normal vs. low or high levels of Vitamin D on individual hematological parameters. P value less than 0.05 was considered statistically significant.
3. Results
According to the distribution of Vitamin D levels, 4 different Vitamin D groups were generated. The demographics and the distribution of variables were given in Table 1. Group 1 consisted patients who harbor a Vitamin D level of less than 10 ng/mL, Group 2 consisted patients who had a Vitamin D level between 10–20 ng/mL, Group 3 consisted patients who had a Vitamin D level between 20 –30 ng/ mL and Group 4 consisted patients with a Vitamin D level above 30 ng/mL.
There was a significant correlation between Vitamin D levels and hematological parameters (Table 2). When analyzed according to the groups with a posthoc analysis, near all hematological parameters were significantly higher in Group 2 when compared with all other groups (Table 3). Results were accordingly similar in all datasets and trends of selected hematological parameters towards different Vitamin D groups were given in
Figure 2 (Dataset A and B). Remaining parameters were presented in Figure 3 (Datasets A and B).
Statistically significant independent predictor ability of Group 2, when compared with the other groups, was preserved when the analysis was adjusted for age, sex, and concomitant CRP levels (Table 3).
4. Discussion
The absolute threshold of Vitamin D deficiency is largely accepted as an illness. World Health Organization (WHO)
defines a deficient level as having a Vitamin D level of below 50 nmol/mL (less than 20 ng/mL) in infants1. National
Institute of Health (NIH) defines an inadequate level as less than 20 ng/mL in all age groups2. Although there is
no consensus on optimal levels of Vitamin D measured in serum, vitamin D level of less than 20 ng/mL (50 nmol per liter) is defined by most experts as vitamin D deficiency [2]. Our study indicates a deficiency rate of 58.2% in 12.709 healthy subject. An NHANES trial has documented a 41.6% deficiency of Vitamin D in a comparable US population regarding the same threshold of less than 20 ng/mL. But this prevalence was more pronounced in blacks (82.1 %) and hispanics (69.2 %) [18].
A well-documented epidemiological study is lacking regarding the Turkish population. Our study was not designed with an intent to document the prevalence of Vitamin D deficiency in the healthy Turkish population but, from a statistical and epidemiological standpoint, it can serve as a surrogate in this manner. And, our results indicate a double-edged sword in terms of the relationship between Vitamin D level and hematopoiesis. Subjects who harbor a Vitamin D level between 10–20 ng/mL has the best peripheral blood profiles. Vice versa, patients who have a Vitamin D level of below 10 ng/mL and patients who have a Vitamin D level of above 30 ng/mL have worse profiles regarding the hematological parameters.
In general, the functions and metabolic roles that Vitamin D outside the bone metabolism have always
been an interesting field for researchers. There has been a cumulative literature correlating Vitamin D deficiency with inflammation, cardiovascular disorders, and even cancer. Although Vitamin D gained a wide reputation with the new studies in the literature and replacement became a standard of care for many clinicians with an aim to increase Vitamin D up to 50 ng/mL or more, many recent reports still question this approach.
Manson et al., conducted a randomized, double-blind, placebo-controlled trial, with a two-by-two factorial design, to examine the benefits and risks of vitamin D3 (cholecalciferol) at a dose of 2000 IU per day and marine n−3 fatty acids at a dose of 1 g per day as the primary prevention of cancer and cardiovascular disease among 25,871 men who were 50 years of age or older and women who were 55 years of age or older. This trial has shown
no benefit of replacing Vitamin D on primary prevention of cancer or cardiovascular disease despite an increase of the mean Vitamin D level from 29.8 ng/mL to 41.8 ng/ mL after replacement [19]. In addition, Ginde et al. have also conducted a randomized, double-blind, placebo-controlled, phase 3 trial of early vitamin D3 supplementation in critically ill, vitamin D-deficient patients who were at high risk of death. They have concluded that early administration of high-dose enteral vitamin D3 did not provide more advantage over placebo with respect to 90-day mortality or other nonfatal outcomes among critically ill, vitamin D-deficient patients [20].
Pittas et.al randomized 2423 prediabetic participants into placebo and Vitamin D supplementation groups. They have concluded that among persons at high risk of type 2 diabetes and not selected for vitamin D insufficiency,
Table 1. The demographics and laboratory values of the patients included in 2 different
datasets*. Dataset A (n = 12,709) Dataset B (n = 9936) Age (years) 41 (18–112) 41(18–96) Sex (F/M-%) 61.9 / 38.1 57.2 / 42.8 Vitamin D Level (ng/mL) 17.29 (1.06–98.05) 17.54 (3–99.20) Number of Subjects - n, (%) Group 1 3215 (25.3) 2332 (23.5) Group 2 4181 (32.9) 3380 (34) Group 3 2788 (21.9) 2248 (22.6) Group 4 2525 (19.9) 1976 (19.9) CRP (mg/L) 1.45 (0–5) 1.47 (0–5) Hb (g/dL) 13.46±1.73 13.93±1.20 RBC (106/µL) 4.79±0.54 4.87±0.46 MCV (fl) 83.96±5.79 84.77±4.68 RDW (%) 13.78±1.55 13.43±1.08 WBC (103/µL) 6.78±1.45 6.91±1.37 ANC (103/µL) 3.75±1.09 3.80±1.04 ALC (103/µL) 2.24±0.64 2.30±0.61 AMoC (103/µL) 0.58±0.17 0.59±0.17 AEoC (103/µL) 0.18±0.15 0.19±0.16 ABaC (103/µL) 0.03±0.02 0.03±0.02 Plt (103/µL) 241.10±60.99 242.05±52.74 MPV (fl) 10.23±0.97 10.23±0.89 PDW (fl) 12.22±2.01 12.22±1.92
*CRP: C Reactive Protein, Hb: Hemoglobin, RBC: Red Blood Cells, MCV: Mean Corpuscular Volume, RDW: Red Cell Distribution Width, WBC: White Blood Cells, ANC: Absolute Neutrophil Count, ALC: Absolute Lymphocyte Count, AMoC: Absolute Monocyte Count, AEoC: Absolute Eosinophil Count, ABaC: Absolute Basophil Count, Plt: Platelets, MPV: Mean Platelet Volume, PDW: Platelet Distribution Width
Table 2. Correlation matrix of different hematological parameters and
Vitamin D.
Dataset A
(n = 12,709) Dataset B(n = 9936) * Vit D (r and P values)
Age 0.117 <0.001† 0.112 <0.001† CRP (mg/l) –0.010 0.256 –0.017 0.092 Hb (g/dL) 0.027 0.002† - 0.020 0.044† RBC (106/µL) –0.043 <0.001† –0.057 <0.001† MCV (fl) 0.062 <0.001† 0.012 0.227 RDW (%) –0.023 0.009† 0.034 <0.001† WBC (103/µL) –0.043 <0.001† –0.046 <0.001† ANC (103/µL) –0.036 <0.001† –0.031 0.002† ALC (103/µL) –0.016 <0.001† –0.042 <0.001† AMoC (103/µL) –0.002 0.811 –0.004 0.674 AEoC (103/µL) - 0.020 0.027† –0.031 0.002† ABaC (103/µL) 0.014 0.106 0.018 0.067 Plt (103/µL) - 0.059 <0.001† –0.029 0.004† MPV (fl) 0.014 0.123 0.011 0.283 PDW (fl) 0.005 0.541 0.006 0.558 *Bivariate correlation analysis between Vitamin D levels and hematological parameters
† P < 0.05.
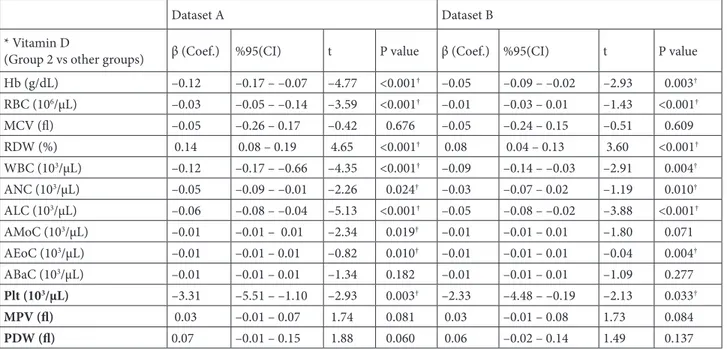
Table 3. Regression model adjusted for age, gender and CRP*
Dataset A Dataset B
* Vitamin D
(Group 2 vs other groups) β (Coef.) %95(CI) t P value β (Coef.) %95(CI) t P value
Hb (g/dL) –0.12 –0.17 – –0.07 –4.77 <0.001† –0.05 –0.09 – –0.02 –2.93 0.003† RBC (106/µL) –0.03 –0.05 – –0.14 –3.59 <0.001† –0.01 –0.03 – 0.01 –1.43 <0.001† MCV (fl) –0.05 –0.26 – 0.17 –0.42 0.676 –0.05 –0.24 – 0.15 –0.51 0.609 RDW (%) 0.14 0.08 – 0.19 4.65 <0.001† 0.08 0.04 – 0.13 3.60 <0.001† WBC (103/µL) –0.12 –0.17 – –0.66 –4.35 <0.001† –0.09 –0.14 – –0.03 –2.91 0.004† ANC (103/µL) –0.05 –0.09 – –0.01 –2.26 0.024† –0.03 –0.07 – 0.02 –1.19 0.010† ALC (103/µL) –0.06 –0.08 – –0.04 –5.13 <0.001† –0.05 –0.08 – –0.02 –3.88 <0.001† AMoC (103/µL) –0.01 –0.01 – 0.01 –2.34 0.019† –0.01 –0.01 – 0.01 –1.80 0.071 AEoC (103/µL) –0.01 –0.01 – 0.01 –0.82 0.010† –0.01 –0.01 – 0.01 –0.04 0.004† ABaC (103/µL) –0.01 –0.01 – 0.01 –1.34 0.182 –0.01 –0.01 – 0.01 –1.09 0.277 Plt (103/µL) –3.31 –5.51 – –1.10 –2.93 0.003† –2.33 –4.48 – –0.19 –2.13 0.033† MPV (fl) 0.03 –0.01 – 0.07 1.74 0.081 0.03 –0.01 – 0.08 1.73 0.084 PDW (fl) 0.07 –0.01 – 0.15 1.88 0.060 0.06 –0.02 – 0.14 1.49 0.137 *Independent variables included in the model are: Vitamin D groups (Group 2 vs others), sex, age and CRP levels, dependent variables were hematological parameters accordingly.
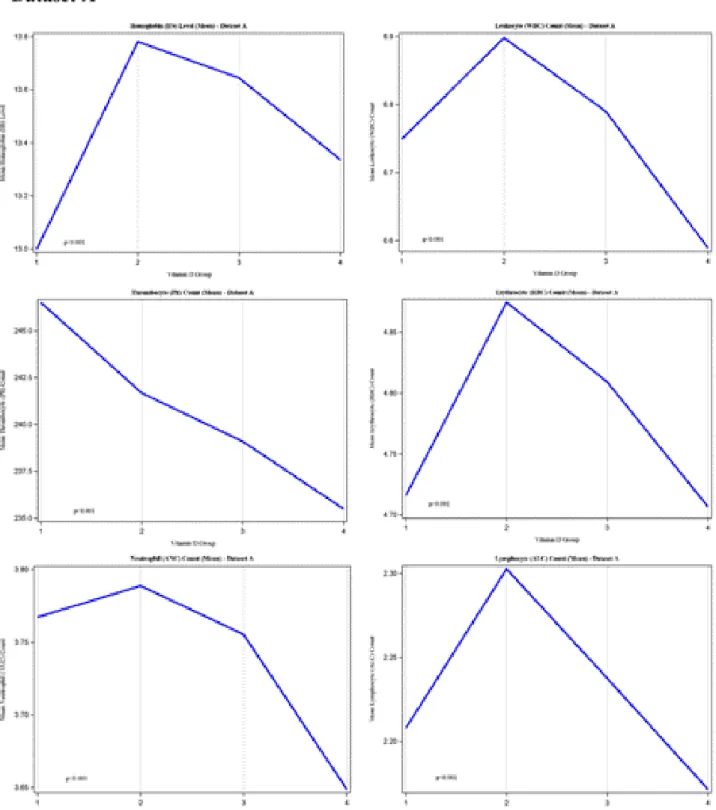
Figure 2. Trends of hematological parameters towards different Vitamin D groups (Datasets A and B). We have not observed any
significant difference between Datasets A and B. Compared to Group 2 (Vitamin D was less than 10 ng/dL), low level of hemoglobin was observed in Group 1 (Vitamin D was between 10–20 ng/dL), which was associated with the decreased number of erythrocytes, leukocytes, and lymphocytes, while the number of thrombocytes was higher, and the number of neutrophils was not significantly different. Notably that all these parameters were decreased in group 4 (Vitamin D was above of 30 ng/dL). The number of patients/per groups were given in Table 1. *One Way ANOVA test was used to compare the means of hematological parameters in different Vitamin D groups.
Figure 2. (Continued).
vitamin D3 supplementation at a dose of 4000 IU per day did not result in lowering the risk of diabetes significantly compared to placebo despite a well pronounced mean Vitamin D levels between two groups (54.3 vs 28.2 ng/ mL) [21]. In a metaanalysis of 33 randomized trials, effects
of supplementation with calcium, vitamin D, or both on fracture rates were investigated in older community-dwelling adults (age ≥ 50). There was no reduction in risk for hip fracture or vertebral, nonvertebral, and total fractures for any supplementation intervention. The
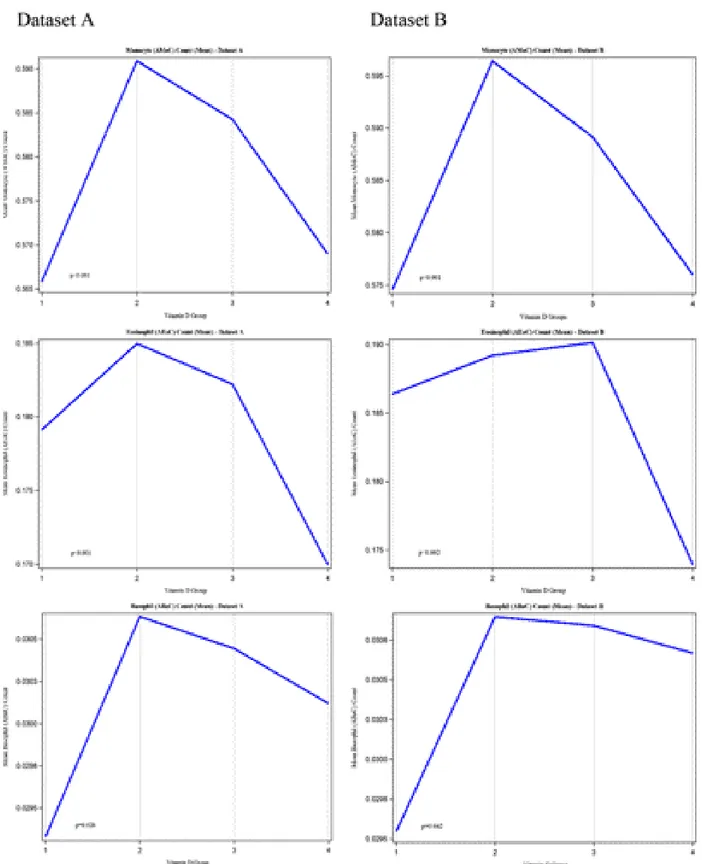
Figure 3. Trends of hematological parameters in different Vitamin D groups (Datasets A and B). We have not observed any significant
difference between Datasets A and B. Compared to Group 2 (Vitamin D was less than 10 ng/dL), low number of monocytes, and basophiles were observed in Group 1 (Vitamin D was between 10–20 ng/dL), while eosinophiles were not affected significantly. Notably that both the number of monocytes and eosinophiles were decreased in Group 4 (Vitamin D was above of 30 ng/dL), while the number of basophiles were not changed significantly. The number of patients per groups were given in Table 1. *One Way ANOVA test was used to compare the means of hematological parameters in different Vitamin D groups.
results applied to subgroups with 25-hydroxyvitamin D levels lower than 20 ng/mL or with previous fractures [22].
Despite all these clear evidences showing no benefit of routine Vitamin D replacement on any medical outcome, prescribing Vitamin D supplements in general practice aiming very high levels of 25(OH) Vitamin D still remains as a well-accepted clinical approach.
There are also conflicting data in terms of the benefit of Vitamin D replacement on hematological parameters. Arabi et al. have published a systematic review and metaanalysis with a purpose to investigate the effect of vitamin D supplements on hemoglobin concentration in subjects aged 17.5–68 years old using randomized controlled trials (RCTs), and they concluded that supplementation with vitamin D had no significant effect on hemoglobin and ferritin levels, while positive effects on transferrin saturation and iron status were observed [12].
Since the impact of Vitamin D on red blood cell formation has not been well studied so far, Doudin et al. aimed to assess the putative link between serum 25(OH) Vitamin D concentrations and hematological markers of erythropoiesis in a large cohort of German adolescents aged 11 to 17. They were able to demonstrate significant and inverse correlations between 25(OH)D levels and several hematological parameters including hemoglobin concentration, mean corpuscular hemoglobin, red blood cell count, and soluble transferrin receptor, whereas, in contrast, serum 25(OH)D was positively correlated to the mean corpuscular volume of erythrocytes. Also, multivariate models have confirmed an inverse correlation between Vitamin D sufficiency and hematological parameters. Unfortunately, they were not able to conclude a specific group in which patients showed the highest tendency to a healthy erythropoiesis. Their data lacked among other cell lines of hematopoiesis like white blood cells or thrombocytes [17].
Our large enough observational study clearly indicates a worsened hematopoiesis in patients with relatively higher Vitamin D levels in both general population (Dataset A) and patients who harbors no baseline hematological abnormality and any deficiency in iron or Vitamin B12
(Dataset B). Hospital-based screening should be noted as a main limitation to our current study. A population-based screening study should be conducted in order to reflect an epidemiologically relevant data. Nonetheless, as indicated in the methodology of our current manuscript, the majority of patients have visited check-up clinics, and a refined dataset (Dataset B) also reflected parallel results when compared with the whole population (Dataset A). Strength of our study is that it draws a clear picture regarding the parameters in specified Vitamin D Groups except for thrombocyte count. Thrombocyte count showed a constant decline with increasing Vitamin D levels. Current literature reports correlational analysis between hematological parameters and Vitamin D but lacks a grouped approach in documenting a maximal level in any of the groups. We believe that this will induce some mechanistic researches to document this kind of schizophrenic effect of Vitamin D on hematological parameters and hematopoiesis.
5. Conclusion
Our study reports a statistically significant correlation between major hematological parameters and Vitamin D levels in a particularly large patient population who lacks a significant confounder like chronic illnesses or conditions which can contribute to and potentially serves as a bias. Furthermore, the group who has a maximal capacity of hematopoiesis are the ones harboring Vitamin D levels between 10–20 ng/mL.
Acknowledgments/disclaimers/conflict of interest
All authors declare no conflict of interest that may have influenced either the conduct or the presentation of the research.
This study was not funded by any organization.
Informed consent
Ethical approval was obtained from the local ethical committee of Medipol University (Approval No: 672, Date: 14.11.2018)
References
1. Bikle DD. Vitamin D metabolism, mechanism of action, and clinical applications. Chemistry and Biology 2014; 21 (3): 319-329. doi 10.1016/j.chembiol.2013.12.016
2. Holick MF. Vitamin D deficiency. New England Journal of Medicine 2007; 357 (3): 266-281. doi 10.1056/NEJMra070553 3. Martens PJ, Gysemans C, Verstuyf A, Mathieu AC. Vitamin
D’s effect on immune function. Nutrients 2020; 12 (5): doi 10.3390/nu12051248
4. Yamamoto E., Jorgensen TN. Immunological effects of vitamin D and their relations to autoimmunity. Journal of Autoimmunity 2019; 100 7-16. doi 10.1016/j.jaut.2019.03.002 5. Katayama, Y. Vitamin D receptor: A critical regulator of
inter-organ communication between skeletal and hematopoietic systems. Journal of Steroid Biochemistry and Molecular Biology 2019; 190 281-283. doi 10.1016/j.jsbmb.2019.02.001
6. Medrano, M, Carrillo-Cruz E, Montero I, Perez-Simon JA. Vitamin D: Effect on haematopoiesis and immune system and clinical applications. Interenational Journal of Molecular Science 2018; 19 (9): doi 10.3390/ijms19092663
7. Smith, BR. Regulation of hematopoiesis. Yale Journal of Biology and Medicine 1990; 63 (5): 371-380. pmid: 2293498 8. Smith EM, Tangpricha V. Vitamin D and anemia: Insights into
an emerging association. Current Opinion in Endocrinology Diabetes and Obesity 2015; 22 (6): 432-438. doi 10.1097/ MED.0000000000000199
9. Icardi A, Paoletti E, De Nicola L, Mazzaferro S, Russo R et al. Renal anaemia and epo hyporesponsiveness associated with vitamin D deficiency: The potential role of inflammation. Nephrology Dialysis and Transplant 2013; 28 (7): 1672-1679. doi 10.1093/ndt/gft021
10. Riccio E, Sabbatini M, Bruzzese D, Capuano I, Migliaccio S et al. Effect of paricalcitol vs calcitriol on hemoglobin levels in chronic kidney disease patients: A randomized trial. PLoS One 2015; 10 (3): e0118174. doi 10.1371/journal.pone.0118174 11. Goicoechea M, Vazquez MI, Ruiz MA, Gomez-Campdera F,
Perez-Garcia R et al. Intravenous calcitriol improves anaemia and reduces the need for erythropoietin in haemodialysis patients. Nephron 1998; 78 (1): 23-27. doi 10.1159/000044877 12. Arabi SM, Ranjbar G, Bahrami LS, Vafa M, Norouzy A.
The effect of vitamin D supplementation on hemoglobin concentration: A systematic review and meta-analysis. Nutrition Journal 2020; 19 (1): 11. doi 10.1186/s12937-020-0526-3
13. Takahashi T, Suzuki A, Ichiba S, Okuno Y, Sugiyama H et al. Effect of 1,25(oh)2d3 on normal human cfu-gm: Target cells of the agent in the suppression of colony formation and induction of macrophage colonies. International Journal of Hematology 1991; 54 (1): 57-63. pmid 1954352
14. Uwaezuoke SN. Vitamin D deficiency and anemia risk in children: A review of emerging evidence. Pediatric Health Medicine and Therapeutics 2017; 8 47-55. doi 10.2147/PHMT. S129362
15. Monlezun DJ, Camargo CA, Mullen Jr. JT, Quraishi SA. Vitamin d status and the risk of anemia in community-dwelling adults: Results from the national health and nutrition examination survey 2001-2006. Medicine (Baltimore) 2015; 94 (50): e1799. doi 10.1097/MD.0000000000001799
16. Hall AC, Juckett MB. The role of vitamin d in hematologic disease and stem cell transplantation. Nutrients 2013; 5 (6): 2206-2221. doi 10.3390/nu5062206
17. Doudin A, Becker A, Rothenberger A, Meyer T. Relationship between serum 25-hydroxyvitamin d and red blood cell indices in german adolescents. European Journal of Pediatrics 2018; 177 (4): 583-591. doi 10.1007/s00431-018-3092-3 18. Forrest KY, Stuhldreher WL. Prevalence and correlates of
vitamin d deficiency in us adults. Nutrition research 2011; 31 (1): 48-54. doi 10.1016/j.nutres.2010.12.001
19. Manson JE, Cook NR, Lee IM, Christen W, Bassuk SS et al. Vitamin d supplements and prevention of cancer and cardiovascular disease. New England Journal of Medicine 2019; 380 (1): 33-44. doi 10.1056/NEJMoa1809944
20. Ginde AA, Talmor D, V Investigators, L members of the National Heart, and PCTN Blood Institute. High-dose vitamin d3 for critically ill vitamin d-deficient patients. Reply. New England Journal of Medicine 2020; 382 (17): 1670-1671. doi 10.1056/NEJMc2000993
21. Pittas AG, Dawson-Hughes B, Sheehan P, Ware JH, Knowler WC et al. Vitamin D supplementation and prevention of type 2 diabetes. New England Journal of Medicine 2019; 381 (6): 520-530. doi 10.1056/NEJMoa1900906
22. Zhao JG, Zeng XT, Wang J, Liu L. Association between calcium or vitamin D supplementation and fracture incidence in community-dwelling older adults: A systematic review and meta-analysis. Journal of the American Medical Association 2017; 318 (24): 2466-2482. doi 10.1001/jama.2017.19344