Introduction
Fish meal provides a high quality protein and a fat rich in long chain omega-3 fatty acids, DHA and EPA (1). Fish meal is valuable not only for the quantity but also the quality of its protein. By this is meant that the amino
acids that make up the protein are present in just the right balance for animal or human nutrition. Not only is the balance of amino acids in fish meal suitable for animal feeding, but the availability of the essential amino acids is also greater in fish meal than for example in meat meal
Protein and Lipid Content and Fatty Acid Composition of Anchovy
Meal Produced in Turkey
Hülya TURAN*, Yalç›n KAYA, ‹brahim ERKOYUNCU
Department of Fishing and Processing Technology, Faculty of Fisheries, Ondokuz May›s University, Sinop - TURKEY
Received: 23.03.2007
Abstract: The aim of this research was to determine the fatty acid composition and lipid and protein levels of anchovy meal produced
during the commercial fishing period.
The protein content was 74.69%, 76.17% and 74.40% in November, December and January, respectively. The lipid content ranged from 8.57% to 9.14% for anchovy meal produced during the fishing season. The total saturated fatty acid content was 33.25%, 33.46%, and 33.61% in November, December and January, respectively. Within the saturated fraction, the major fatty acid was palmitic acid (C16:0), the content of which was 20.30%, 19.96% and 20.66%, respectively. The monounsaturated fatty acid contents
ranged from 20.23% to 21.62%. Concerning the monounsaturated fatty acids, oleic acid (C18:1n-9) was present in larger percentages (12.29% to 13.44%) than the others. Among polyunsaturated fatty acids the largest concentration was for docosahexaenoic acid (DHA, C22:6n-3), varying from 17.44% to 19.16%. The eicosapentaenoic acid (EPA, C20:5n-3) content, which is another important fatty acid, was between 7.52% and 8.36%. The concentrations of n-3 PUFA (27.04%-27.95%) of anchovy meal were higher than those of n-6 PUFA (4.14%-4.95%). The ratio of n-3 to n-6 fatty acids of anchovy meal was 5.47 in November, 6.17 in December, and 6.75 in January.
Key Words: Anchovy meal, protein, lipid, fatty acids, fish meal
Türkiye’de Üretilen Hamsi Ununun Ya¤ Asit Kompozisyonu ile Protein ve Ya¤ Miktar› Özet: Bu araflt›rmada, ticari avc›l›k süresi boyunca üretilen hamsi ununun ya¤ asit kompozisyonu ile protein ve ya¤ miktarlar›n›n
belirlenmesi amaçland›.
Protein miktar› Kas›m, Aral›k ve Ocakta s›ras›yla % 74,69, % 76,17 ve % 74,40 olarak belirlendi. Avlama sezonu boyunca üretilen hamsi ununun ya¤ miktar› % 8,57 ile % 9,14 aras›nda de¤iflti. Toplam doymufl ya¤ asiti miktar› Kas›m, Aral›k ve Ocakta s›ras›yla % 33,25, % 33,46 ve % 33,61 olarak belirlendi. Doymufl k›s›mda temel ya¤ asiti % 20,30, % 19,96 ve % 20,66 ile palmitik asit (C16:0) oldu. Tekli doymam›fl ya¤ asitleri miktar› % 20,23 ile % 21,62 aras›nda de¤iflti. Tekli doymam›fl ya¤ asitlerinden oleik
asit (C18:1n-9) di¤erlerinden daha büyük miktarda (% 12,29 ile % 13,44 aras›nda) bulundu. Çoklu doymam›fl ya¤ asitleri aras›nda en büyük konsantrasyon % 17,44 ile % 19,16 aras›nda de¤iflen miktarda dokosaheksaenoik asit (DHA, C22:6n-3) oldu. Di¤er önemli ya¤
asiti olan eikosapentaenoik asit (EPA, C20:5n-3) miktar› araflt›rma süresince % 7,52 ve % 8,36 aras›nda bulundu. Bu çal›flmada, hamsi ununun n-3 PUFA (% 27,04-% 27,95) miktar› n-6 PUFA (% 4,14-% 4,95)’dan daha yüksek bulundu. Hamsi ununun n-3/n-6 ya¤ asitleri oran› Kas›mda 5,47, Aral›kta 6,17 ve Ocakta 6,75 olarak belirlendi.
Anahtar Sözcükler: Hamsi unu, protein, ya¤, ya¤ asitleri, bal›k unu
(2). The protein in fish meal has a high proportion of essential amino acids in a highly digestible form, particularly methionine plus cystine, lysine, threonine and tryptophan (1). Fish meal is also a valuable source of the minerals calcium, phosphorous, magnesium and potassium, and of trace elements, notably zinc, iodine, iron, copper, manganese, cobalt, selenium and fluorine (2). In addition, it contains at relatively high levels A, D and B complex vitamins (1).
The world’s total fish meal production is around 6.5 million tons per year, of which aquaculture uses 2 million tons (31%). At present, the remaining two-thirds of the fish meal produced is used in feed for land animals. An increase in the amounts of fish meal used for fish feed is far more likely to come through a reduction in the amount used for pig and poultry feed, rather than an increase in either the pelagic fish catch or an increase in the proportion of the total catch used for these products (3). The composition of fish meal can vary depending upon the substrate and the method being used to prepare the meal. A whole meal made from fatty fish like herring might contain about 71% protein, 9% fat, 8% water and 12% minerals, whereas a meal made mainly from white fish and white fish offal and dried to the same extent will contain about 66% protein, 5% fat, 8% water and 21% minerals (2).
Total fishery production in Turkey was 627,847 t in 2002, 373,000 t of which was anchovy. Anchovy is usually caught commercially by purse-seine between November and January, and has a great economic importance for the fishmeal and fish oil industry in Turkey. Approximately 42% (156,000 t) of the annual anchovy production is used in the fish meal and fish oil industry in Turkey (4).
The aim of this research was to determine the fatty acid composition and protein and lipid levels of anchovy meal produced during the commercial fishing season.
Materials and Methods
Raw Materials
Anchovy meal (approximately 2 kg) was obtained from a local fish meal and oil factory in Sinop (Turkey) monthly from November to January 2003.
Chemical Analyses
Crude protein content was determined according to the AOAC procedure (981.10) (5). Protein was calculated as Nx6.25. Crude lipid content was determined by acid digestion prior to continuous extraction using petroleum ether (b.p. 40-60 °C) in a Soxtec system (945.16) (5). Fatty acid analyses were carried out by the IUPAC II.D.19 method using a Perkin Elmer Autosystem XL Gas Chromatograph equipped with SP-2330 and a flame ionization detector (FID) (6). Separation of fatty acid methyl esters was achieved on a fused silica capillary column (30 m x 0.25 mm x 0.20 µm film thickness). The oven temperature was 120 °C for 2 min, programmed to increase to 220 °C at a heating rate of 5 °C/min, and then held at this temperature for 15 min. The injector and detector temperatures were maintained at 240 and 250 °C, respectively. The carrier gas was helium 10 psi with a split ratio of 1:50. The air and hydrogen pressures were 338 and 45 ml/min, respectively. Results were expressed as the percentage of each fatty acid with respect to the total fatty acids.
Statistic Analysis
Data analysis was carried out with the t-test in Microsoft Excel. Differences were studied at the P < 0.05 level.
Results
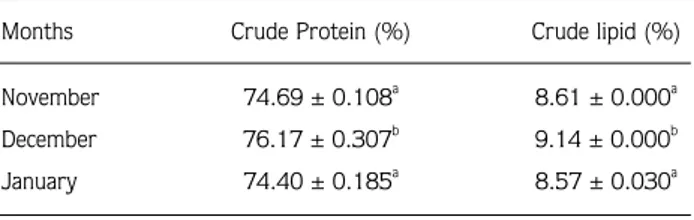
The protein and lipid contents of anchovy meal are shown in Table 1.
The protein content ranged from 74.40% to 76.17% for anchovy meal during the fishing season (Table 1). Protein content was significantly higher (P < 0.05) in December than in the other months. The lipid contents of anchovy meal were 8.61%, 9.14% and 8.57% in November, December and January, respectively, and they were significantly different (P < 0.05) in December than
Table 1. The protein and lipid contents of anchovy meal.
Months Crude Protein (%) Crude lipid (%)
November 74.69 ± 0.108a 8.61 ± 0.000a
December 76.17 ± 0.307b 9.14 ± 0.000b
January 74.40 ± 0.185a 8.57 ± 0.030a
Values are means of triplicate determination ± standard error
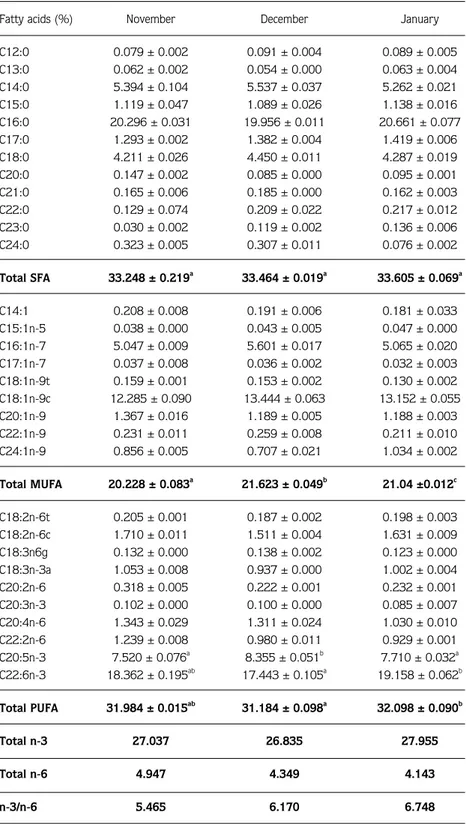
Table 2. The fatty acids composition of anchovy meal.
Fatty acids (%) November December January
C12:0 0.079 ± 0.002 0.091 ± 0.004 0.089 ± 0.005 C13:0 0.062 ± 0.002 0.054 ± 0.000 0.063 ± 0.004 C14:0 5.394 ± 0.104 5.537 ± 0.037 5.262 ± 0.021 C15:0 1.119 ± 0.047 1.089 ± 0.026 1.138 ± 0.016 C16:0 20.296 ± 0.031 19.956 ± 0.011 20.661 ± 0.077 C17:0 1.293 ± 0.002 1.382 ± 0.004 1.419 ± 0.006 C18:0 4.211 ± 0.026 4.450 ± 0.011 4.287 ± 0.019 C20:0 0.147 ± 0.002 0.085 ± 0.000 0.095 ± 0.001 C21:0 0.165 ± 0.006 0.185 ± 0.000 0.162 ± 0.003 C22:0 0.129 ± 0.074 0.209 ± 0.022 0.217 ± 0.012 C23:0 0.030 ± 0.002 0.119 ± 0.002 0.136 ± 0.006 C24:0 0.323 ± 0.005 0.307 ± 0.011 0.076 ± 0.002 Total SFA 33.248 ± 0.219a 33.464 ± 0.019a 33.605 ± 0.069a C14:1 0.208 ± 0.008 0.191 ± 0.006 0.181 ± 0.033 C15:1n-5 0.038 ± 0.000 0.043 ± 0.005 0.047 ± 0.000 C16:1n-7 5.047 ± 0.009 5.601 ± 0.017 5.065 ± 0.020 C17:1n-7 0.037 ± 0.008 0.036 ± 0.002 0.032 ± 0.003 C18:1n-9t 0.159 ± 0.001 0.153 ± 0.002 0.130 ± 0.002 C18:1n-9c 12.285 ± 0.090 13.444 ± 0.063 13.152 ± 0.055 C20:1n-9 1.367 ± 0.016 1.189 ± 0.005 1.188 ± 0.003 C22:1n-9 0.231 ± 0.011 0.259 ± 0.008 0.211 ± 0.010 C24:1n-9 0.856 ± 0.005 0.707 ± 0.021 1.034 ± 0.002 Total MUFA 20.228 ± 0.083a 21.623 ± 0.049b 21.04 ±0.012c C18:2n-6t 0.205 ± 0.001 0.187 ± 0.002 0.198 ± 0.003 C18:2n-6c 1.710 ± 0.011 1.511 ± 0.004 1.631 ± 0.009 C18:3n6g 0.132 ± 0.000 0.138 ± 0.002 0.123 ± 0.000 C18:3n-3a 1.053 ± 0.008 0.937 ± 0.000 1.002 ± 0.004 C20:2n-6 0.318 ± 0.005 0.222 ± 0.001 0.232 ± 0.001 C20:3n-3 0.102 ± 0.000 0.100 ± 0.000 0.085 ± 0.007 C20:4n-6 1.343 ± 0.029 1.311 ± 0.024 1.030 ± 0.010 C22:2n-6 1.239 ± 0.008 0.980 ± 0.011 0.929 ± 0.001 C20:5n-3 7.520 ± 0.076a 8.355 ± 0.051b 7.710 ± 0.032a C22:6n-3 18.362 ± 0.195ab 17.443 ± 0.105a 19.158 ± 0.062b Total PUFA 31.984 ± 0.015ab 31.184 ± 0.098a 32.098 ± 0.090b Total n-3 27.037 26.835 27.955 Total n-6 4.947 4.349 4.143 n-3/n-6 5.465 6.170 6.748
Values are means of duplicate determination ± standard error
a, b, c (→): Statistical significance of differences between months (P < 0.05) SFA: Saturated Fatty Acids
MUFA: Monounsaturated Fatty Acids PUFA: Polyunsaturated Fatty Acids
in November and January. The fatty acid profile of anchovy meal is listed in Table 2.
The total saturated fatty acid content of anchovy meal was 33.25%, 33.46% and 33.61% in November, December and January, respectively, and the differences between the months were insignificant (P > 0.05). Within the saturated fraction, the major fatty acid was palmitic acid (C16:0), the content of which was 20.30%, 19.96% and 20.66% during the fishing season. The monounsaturated fatty acid contents ranged from 20.23% to 21.62% (Table 2) and oleic acid (C18:1n-9) was present in larger percentages (12.29% to 13.44%) than the others. Some changes in the percentages of polyunsaturated fatty acids (PUFA) were observed during the processing (Table 2). Concerning the polyunsaturated fatty acids, eicosapentaenoic acid (EPA, C20:5n-3) and docosahexaenoic acid (DHA, C22:6n-3) contents were higher than those of other polyunsaturated fatty acids. Among polyunsaturated fatty acids the largest concentration was for DHA, varying from 17.44% to 19.16%. The highest value (19.16%) was in January, while the lowest one (17.44%) was in December. EPA, which is another important polyunsaturated fatty acid, was between 7.52% and 8.35%. The concentrations of n-3 PUFA (27.04%-27.95%) of anchovy meal were higher than those of n-6 PUFA, (4.14%-4.95%), and the ratio of n-3 to n-6 of anchovy meal was 5.47 in November, 6.17 in December and 6.75 in January.
Discussion
In our study, the protein content of anchovy meal was higher than that in fish meal produced from fatty fish. Koning (7) found protein values of 61.56%-68.26% in 243 fish meals (anchovy, red-eye or pilchard meals) produced by 7 factories during 1996-1999. In addition, Kratzer et al. (8) and Bimbo (9) reported the protein content of anchovy fish meal as 63%-66%.
The lipid content of fish meal produced from fatty fish such as herring and anchovy changes between 7% and 13% even though it depends on the type of fish, and the season during which it was caught and processed (10). In our study, the lipid content of anchovy meal was between those values (8.61%, 9.14% and 8.57%). Koning (7) found values of 10.28%-14.49% in 243 fish meals.
Within the saturated fraction, the major fatty acid was palmitic acid (C16:0), the content of which was 20.30%, 19.96% and 20.66% during the fishing season. Barlow
and Pike (10) found a palmitic acid content of 23% in stabilized anchovy meal. The monounsaturated fatty acid contents ranged from 20.23% to 21.62% (Table 2) and oleic acid (C18:1n-9) was present in larger percentages (12.29% to 13.44%) than the others. These values are close to the values for stabilized anchovy meal (13%) found by Barlow and Pike (10). Eicosapentaenoic acid (EPA, C20:5n-3) and docosahexaenoic acid (DHA, C22:6n-3) contents were higher than those of the other polyunsaturated fatty acids. Among polyunsaturated fatty acids the largest concentration was for DHA. The highest value (19.16%) was in January, while the lowest one (17.44%) was in December. EPA, which is another important polyunsaturated fatty acid, was between 7.52% and 8.35%. However, Barlow and Pike (10) obtained 16% EPA and 14% DHA in stabilized anchovy meal. The same results were also determined by Bimbo (9). In our study, the concentrations of n-3 PUFA in anchovy meal were higher than those of n-6 PUFA. Barlow and Pike (10) reported that the value of n-3 PUFA (34.3%) of anchovy meal was higher than value of n-6 PUFA (4.1%). This result was in agreement with our study. In humans and intensively reared animals it appears that diets have become unbalanced in terms of the make-up of fat— particularly polyunsaturated fatty acids. The content of n-3 fatty acids has declined and that of n-6 fatty acids increased. By supplementing with fish meal, which is rich in long chain n-3 fatty acids, the balance can be restored. In this study, the ratio of n-3 to n-6 in anchovy meal was 5.47 in November, 6.17 in December and 6.75 in January. Fish meal has been used for many years as a livestock feed. It is popular because of its high nutritional value if properly processed (11). Currently fish meal is used mainly for aquaculture, poultry and pigs (1). Fish meal is graded on a variety of different qualities, the most important being protein level. Special-grade fishmeal, which is steam-dried, has protein levels around 68%. It is a higher quality fishmeal that is favored for aquaculture feed. The protein level found in our study was high. The lipid content of anchovy meal was between the values desired in fish meals. Fish meal high in n-3 fatty acids, when fed to some animals (particularly poultry), can increase the n-3 content in the animal’s flesh, thus making this tissue another source of n-3 fatty acids for the human diet in addition to the fish source (11). Polyunsaturated fatty acids were high, especially EPA and DHA, which both are important for human and animals.
References
1. Pike, I.H.: Health Benefits from Feeding Fish Oil and Fish Meal, Technical Bulletin No: 28, IFFOMA, St. Albans, UK, 1999. 2. Windsor, M.L.: Fish Meal. Department of Trade and Industry
Torry Research Station Torry Advisory Note No. 49 FAO In Partnership With Support Unit For International Fisheries and Aquatic Research, SIFAR, 2001.
3. Aquamedia: Where does the fish meal and fish oil for feeds come from? Aquamedia, Technical Bulletin, 2006.
4. D‹E: Su Ürünleri ‹statistikleri. Devlet ‹statistik Enstitüsü, Baflbakanlık Yayınları, Ankara, 2002.
5. AOAC: Official Methods of Analysis of the Association of Official Analytical Chemists (W. Horwitz, Ed.), 15th edn., Arlington, USA. 1990.
6. IUPAC: Standard Methods for Analysis of Oils, Fats and Derivatives, 6th Edition (Fifth Edition Method II.D.19) (pp 96-102). Pergamon Press, Oxford. 1979.
7. Koning, A.J.: Quantitative quality tests for fish meal. II. an investigation of the quality of south African fish meals and the validity of a number of chemical quality indices. Int. J. Food Prop., 2002; 5: 495-507.
8. Kratzer, F.H., Latshaw, J.D., Leeson, S.L., Moran, E.T., Parsons, K.M., Sell, J.L., Waldrop, P.W.: Nutrient Requirements of Poultry: Ninth Revised Edition, National Academy Press, Washington, D.C., 1994; 61-79.
9. Bimbo, A.P.: Fish Meal and Oil. In: Martin, R.E, Flick, G.J. Eds. The Seafood Industry, Van Nostrand Reinhold, New York, 1990; 325-350.
10. Barlow, S.M., Pike, I.E.: The Role of Fat in Fish Meal in Pig and Poultry Nutrition. Technical Bulletin No: 4, International Association of Fish Meal Manufacturers. Potters Bar, UK, 1977. 11. Ockerman, H.W.: Fishery By-Products. In: Hall, G.M., Ed. Fish