* Corresponding author. Tel.: +90-222-712-5305 ; E-mail address: [email protected] (A. Uray) ISSN: 2149-8024 / DOI: https://doi.org/10.20528/cjsmec.2019.04.001
Research Article
Analysis of historical structures by using finite element method in
Iznik Yeşil Mosque
Aykut Uray
a,*
, H. Selim Şengel
a, Serdar Çarbaş
ba Department of Civil Engineering, Eskişehir Osmangazi University, 26480 Eskişehir, Turkey b Department of Civil Engineering, Karamanoğlu Mehmetbey University, 70100 Karaman, Turkey
ABSTRACT
In this study, non-destructive tests and laboratory tests were carried out in order to determine the material properties in Iznik Yeşil Mosque, Iznik District, Bursa Prov-ince. For the purpose of determining the soil characteristics of the building, the soil survey studies conducted in the Iznik Yeşil Mosque area were investigated. The finite element model was formed by making a three dimensional model study of the struc-ture. With the finite element model, static analysis, modal analysis and behavioral spectrum analysis were performed under vertical loads in order to collect data for the damaged areas of the structure.
ARTICLE INFO Article history: Received 25 March 2019 Revised 16 May 2019 Accepted 15 June 2019 Keywords: Static analysis Historical structures Ultrasound test Finite element method
1. Introduction
Over the centuries, historical buildings have suffered from earthquakes, fires, wars, negative environmental conditions, along with the formation of periodic indiffer-ence. A part of these important and valuable structures have been lost, while another part have faced structural losses and some have survived to the present day. Today, many scientists continue their work on preservation of historical heritage. The preservation of Historical struc-tures is very important in terms of development and sus-tainability of the understanding of interdisciplinary studies. The role of civil engineering in Interdisciplinary study is to examine the element and material properties of historical masonry structures, to investigate retrofit-ting techniques that can be applied to historical masonry structures, to create a building model and to make static and dynamic analysis on the model. Material analysis of the structure of Iznik Yeşil Mosque was carried out and the necessary parameters were determined in order to make the related calculations. Static and dynamic analy-sis were made according to these parameters.
In the modeling and analysis of Historical struc-tures, studies are done by using the finite element model.
For this purpose, the finite element method is compared with the manual calculations, in order to do so a sample model was created and the results of calculations were compared.
2. Analysis with Finite Element Method 2.1. Comparison of sample models and analysis
The analysis of Finite element method can be per-formed manually or by computer, and can be compared as shown in Fig. 1, a sample arch model was created and studies were made. The displacement value on the ninth node point was controlled in two directions by perform-ing a loadperform-ing of 1 kN at the center of the belt. The Sap2000 program was used for the computerized stud-ies (Sap2000 Manual, 2005). In the manual calculation method, as shown in Fig. 2, operations were performed using the local stiffness matrix of the plane frame ele-ment (Uray, 2018).
It was found that there were 0.039 m displacement values at the ninth node with the two methods. In man-ual analysis studies, the selection of the stiffness matrix
of the element is very important. While it is possible to perform a finite element analysis on a single element, it is very difficult to manually calculate complex structures
with more than one element. Therefore, modeling and analyzing historical structures in a computer environ-ment will give closer results to reality.
Fig. 1. Sample arch model.
Fig. 2. Stiffness matrix of plane frame element. 3. Iznik Yeşil Mosque as an Example and Previous
Studies
The construction of the mosque in Iznik District of Bursa Province was commenced in 1378 according to the inscriptions. When the construction of the mosque was completed, it was opened for worship and since that date it has become one of the important centers of Iznik region. By making static and dynamic analyses of this im-portant work, the situation after a possible earthquake was examined and a roadmap was created to take the necessary security precautions.
Iznik Yeşil Mosque, with its rectangular plan extend-ing in the north-south direction, the main place of wor-ship is covered with a single dome and the last congrega-tion is located on the northern facade, the structure is a sin-gle domed mosque. The reason why the building is called the Green Mosque is that it is mainly covered with tur-quoise tiles and glazed bricks covering the entire area from the base of the minaret to the lead cone. The structure has
overall dimensions of 26.20x14.25 meters. The last main body walls thicknesses are between 1.70 m and 1.80 m and are made entirely of marble. The single-domed struc-ture consists of a space with an overall size of 13.50 me-ters. It has a minaret built as an integrated structure. While the last congregational walls outer elevation reaches 9.55 meters, the outer body walls elevations of the main meeting section reach 8.50 m. The upper eleva-tion of the main dome appears to be 18.30 meters.
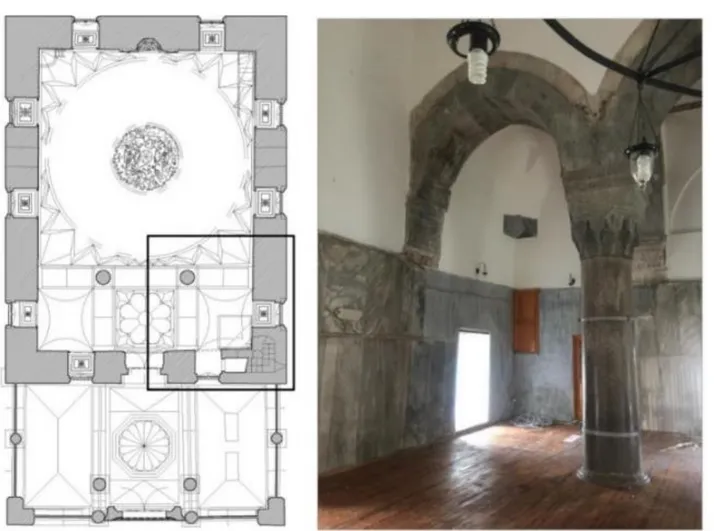
The mosque in general, in the present process, is well preserved and without losing its general architectural features. The original state was generally preserved. Since the areas around the mosque were far from being built, serious deformations were not observed due to ground movements on the main body walls of the mosque. In the mosque, which has a rectangular plan with its north-south direction, two granite column ele-ments are found when the last congregation is taken from the neighborhood to the three-eyed entrance area (Fig. 3.).
Fig. 3. Entrance to the west facade of the mosque - deformation formed column and area. 3.1. Determination of the modulus of elasticity with
onsite and laboratory tests
In order to provide accurate results of the static and dynamic analyses to be made after the modelling of the mosque, studies have been done with the ultrasound test method within the mosque. Tests were conducted in the laboratory environment for determining unit vol-ume weights by using materials belonging to the struc-ture body walls, which were previously separated from the building but collected during restoration work. The results were performed by ultrasound testing in seven different regions of the mosque. The columns in the last communion section, the columns in the entrance part of the mosque and the body walls were conducted. In the Yeşil Mosque during the restoration work between the years 2015-2016, the location of the main body wall and column elements-which could not be detected- in the mosque under the storage of the granite elements in the laboratory environment. The average value was calculated by performing unit volume weight tests (Ta-ble 1).
The values obtained as a result of tests performed in Situ and laboratory environment were determined by using Eqs. (1) and (2) from empirical formulas found in the literature and modulus of elasticity of the elements (Bağbancı, 2009; Anonymous, 2018). With Eqs. (1) and (2), after the determination of the unit weight values in laboratory environment with the determined sound
transition time (µs) at certain length intervals as a result of the ultrasound tests performed on site, the average elasticity module determination of the tested area of the structure was made with the help of the empirical for-mulas in the literature.
𝐸 = (𝐿
𝑡) 2
𝛾 103 (1)
𝐸 = 𝐶𝑙2 𝑄 (1 + 𝛾) (1 − 2𝛾) / (1 − 𝛾) (2)
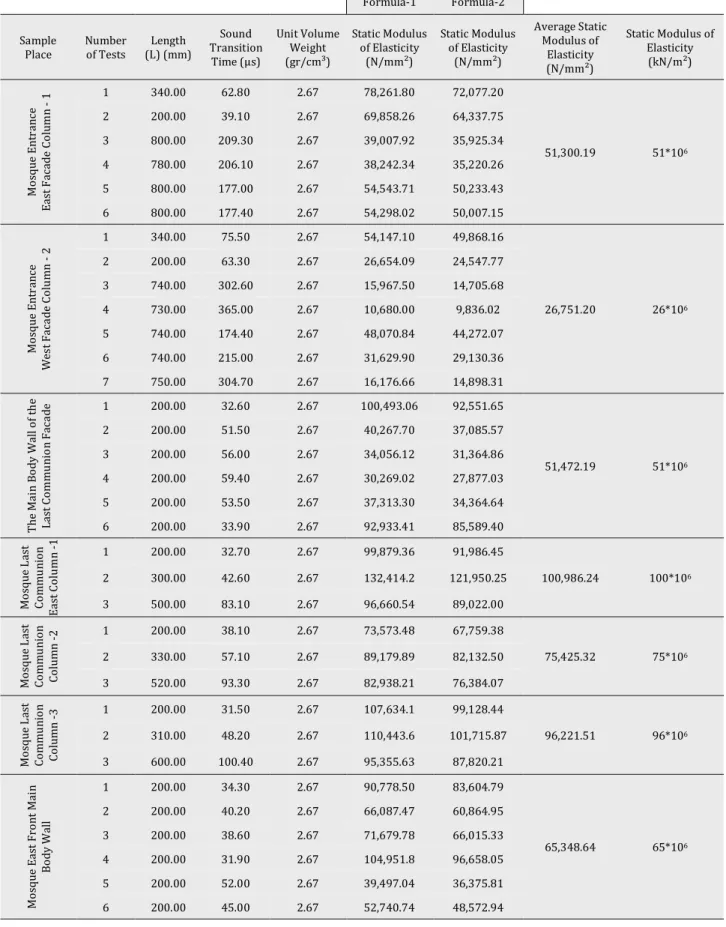
In samples, the sound transition time, volume weights of the materials and empirical formulas were utilized, as shown in Table 1, the determination of static modulus of elasticity of the elements was performed. The values found were high and close to the values given in the lit-erature of granite stones which are the main material of the mosque. Although the same values in all parts of the structure are generally the same, the mosque entrance facade of the damaged position on the west side of the carrier column element is determined that the values are low compared to other elements.
3.2. Finite element model of the structure
Key Creator (2004) software program was used to de-sign a three-dimensional structure for the creation of the finite element model of the structure. In the restoration and restitution projects with the survey drawings, the
planning, section, appearance and detail sheets were used to carry out the dimensioning process. Primarily, the columns of the building and the body walls were modeled. After modeling of the body walls in General,
gaps were created on the structure, such as the windows and doors. In the last part, the structure was designed as a three-dimensional design of the building elements used as the dome, vault, etc. (Fig. 4).
Table 1. Determination of modulus of elasticity.
Formula-1 Formula-2 Sample
Place Number of Tests (L) (mm) Length
Sound Transition Time (µs) Unit Volume Weight (gr/cm³) Static Modulus of Elasticity (N/mm²) Static Modulus of Elasticity (N/mm²) Average Static Modulus of Elasticity (N/mm²) Static Modulus of Elasticity (kN/m²) M os qu e En tr an ce Eas t F ac ad e Co lu m n - 1 1 340.00 62.80 2.67 78,261.80 72,077.20 51,300.19 51*106 2 200.00 39.10 2.67 69,858.26 64,337.75 3 800.00 209.30 2.67 39,007.92 35,925.34 4 780.00 206.10 2.67 38,242.34 35,220.26 5 800.00 177.00 2.67 54,543.71 50,233.43 6 800.00 177.40 2.67 54,298.02 50,007.15 M os qu e En tr an ce W es t F ac ad e Co lu m n - 2 1 340.00 75.50 2.67 54,147.10 49,868.16 26,751.20 26*106 2 200.00 63.30 2.67 26,654.09 24,547.77 3 740.00 302.60 2.67 15,967.50 14,705.68 4 730.00 365.00 2.67 10,680.00 9,836.02 5 740.00 174.40 2.67 48,070.84 44,272.07 6 740.00 215.00 2.67 31,629.90 29,130.36 7 750.00 304.70 2.67 16,176.66 14,898.31 T he M ai n B od y W all o f t he La st C om m un io n Fa ca de 1 200.00 32.60 2.67 100,493.06 92,551.65 51,472.19 51*106 2 200.00 51.50 2.67 40,267.70 37,085.57 3 200.00 56.00 2.67 34,056.12 31,364.86 4 200.00 59.40 2.67 30,269.02 27,877.03 5 200.00 53.50 2.67 37,313.30 34,364.64 6 200.00 33.90 2.67 92,933.41 85,589.40 M os qu e La st Co m m un io n Eas t C olu m n -1 1 200.00 32.70 2.67 99,879.36 91,986.45 100,986.24 100*106 2 300.00 42.60 2.67 132,414.2 121,950.25 3 500.00 83.10 2.67 96,660.54 89,022.00 M os qu e La st Co m m un io n Co lu m n -2 1 200.00 38.10 2.67 73,573.48 67,759.38 75,425.32 75*106 2 330.00 57.10 2.67 89,179.89 82,132.50 3 520.00 93.30 2.67 82,938.21 76,384.07 M os qu e La st Co m m un io n Co lu m n -3 1 200.00 31.50 2.67 107,634.1 99,128.44 96,221.51 96*106 2 310.00 48.20 2.67 110,443.6 101,715.87 3 600.00 100.40 2.67 95,355.63 87,820.21 M os qu e Eas t F ro nt M ai n B od y W all 1 200.00 34.30 2.67 90,778.50 83,604.79 65,348.64 65*106 2 200.00 40.20 2.67 66,087.47 60,864.95 3 200.00 38.60 2.67 71,679.78 66,015.33 4 200.00 31.90 2.67 104,951.8 96,658.05 5 200.00 52.00 2.67 39,497.04 36,375.81 6 200.00 45.00 2.67 52,740.74 48,572.94
Fig. 4. Three-dimensional modelling of the structure. The construction of the finite element model and the analysis of the structure to be done in detail, the columns of the entrance part of the mosque, the last communion columns, the main body walls, the wooden tensioner dome, the vaulted building elements are modeled sepa-rately.
The elements found in the model were divided into eight main parts and the descriptions were made. All el-ements in the structure are designed as solid elel-ements. With the creation of finite elements, the structure con-sisted of 117709 solid elements, 38018 solid element net surface and 101420 node points (Fig. 5). Considering that the finite element networks are changed accurately in proportion to the accuracy of the analysis results, the reduction of finite element network sizes will ensure more accurate results in analysis. Analysis studies were conducted using ALGOR finite element software (2007) for modeling and analysis of the finite element model.
Fig. 5. Finite element model of the structure.
3.3. Analysis of the structure
A static analysis of the Structure under vertical loads is very important to see the stress clutter and distribu-tion that may occur under the vertical loads of the struc-ture, the cracks that may occur in the structure and the non-plane movements and displacements. It provides an understanding of the behaviour of the building on which it has to carry continuously. In the analysis, excluding other loads that may affect the structure, it is important to see how the vertical loads are likely to create defor-mation in the structure and to take precautions with an appropriate technique. When the current situation of the Yeşil Mosque is examined, a number of deformations are thought to occur in the minaret in the north-west section with the effect of vertical loads. Studies have been con-ducted to investigate these parts in the analyses to be done.
3.3.1. Static analysis under vertical loads
Two analysis studies were carried out under vertical loads for this structure. In the first analysis, the material properties are considered to be the same according to the material genus, and in the analysis under the second-to-be-vertical loads, the data that is obtained as a result of non-destructive testing of damaged zone values were analyzed by injury. The goal here is to compare the situ-ation we think is not damaged by today's situsitu-ation. In Ta-bles 2 and 3, the values were taken according to the char-acteristics of the element.
Table 2. Analysis parameters under vertical loads (First Analysis).
Stone Brick Pressure Strength (MPa) 50 MPa 20 MPa
Tensile Strength
in Bending (MPa) 5 MPa 3.9 MPa Modulus of Elasticity (N/m2) 50*109 N/m2 5*109 N/m2 Unit Volume Weight (kg/m3) 2607 kg/m3 1600 kg/m3 Slip Module (N/m2) 21*109 N/m2 2.1*109 N/m2
Table 3. Analysis parameters under vertical loads (Second Analysis).
Stone - 1 Stone - 2 Brick Pressure Strength (MPa) 50 MPa 50 MPa 20 MPa
Tensile Strength
in Bending (MPa) 5 MPa 5 MPa 3.9 MPa Modulus of Elasticity
(N/m2) 50*109 N/m2 26*109 N/m2 5*109 N/m2 Unit Volume Weight
(kg/m3) 2607 kg/m3 2607 kg/m3 1600 kg/m3 Slip Module (N/m2) 21* 109 N/m2 11*109 N/m2 2.1*109 N/m2
After determining the parameters in relation to the analysis of the structure and under its self-weight power, we find that it was carried out with the effect of 9.81456 m/sn2 gravitational acceleration in Z direction. In the structure, the minaret built into the mosque is made up of three-dimensional modeling of a certain quota, the vertical loads formed due to the non-model part are done by mathematical calculations – in the cylinder sec-tion in Z direcsec-tion-the program is defined as a load of 1,500 KN. In accordance with the specified parameters, the values are transferred to the structure and the finite element node points sitting on the floor are determined to do not take the moment in the three directions.
In two analyses of the structure under vertical loads, the structure was observed to be good under vertical loads, in which the structure worked in the pressure. While the two analyses have been observed to be closely related to the vertical displacement values in general, the second analysis is done with the values determined by experimental methods of the column that we described as damaged nowadays, the whole structure was affected by the column elements, especially the stresses, the re-siduals were observed in the columns. When we look at the sections with stresses, from the current state of the structure, the mosque coincided with partial defor-mations in the last Communion entrance section, and the tension of the glass in the column by the west of the en-trance part of the window was formed, the damage can be started in this region (Figs. 6-9).
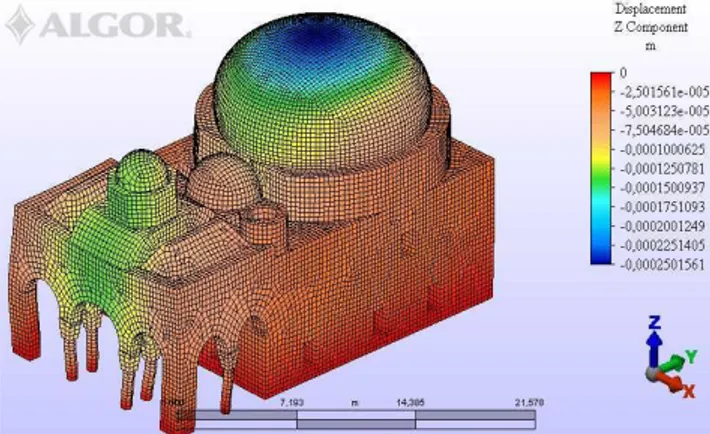
Fig. 6. Static analysis made under vertical loads – vertical direction displacement (First Analysis).
Fig. 7. Static analysis made under vertical loads – vertical direction displacement (Second Analysis).
Fig. 8. Static analysis made under vertical loads – stresses occurring in columns (First Analysis).
Fig. 9. Static analysis made under vertical loads – stresses occurring in columns (Second Analysis).
3.3.2. Earthquake analysis
Different from the static analysis of earthquake anal-yses to examine the behavior of the structure under loads that change over time, the inertia forces formed by the structure due to earthquake forces. Inertial forces are the forces that resist the acceleration of the construc-tion movement with the effect of horizontal loads from the outside. Natural vibration periods are very im-portant for determining the calculations of structures by performing earthquake analysis. Self-worth analysis or modal analysis are the methods used to see the mode shapes of structures and the periods of free vibration. The finite element model of ıznik Yeşil mosque has been performed with the aid of the ALGOR program and has been undergoing modal analysis and has been checked for 10 modes. The mode of vibration, which belongs to a free vibration period, is expressed by the mass participa-tion rate, in which the total mass of the structure can be triggered and incorporated into the oscillation movement (Dabanlı, 2008). Table 4 shows the free vibration periods, modal frequencies, and mass participation ratios of the structure's 10 calculated modes. As a result of the anal-yses, the entire structure is lateral movement In X-Direc-tion (East-West). The First mode’s vibraX-Direc-tion frequency value is 20.547 Hz and the mass participation rate is 60.99%. In the third mode of the Structure, lateral move-ment in the Y direction (North-South). The vibration fre-quency value of the Third mode is 24.87 Hz and the mass participation rate is 41.05%.In the analysis made through 10 Modes, the total turnout rate in the X direc-tion was 74.90%, while the total participadirec-tion rate in the Y direction was 69.48% and 7.7% in the Z direction.
Table 4. Free vibration cycles of the structure, modal frequency and mass participation rates.
Mode Frequency (Hz) Period (sn) ticipation X Mass par-(%) Mass par-ticipation Y (%) Mass par-ticipation Z (%) 1 20.547 0.04866891 60.99 0 0 2 24.162 0.0413873 1.9 0,65 0 3 24.870 0.04020909 0.02 41,05 0,05 4 29.022 0.03445662 0.01 10,94 0 5 31.690 0.0315557 3.36 0,09 0 6 34.069 0.0293522 0.01 15,7 0 7 38.750 0.02580645 8.53 0,01 0,02 8 39.115 0.02556564 0.05 0 4,95 9 44.880 0.02228164 0.03 0 0,01 10 45.500 0.02197802 0 1,04 2,56 Total Participation Rates: 74.90 69.48 7.7
The torsional movement was observed in the mode where the Structure was active in the X and Y direction. The first mode is the dominant mode in the X direction (Fig. 10a), the third mode (Fig. 10b) is the dominant mode in the Y direction.
Fig. 10. The dominant modes in the X and Y direction. In Earthquake analyses, calculations and analyses were made by utilizing spectrum analyses in the 2.4 sec-tion of "Regulasec-tion On Buildings To be held in Earth-quake Zones". The Spectrum calculations were made us-ing the "Full-Frame Consolidation" method. The values used in the Analyses are used in the formulas contained in the relevant substances of the regulation to create the acceleration spectrum chart (DBYYHY, 2007). The accel-eration sprectrum chart was created using formulas (Fig. 11).
Fig. 11. Acceleration spectrum graph.
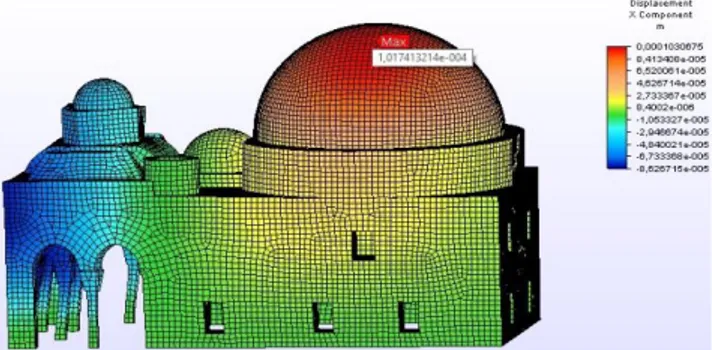
Earthquake analyses were made in the X and Y direc-tion of the structure. As a result of earthquake analyses in the X direction, 0.10 mm displacement occurred as shown in Fig. 12 in the first mode of the dome cover with the largest mass participation, In the last congregation part of the structure, the columns and wall building ele-ments in the upper cover section,It was found that there was a displacement of 0.60 mm. In other regions of the structure, the displacement values in the X direction are generally low.
Fig. 12. X-direction displacement value in dome resulting from earthquake analysis in X direction. When the stresses of the analysis were examined, it was observed that the maximum stresses were between 10.56 MPa and 19.90 MPa (Fig. 13). According to the mo-dalities of the building, when the values they have taken are examined, it was determined that the main dome pulley and the Turkish triangles were formed in the cor-ners of the main body walls and these values were in the range of 0.8-1.0 MPa. And here we can be say that the structure generally does not consist of serious defor-mations in the X direction, it shows a good structural be-havior.
As a result of earthquake analysis in the Y direction, the maximum displacement in the third mode of mass participation occurred in the dome cover of the structure and it was identified with the value 0.62 mm. (Fig. 14). In the fourth and sixth mode of the structure, the displace-ment of the Y direction between 0.11 and 0.13 mm was determined in the last communion section of the regions where the displacement occurred and the upper cover elements of the mosque entrance area.
0.0 0.5 1.0 1.5 2.0 2.5 3.0 0.0 0.2 0.4 0.6 0.8 1.0 1.2 1.4 1.6 1.8 2.0 2.2 a (m/sn2) T (sn) (a) (b)
Fig. 13. Maximum stresses in x direction resulting from earthquake analysis in X.
Fig. 14. Displacement values of the dome in the Y direction as a result of earthquake analysis. 4. Conclusions
In this study, the structure was aimed to determine the behavior of the earthquake with the behavior of the structure under vertical loads by performing static and dynamic analyses with finite element method. In addi-tion, based on the current state of the structure, the de-formation of the structure is aimed to determine the analyses. Dynamic Analysis studies for 2007, regulation on structures to be made in Earthquake regions is used. In order to determine the material parameters, ultra-sound tests and unit volume weight tests were per-formed in laboratory, and the analysis parameters were determined. By creating the three-dimensional model of the structure, the data were analyzed by static analysis, modal analysis and behavioral spectrum analysis, stress values, displacement values and performance of the structure.
When the current situation of the Structure is exam-ined, the entrance part of the mosque was observed to have deformations in the column and header on the Western Front. As a result of the static analyses of the structure under vertical loads, the stress stacks were ob-served to occur in the header of the damaged column and it has been determined that the model, experiments and analyses overlap with the current state of the mosque.
As a result of static analysis of the structure under vertical loads, the maximum displacement is on the main dome cover and the values were around 0.25 mm, but when we examined structure, there were no visible de-formation in the main dome. However, if the structure was repaired in the Sixties and intervention was carried out, the repair production is thought to be performed during this period.
In the structure, two vertical loads were performed under static analysis, and the results of the two analyses were similar, compared to each other. As a result of the static analysis of the structure under the vertical loads, the values were observed in the columns made of mono blocks, and when the tension readings were examined, there was more pressure stresses throughout the struc-ture. However, the analysis study carried out values ac-cording to the parameters calculated in the damaged col-umn together with the tests performed in place, the property was observed that the loads and displacement values from all the columns were increased, the last com-munion was found in the corner walls.
When the modal analysis and behavioral spectrum analyses were examined in the Structure, the first mode in the X direction was the prevailing mode, and in the Y direction, the prevailing mode was the third mode. When the mode shapes of the Structure are examined, the movement can be traced in the east-west and north-south direction. It was found that the earthquake loads caused a maximum displacement of 0.60 mm in the structure, and the study have revealed that the displace-ment value could be at most in the last congregation top cover. In the earthquake analysis carried out X (east-west) in the direction of the pressure stress values of the structure, it was determined that the final congregation was formed in the top cover and walls and the tensile values were around 10 MPa. Similarly, the results of the earthquake analysis in the direction of the Y and the val-ues of the last communion in the upper cover section of 6 MPa can consist of regressive. In the case of an earth-quake, the formation of deformations and cracks in the last communion section is likely to occur when the struc-ture have been seen by modal analysis and behavioral spectrum analyses.
Considering the strengthening situation of the build-ing today, the damaged column and the stainless-steel lathes made in the head are considered to be sufficient for the current state of the structure. It is considered that there is no serious construction in the area around Iznik Yeşil Mosque and therefore the problems that may arise from the ground do not appear in the structure. For this to be sustainable, it is advisable to make the construction around the mosque so that it does not allow the produc-tion to be made to disrupt the ground balance.
With the impact of the earthquake forces to influ-ence the structure, it is not possible to take precautions for the deformations that may occur in the last congre-gation part of the structure as a weak zone. However, it is important for the overall structure of the building to take necessary measures together with a deformation that may occur by monitoring the movements of the building.
Acknowledgements
The authors solemnly acknowledge the various searchers who have published their experimental re-sults that were used in this study.
REFERENCES
ALGOR V20.00 (2007). Autodesk Inc., U.S.A.
Anonymous (2018). University of Colorado, Integrated Teaching & Learning Laboratory Ultrasound Test, https://itll.colorado.edu/ Bağbancı MB (2009). Analysis of Historical Structures by Finite
Ele-ment Method in the Case of Bursa Ördekli Bath. Ph.D thesis, Uludağ University, Bursa.
Dabanlı Ö (2008). Determination of Earthquake Performance of Histor-ical Masonry Structures. M.Sc. thesis, İstanbul TechnHistor-ical University, Istanbul.
DBYYHY (2007). Regulation on Structures in Earthquake Regions, March, 2007.
KEY CREATOR V4.0.0 (2004). Cubotek Corporation, U.S.A.
Sap2000 Manual (2005). Integrated Structural Analysis and Design Software, Computer and Structures Inc., Berkeley, California. Uray A (2018). Determination of Earthquake Performance of Historical
Masonry Structures. M.Sc thesis, Eskisehir Osmangazi University, Institute of Science and Technology, Eskisehir.