DOI: 10.1501/Commuc_0000000185 ISSN 1303-6025
© 2016 Ankara University Communications Faculty of Sciences University of Ankara Series C: Biology MORPHOMETRIC ANALYSIS of Nannospalax leucodon (Nordmann,
1840) with 2n=60 DISTRIBUTED in CENTRAL ANATOLIA
Engin SELVİ1, Teoman KANKILIÇ2, Perinçek Seçkinozan ŞEKER3, Ercüment
ÇOLAK1
1Ankara University, Faculty of Science, Department of Biology, Moleculer Systematic Laboratory, 06100 Beşevler, Ankara, Turkey
E-mail : [email protected], [email protected]
2Ömer Halisdemir University, Faculty of Science and Letter, Department of Biotecnology, Niğde, Turkey
E-mail : kankılıç@gmail.com
3Artvin Çoruh University, Artvin Vocational School, Department of Forestry, Artvin, Turkey E-mail : [email protected]
(Received: November 09, 2016; Accepted: December 23, 2016 ) ABSTRACT
In this study, distribution areas of populations with different NF values (76, 78, 80, 82 and 84) belonging to 2n= 60 chromosomal forms of Nannospalax leucodon widely distributed in Central Anatolia were examined by using traditional morphometry. When findings from this study and other results obtained from previous karyological studies were evaluated together, it was observed that populations with different NF values were not randomly distributed in Central Anatolia. It was determined that the populations with NF= 80 value had the widest distribution and is mostly distributed in the center of Central Anatolia. It was seen that the populations with NF=76 and NF=78 values were found as small populations in northern and southern border of distribution area of the populations with NF=80. It was observed that populations having bigger NF values (NF=82 and 84) present as small populations in western border of the main populations with NF=80. Among populations having different NF values, 8 of the 34 morphometric characters were statistically significant among females of different populations, while 25 of those in male showed significant difference. Statistically, the mean values of 34 morphometric characters were found as highly important by MANOVA. The populations with different NF values distributed in different geographic areas in Central Anatolia were separated in CVA analysis and particularly populations in western parts of Central Anatolia were grouped separately than others.
1. INTRODUCTION
Distribution of animal and plant species is mainly shaped by changes in climate, geography and geomorphological conglomeration processes which form main geological structure of a certain area. These unstable conditions can also change population genetics and habitats of the species and therefore led to occur both inter- and intra- specific variations. Biogeographically, Turkey is a transition zone between the continental Europe and the near East and has variable geographic, climatic and geological features. Also, Turkey is under the influence of three different phytogeographical regions. The combined effects of its location, all those variable factors and different vegetation types have major impacts on forming and shaping inter- and intra- populational species diversity in Turkey.
Topographical features along with the climatic conditions and vegetation of Anatolian peninsula dramatically changed during a period from Paleozoic to Quaternary (1). Conformation of the Western Anatolia Mountains, the Black Sea Mountains, the Taurus Mountains, the Eastern Anatolian Mountains, known as “Anatolian Diagonal”, “Turkish Straits system” (Marmara Sea, Dardanelle and Bosporus straits) and the Central Anatolia Plateau were gradually realized during this time, which has considerable impacts on Anatolian biodiversity. Anatolian Diagonal, which effects both fauna and flora of Anatolia, divides Anatolia in the north and south directions, continues from the Amanos Mountains to the Erzurum-Kars plateaus. Nannospalax
leucodon and Nannospalax ehrenbergi are separated by the influence of
Anatolian Diagonal. Previously, these two species were contacted in Anatolia. However, they had been separated as a result of the ascension and descent activities that occurred since the Oligocene (2, 3, 4, 5, 6, 7, 8). Besides effects
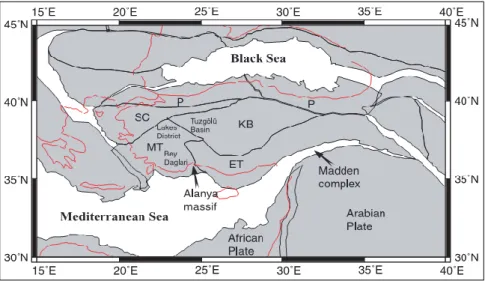
of those major geographical barriers, some geological formations such as Kırşehir block, Menderes-Taurus block, Eastern Taurus block, Pontides, Salt Lake and Sakarya basin (Figure 1) have served as different geological and biogeographical units bringing about differentiation of animal and plant species living in Anatolia (9, 10, 11, 12). Central Anatolia, which is today enclosed by the Black Sea Mountains in the north, the western Anatolia Mountains in the west, the Taurus Mountains in the south and the Anatolian Diagonal in the east, has been shaped by various geological formations during its geological history. Also, this geographical area is mostly comprised Kırşehir block, Menderes-Taurus block and Sakarya continent. These formations also influenced aspects and distributions of vertebrate species living in Anatolia. Phylogenetic relationships of the genus Aphanius, distribution patterns of Pseudophoxinus species and high genetic diversity in
Mertensiella luschani populations found in Menderes-Taurus block that is
considered to be as a Pleistocene refuge have demonstrated that geological events shaping Central Anatolia is very important power to contribute to diversity of organisms living in Central Anatolia
(12, 13, 14).
Figure 1. The geological situation of the clusters of Anatolia 15 million years ago (11, 12) SC= Sakarya continent, MT=
Menderes-Taurus
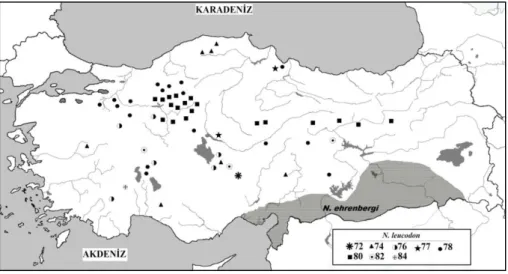
block, KB= Kırşehir block, ET= East Taurus block, P=Pondites The level of biodiversity arising from habitat diversity is very high in Turkey, which results from abovementioned factors like geographical and climatic diversities and so on. Approximately more than 160 mammal species, 8 of them are endemic, are hosted by Turkey (15, 16, 17, 18). Rodents adapted to quite different habitats including ground and underground constitute majority among mammal species in Turkey. Of those rodents, the mole voles in the genus Nannospalax are the unique and important rodent species specialized to live in subsoil habitat. Nannospalax leucodon in this genus has widely distribution in Turkey. This species has 11 chromosomal forms (2n= 36, 38, 40, 48, 50, 52, 54, 56, 58, 60, 62) (19). Chromosomal form of 2n=60 has the widest distribution in Turkey (Figure 2), and has eight different NF values (NF= 72, 74, 76, 77, 78, 80, 82, 84) within all chromosomal forms of this species (20, 21, 22, 23, 24, 25, 26, 27, 28).
Figure 2. Distribution of populations with different NF values belonging to 2N=60 chromosomal form in Turkey.
Mole rats have also morphological and morphometric differences in addition to the known high level of chromosomal differentiation. These animals have evolved distinct morphological and morphometric characteristics, resulted from adaptations to the environments in which they live. The most important environmental factors stimulating differentiation in morphological characteristics of mole rats are soil structure, climate and geographical factors. Mole rats in their general life time excavate the soil using incisors and throw out the excavated soil by their feet and head to create subterranean galleries. Therefore, it is possible to observe differentiations in dental and cranial characters of mole rats living in distinct soil structure (dry, arid, soft, gravels) under the influence of the changeable climate and active tectonism. For instance, one of the main dental differentiations used to separate two
Nannospalax species living in different geographies (N. ehrenbergi and N. leucodon) is groove patterns on anterior side of the upper incisors (29, 30).
Main aims of this study are: 1. to determine if there is morphometric differentiation between populations with different NF values of 2N=60 chromosomal form, 2. If this is the case, to determine relationships between morphometric differentiations and geological units in Central Anatolia.
2. MATERIAL AND METHODS
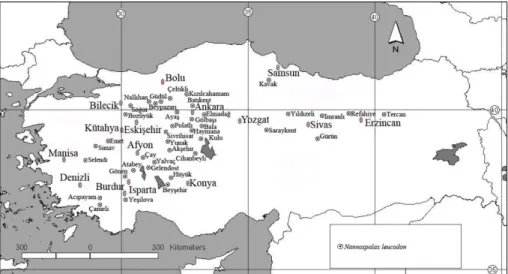
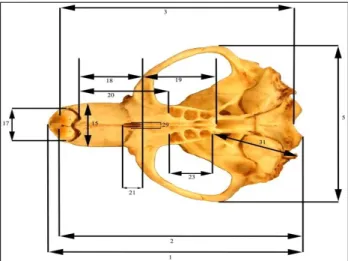
A total of 177 specimens (90 males and 87 females) from 49 localities were used in present study (Figure 3). In the measurements, the skull belonging to mature individuals was used. Because of the presence of sexual dimorphism between male and female individuals in mole rats, the sexes were evaluated separately. Measurements of three body (Total length (TL), Hind foot (HF), Weight (gram) (W) and 31 cranial characters were analyzed for morphometric evaluations (Figures 4-7, Table 1).
Figure 4. Character measurements of the skull in dorsal view.
Figure 6. Character measurements of the skull in lateral view.
Figure 7. Character measurements taken from mandible
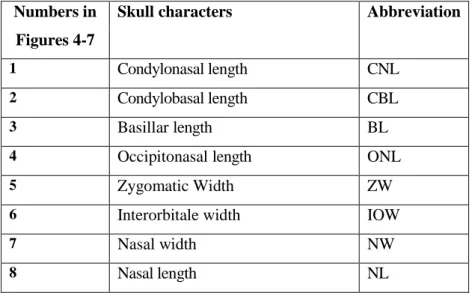
Table 1. Characters of skull measured in present study
Numbers in Figures 4-7
Skull characters Abbreviation
1 Condylonasal length CNL
2 Condylobasal length CBL
3 Basillar length BL
4 Occipitonasal length ONL
5 Zygomatic Width ZW
6 Interorbitale width IOW
7 Nasal width NW
9 Height of braincase with tympanic bulla
HBT
10 Sagital crest length SCL
11 Parietal length PL
12 Anterior width of Parietal bone AWPB
13 Width in lambdoid suture of parietal
WLP
14 Supraoccipital length SOL
15 Rostrum width RW
16 Width of Foramen infraorbitalia WFI 17 Alveolar width of upper incisor AWUI
18 Front palatine length FPL
19 Hind palatine length HPL
20 Diastema length DL
21 Foramen incisive length FIL
22 Width in mid-part of upper incisor WMUI
23 Alveolar length of right upper molar ALRU 24 Alveolar length of right lower molar ALLM 25 Articular (condylar) length of right
lower mandible
CL
26 Mandibula height MH
27 Coronoid process height CPH
28 Diameter of left aural hole DAH
29 Foramen incisive width FIW
30 Facial length FL
2.1 Statistical Analysis
Five populations with different NF values of the 2n = 60 chromosomal form of Nannospalax leucodon in Central Anatolia were statistically analyzed by using one-way variance analyses, ANOVA (Analysis of Variance) and MANOVA (Multivariate Analysis of Variance). Both analyses were performed by SPSS 15.0 for Windows (31). Male and female specimens in each population of the species were separately analyzed, because mole voles have sexual dimorphism. STATISTICA 7 (32) was used to perform CVA (Canonical Variate Analysis) analysis of morphometric characters. PAST 2008 (33) was used to show relative positions of the populations in the scatter plot, which was formed by CVA scores. Also, NTSYS pc 2.2 (34) was employed to construct UPGMA (Unweighted Pair Group Method with Arithmetic Mean) dendogram based on Mahalanobis distance matrix.
3. RESULTS
Measurements of 3 body and 31 cranial characters were used to determine differences between populations with different NF values. We worked on five NF populations of chromosomal form of 2N=60, using 34 morphometric characters.Nine characters (IOW, SCL, AWPB, AWUI, HPL, WFI, ALLM, FIW, FL) is statistically insignificant in males, while 26 characters (TL, W, CNL, CBL, ONL, ZW, IOW, NW, NL, SCL, PL, SOL, RW, FIL, AWUI, FPL, DL, WFI, WMUI, ALLM, MH, CPH, DAH, FIW, FL, BCW) are in females (P>0.05) Tables 2 - 3). Group mean vectors of NF populations in Central Anatolia were found based on MANOVA analysis.
MANOVA analysis exhibited significant differences between means of NF populations based on morphometric data (P<0.001) (Table 4).
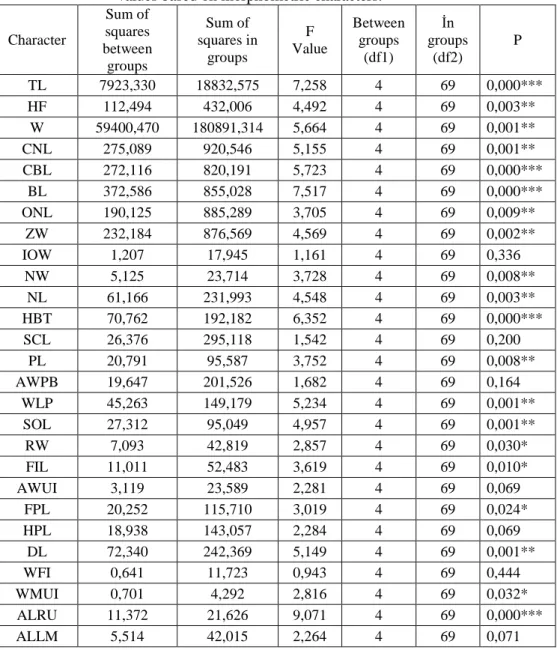
Table 2. ANOVA results of male specimens of five populations with different NF values based on morphometric characters.
Character Sum of squares between groups Sum of squares in groups F Value Between groups (df1) İn groups (df2) P TL 7923,330 18832,575 7,258 4 69 0,000*** HF 112,494 432,006 4,492 4 69 0,003** W 59400,470 180891,314 5,664 4 69 0,001** CNL 275,089 920,546 5,155 4 69 0,001** CBL 272,116 820,191 5,723 4 69 0,000*** BL 372,586 855,028 7,517 4 69 0,000*** ONL 190,125 885,289 3,705 4 69 0,009** ZW 232,184 876,569 4,569 4 69 0,002** IOW 1,207 17,945 1,161 4 69 0,336 NW 5,125 23,714 3,728 4 69 0,008** NL 61,166 231,993 4,548 4 69 0,003** HBT 70,762 192,182 6,352 4 69 0,000*** SCL 26,376 295,118 1,542 4 69 0,200 PL 20,791 95,587 3,752 4 69 0,008** AWPB 19,647 201,526 1,682 4 69 0,164 WLP 45,263 149,179 5,234 4 69 0,001** SOL 27,312 95,049 4,957 4 69 0,001** RW 7,093 42,819 2,857 4 69 0,030* FIL 11,011 52,483 3,619 4 69 0,010* AWUI 3,119 23,589 2,281 4 69 0,069 FPL 20,252 115,710 3,019 4 69 0,024* HPL 18,938 143,057 2,284 4 69 0,069 DL 72,340 242,369 5,149 4 69 0,001** WFI 0,641 11,723 0,943 4 69 0,444 WMUI 0,701 4,292 2,816 4 69 0,032* ALRU 11,372 21,626 9,071 4 69 0,000*** ALLM 5,514 42,015 2,264 4 69 0,071
CL 286,547 346,598 14,261 4 69 0,000*** MH 13,288 43,385 5,283 4 69 0,001** CPH 45,223 198,680 3,926 4 69 0,006** DAH 1,596 7,302 3,771 4 69 0,008** FIW 0,040 1,675 0,412 4 69 0,800 FL 100,217 710,917 2,432 4 69 0,056 BCW 67,031 248,309 4,657 4 69 0,002** * p<0.05, ** p<0.01, *** p<0.001
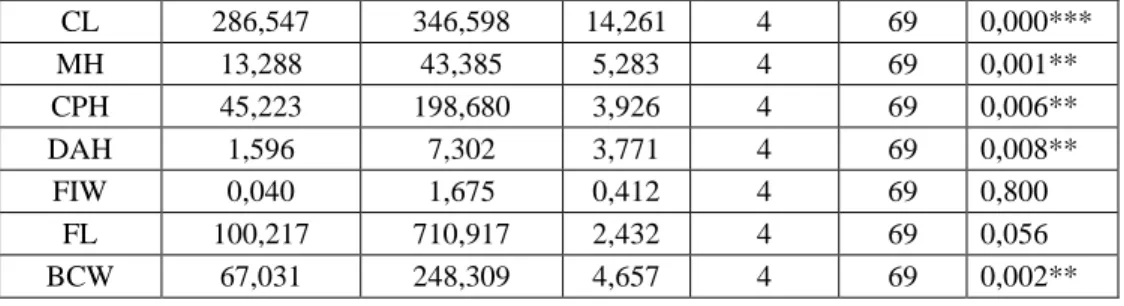
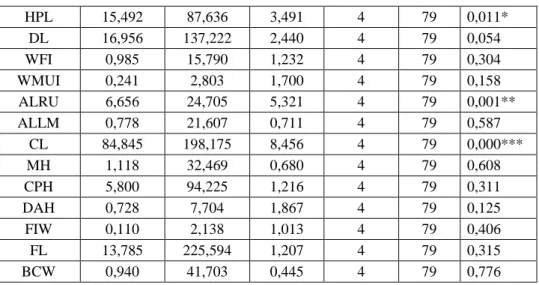
Table 3. ANOVA results of female specimens of five populations with different NF values based on morphometric characters.
Character Sum of squares between groups Sum of squares in groups F Value Between groups (df1) İn groups (df2)) P TL 599,896 19463,770 0,609 4 79 0,658 HF 21,078 99,244 4,195 4 79 0,004** W 5313,075 64941,496 1,616 4 79 0,179 CNL 28,454 443,537 1,267 4 79 0,290 CBL 7,481 310,381 0,476 4 79 0,753 BL 75,976 321,073 4,673 4 79 0,002** ONL 23,345 381,996 1,207 4 79 0,315 ZW 12,097 318,301 0,751 4 79 0,561 IOW 0,208 19,635 0,209 4 79 0,933 NW 0,417 11,682 0,705 4 79 0,591 NL 11,216 103,125 2,148 4 79 0,083 HBT 28,371 108,271 5,175 4 79 0,001** SCL 11,576 113,139 2,021 4 79 0,100 PL 9,089 74,221 2,418 4 79 0,055 AWPB 40,754 153,302 5,250 4 79 0,001** WLP 91,355 188,735 9,560 4 79 0,000*** SOL 6,289 54,373 2,284 4 79 0,068 RW 1,131 19,822 1,127 4 79 0,350 FIL 2,771 39,129 1,399 4 79 0,242 AWUI 0,904 17,950 0,995 4 79 0,415 FPL 9,665 90,553 2,108 4 79 0,088
HPL 15,492 87,636 3,491 4 79 0,011* DL 16,956 137,222 2,440 4 79 0,054 WFI 0,985 15,790 1,232 4 79 0,304 WMUI 0,241 2,803 1,700 4 79 0,158 ALRU 6,656 24,705 5,321 4 79 0,001** ALLM 0,778 21,607 0,711 4 79 0,587 CL 84,845 198,175 8,456 4 79 0,000*** MH 1,118 32,469 0,680 4 79 0,608 CPH 5,800 94,225 1,216 4 79 0,311 DAH 0,728 7,704 1,867 4 79 0,125 FIW 0,110 2,138 1,013 4 79 0,406 FL 13,785 225,594 1,207 4 79 0,315 BCW 0,940 41,703 0,445 4 79 0,776 * p<0.05, ** p<0.01, *** p<0.001
Table 4. MANOVA results of five populations with different NF values based on morphometric characters
Male Statistical Tests Test
Scores F DF1 DF 2 P Pillai’s trace 2,523 1,958 136,00 156,0 0,000*** Wilk’s lambda 0,013 2,102 136,00 145,966 0,000*** Hotelling T2 8,933 2,266 136,00 138,00 0,000*** Roy’s statistic 4,597 5,273 34,00 39,00 0,000***
Female Pillai’s trace 2,608 2,700 136,0 196,0 0,000***
Wilk’s lambda 0,007 3,364 136,0 185,7 0,000***
Hotelling T2 13,778 4,508 136,0 178,0 0,000***
Roy’s statistic 9,415 13,569 34,0 49,0 0,000***
*** P<0,001
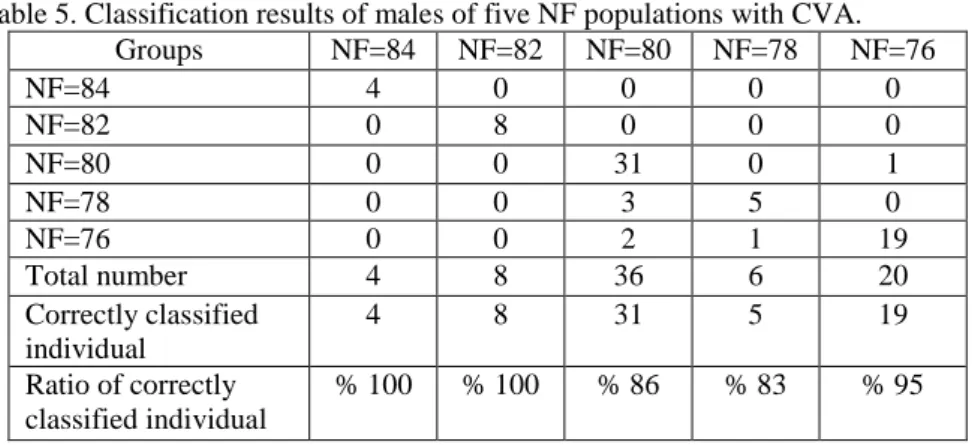
CVA analysis was used to determine morphometric difference between populations with different NF values in Central Anatolia. The first three vectors clarified 91.1 % of total variation in males, while 92.3 % in females. First vector stated 51.5 % of total variation in males, whereas 68.3 % in females (Table 5). A total of 67 male specimens (90.5 %) of the total 74 specimens were correctly grouped to corresponding population. Three specimens from population of NF=80 were classified to population of NF=78 (Table 5). In males, a total of 39 specimens (52.7 %) of the total 74
specimens were correctly grouped to corresponding group with Cross-validation test (Table 6).
Table 5. Classification results of males of five NF populations with CVA.
Groups NF=84 NF=82 NF=80 NF=78 NF=76 NF=84 4 0 0 0 0 NF=82 0 8 0 0 0 NF=80 0 0 31 0 1 NF=78 0 0 3 5 0 NF=76 0 0 2 1 19 Total number 4 8 36 6 20 Correctly classified individual 4 8 31 5 19 Ratio of correctly classified individual % 100 % 100 % 86 % 83 % 95
Table 6. Classification results of males of five NF populations with Cross-validation test Groups NF=84 NF=82 NF=80 NF=78 NF=76 NF=84 3 0 3 1 1 NF=82 0 5 0 0 2 NF=80 1 1 20 2 7 NF=78 0 0 6 2 1 NF=76 0 2 7 1 9 Total number 4 8 36 6 20 Correctly classified individual 3 5 20 2 9 Ratio of correctly classified individual % 75 % 62,5 % 55,6 % 33,3 % 45
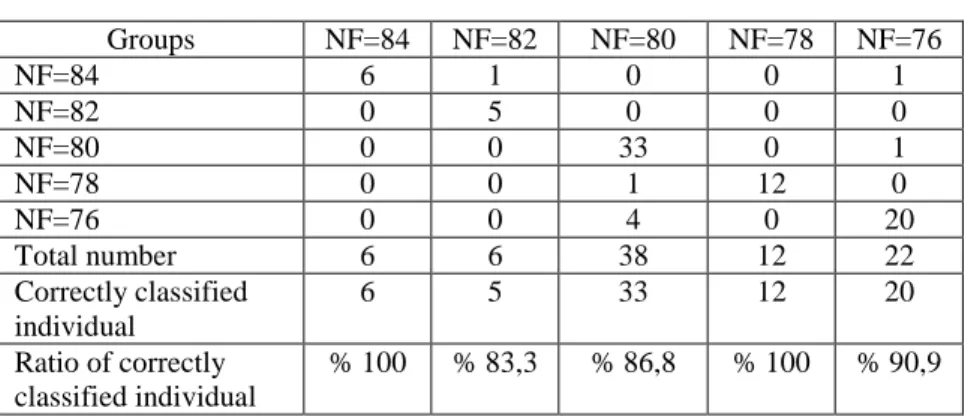
In females, 76 specimens (90.5 %) of the 84 specimens were correctly grouped into corresponding population with CVA. One population of NF= 82 was grouped into population on NF=84, one of the population of NF=80 into population of NF=78 (Table 7). In females, 56 ones (% 66.7) of 84 specimens were correctly grouped with corresponding group with Cross-validation test (Table 8).
Groups NF=84 NF=82 NF=80 NF=78 NF=76 NF=84 6 1 0 0 1 NF=82 0 5 0 0 0 NF=80 0 0 33 0 1 NF=78 0 0 1 12 0 NF=76 0 0 4 0 20 Total number 6 6 38 12 22 Correctly classified individual 6 5 33 12 20 Ratio of correctly classified individual % 100 % 83,3 % 86,8 % 100 % 90,9
Table 8. Classification results of females of five NF populations with Cross-validation test Groups NF=84 NF=82 NF=80 NF=78 NF=76 NF=84 4 1 0 1 2 NF=82 0 5 0 0 0 NF=80 0 0 29 2 3 NF=78 0 0 4 5 4 NF=76 2 0 5 4 13 Total number 6 6 38 12 22 Correctly classified individual 4 5 29 5 13 Ratio of correctly classified individual % 66,7 % 83,3 % 76,3 % 41,7 % 59,1
Populations of NF=84 and 82 distributed in western part of Central Anatolia were grouped into different regions in both males and females in the scatter plot obtained by the CVA scores. When compared to the populations of NF=84 and 82, other populations (NF=80, 78, 76) were grouped more closely to the each other (Figures 8 - 9). Values of Mahalanobis distance matrix (D2) supported to this result. The highest
of Mahalanobis distance estimation was in the populations of NF=84/NF=82 (D2=87.8) and NF=82/NF=78 (D2=60.8). The lowest values were found between
Figure 8. The scatter plot reflects the results of CVA in male specimens of N. leucodon of all populations with five different NF values.
Figure 9. The scatter plot reflects the results of CVA in female specimens of N.
Table 9. Mahalanobis distance matrix shows morphometric differentiations in males and females in N. leucodon populations with five different NF value.
MALE Groups NF=84 NF=82 NF=80 NF=78 NF=76 NF=84 0,00000 NF=82 87,8418 0,00000 NF=80 42,3754 41,6626 0,00000 NF=78 53,6959 60,8132 12,9433 0,00000 NF=76 45,0389 28,2776 10,0831 19,3569 0,00000 FEMALE Groups NF=84 NF=82 NF=80 NF=78 NF=76 NF=84 0,00000 NF=82 66,9339 0,00000 NF=80 53,6474 125,191 0,00000 NF=78 35,4315 110,404 17,4440 0,00000 NF=76 27,5649 80,1643 14,3856 13,3196 0,00000
In the basis of Mahalanobis distance matrix (D2), UPGMA dendogram (both males
and females) was constructed to clarify morphometric differentiations between N.
leucodon populations with five different NF values in Central Anatolia. In both males
and females, UPGMA dendogram clustered five populations into three main branches. The first branch includes three different populations with NF=80, 78, 76 which are distributed in areas that are near to the central part of Central Anatolia. In contrast to this, second and third branches contain populations with NF=82 and NF=84 which are distributed in western parts of Central Anatolia (Figures 10-11).
Figure 10. UPGMA dendogram constructed using Mahalanobis distance matrix in male specimens of N. leucodon with five different NF values.
Figure 11. UPGMA dendogram constructed using Mahalanobis distance matrix in female specimens of N. leucodon with five different NF values
4. DISCUSSION
In Turkey, there are some studies on differentiations of mole rats as well as some fish and amphibian, focused on karyological and molecular aspects. Species of the genus Nannospalax were divided into different subpopulations, which were described based on their chromosomal aspects, in subsoil conditions; humidity, arid, soil structure and geological history (12, 13, 35). According to Nevo et al. (36), increase in chromosome number provides
adaptation to deal with extensive climatic stress and ecological characterizing central Anatolia. Also, some researchers depended intrapopulational differentiations on geological units in Anatolia (12, 13). All show that mole rats are influenced by changes in both underground ecology and distinct geological units. This study is the first to investigate effects of distinct geological units on mole rats in Turkey as using morphological and biometric methods.
According to the Nevo et al. (35, 36), distributions of six different chromosomal forms (2n=38, 40, 50, 54, 60 and 62) of Spalax leucodon are not random. Populations, which have high values in frame of diploid number of chromosomes and allozyme heterozygosity, distribute up to central Anatolia with climatically variable and ecologically more aridity and harsh. Sözen (19) supported the findings of Nevo et al. (35, 36), based on NF populations (18, 32). In this study, distribution areas of five different NF populations belonging to chromosomal form of 2n=60 were determined. Our findings are consistent with those of Nevo et al. (35, 36) and Sözen (19).
Morphometric analysis separated different NF populations using 34 morphometric characters (females, Wilks Lambda=0,007, F=3,364, P<0,000; males, Wilks Lambda=0,013, F=2,102, P<0,000) (Table 9, Figure 10-11).
There are five geologic units in central Anatolia (9). These units can influence geographic speciation of mole rats.According to Hrbek et al. (12, 13) for the genus Aphanius and for the genus Pseudophoxinus, distributions of species of two genera are related to the positions of geological units of Anatolia. We have investigated if there is relationship between populations with distinct NF
and geological units. Our results showed that chromosomal form of 2n=60 divided into distinct NF populations separating in five distinct geological units. In this study, population of NF=80 is in Kırşehir block, NF=78 in Sakarya continent, NF=76 in Kırşehir block, NF=82 in Kırşehir block in at center of Anatolia, in Menderes-Taurus block and areas near to East Taurus, NF=84 in Menderes-Taurus block. Findings of this study are consistent with Hrbek et al. (12, 13). Present study along with Hrbek et al. (12, 13) supported the idea that geographic structure of Anatolia effects on distribution of species in Turkey and biodiversity of Turkey.
As a result, morphometric analysis of populations of 2n=60 chromosomal form of Nannospalax leucodon having distribution in Central Anatolia revealed morphometric differences between populations with different NF values. In the emergence of these differences, it is foreseen that the five geological units (12) in Anatolia are effective.
REFERENCES
[1] S. Gözenç, E. Gümüş ve G. Ertin, Türkiye Coğrafyası. Anadolu Üniversitesi Yayınları: 1069 (1998) 1-13.
[2] P.H. Davis, Disribution Patterns in Anatolia with particular Reference to Endemism, in Davis, Edit. Harper and Hedge, PlantLife of SW Asia, (1971) 15-27.
[3] B. Çıplak, Türkiye Tettigoniidlerinin Anadolu Diyagonaline Göre Yayılışları ve Hareket Yeteneği (Kanat Uzunluğu) ile İlişkisi. II. Ulusal Entomoloji Kongresi Bildirileri, 28-31 Ocak 1992, Adana, (1992) 373-385.
[4] B. Çıplak, A. Demirsoy, and A.N. Bozcuk, Distribution of Orthoptera in Relation to the Anatolian Diagonal in Turkey. Articulata, 8(1): (1993) 1-20.
[5] R. Bilgin, Back to the Suture: The distribution of intraspecific genetic diversity in and around Anatolia. Int. J. Mol. Sci. 12, (2011), 4080-4103.
[6]
I. Savic, and B. Soldatovic, Distribution Range and Evolution of
the Chromosomal Forms in the Spalacidae of the Balkan
Peninsula and Bordering Regions. J. Biogeography, (1979), 6:
363-374.
[7]
E. Kıvanç, Türkiye Spalax’larının Coğrafik Varyasyonları.
Ankara 72 (1988), 88 Sayfa.
[8]
M.D. Gülkaç, E. Yüksel, Türkiye’deki Spalax Tür ve
Alttürlerinin Dağılımına ve Türleşmesine Coğrafik İzolasyonun
Etkisi. Tr. J. of Zoology 23 (1999) Ek Sayı 2, 491-496.
[9] A.M.C. Şengör, and Y. Yilmaz, Tethyan evolution of Turkey: a plate tectonic approach. Tectonophysics 75, (1981) 181–241.
[10] N. Görür, F.Y. Oktay, I. Seymen, and A.M.C. Şengör, Palaeotectonic evolution of the Tuzgölü basin complex, Central Turkey: sedimentary record of a Neo-Tethyan closure. In: Dixon, J.E., Robertson, A.H.F. (Eds.), The Geological Evolution of the Eastern Mediterranean. Geological Society Special Publication No. 17. Blackwell Scientific, Oxford, pp. (1984) 467–482.
[11] W.W. Hay, R. DeConto, C.N. Wold, K.M. Wilson, S. Voigt, M. Schulz, A. Wold-Rossby, W.-C. Dullo, A.B. Ronov, A.N. Baluk-hovsky, E. Soeding, Alternative global cretaceous paleogeography. In: Barrera, E., Johnson, C. (Eds.), The Evolution of Cretaceous Ocean/Climate Systems. Geological Society of America Special Paper 332, (1999) pp. 1–47.
[12] T. Hrbek, K.N. Stölting, F. Bardakci, F. Küçük, R.H. Wildekamp, and A. Meyer, Plate tectonics and biogeographical patterns of the
Pseudophoxinus (Pisces: Cypriniformes) species complex of central
Anatolia, Turkey. Molecular Phylogenetics and Evolution 32 (2004) 297–308.
[13] T. Hrbek, F. Küçük, T. Frickey, K.N. Stölting, R.H. Wildekamp, A. Meyer, Molecular phylogeny and historical biogeography of the
Aphanius (Pisces, Cyprinodontiformes) species complex of central
Anatolia, Turkey. Mol. Phylogenet. Evol. 25, (2002) 125–137.
[14] D.W. Weisrock, J.R. Macey, I.H. Ugurtas, A. Larson, and T.J. Papenfuss, Molecular phylogenetics and historical biogeography among salamandrids of the true salamander clade: rapid branching of numerous highly divergent lineages in Mertensiella luschani associated with the rise of Anatolia. Mol. Phylogenet. Evol. 18, (2001) 434–448. [15] N. Yiğit, E. Çolak, M. Sözen, A. Karataş, Rodents of Türkiye,
[16] İ. Gündüz, M. Jaarola, C. Tez, C. Yeniyurt, P.D. Polly, and J.B. Searle, Multigenic and morphometric differentiation of ground squirrels (Spermophilus, Scuiridae, Rodentia) in Turkey, with a description of a new species. Molecular Phylogenetetics and Evolution, 43; (2007) 916-935.
[17] B. Kryštufek, and V. Vohralík, Mammals of Turkey and Cyprus. Rodentia I: Sciuridae, Dipodidae, Gliridae, Arvicolinae, 292 p, (2005) Založba Annales, Koper.
[18] Ç. H. Şekercioğlu, S. Anderson, E. Akçay, R. Bilgin, Ö. E. Can, G. Semiz, Ç. Tavşanoğlu, M. B. Yokeş, A. Soyumert, K. İpekdal, İ. K. Sağlam, M. Yücel, H. N. Dalfes, Turkey’s globally important biodiversity in crisis, Biological Conversation 144 (2011) 2752-2769. [19] M. Sözen, A karyological study on subterranean mole rats of the Spalax
leucodon Nordmann, 1840 superspecies in Turkey. Zeitschrift für
Säugetierkunde, 69, (2004) 420-429.
[20] T. Kankılıç, E. Çolak, R. Çolak, and N. Yiğit, Allozyme variation in
Spalax leucodon Nordmann, 1840 (Rodentia: Spalacidae) in the area
between Ankara and Beyşehir. Turkish Journal of Zoology. 29, (2005) 377-384.
[21] E. Ivanitskaya, M. Sözen, L. Rashkovetsky, F. Matur, and E. Nevo, Discrimination of 2n=60 Spalax leucodon cytotypes (Spalacidae, Rodentia) in Turkey by means of classical and molecular cytogenetic techniques. Cytogenet Genome Res. 122, (2008) 139-149.
[22] T. Kankılıç, E. Çolak, and T. Kankılıç, Macro-Anatomical and Karyological Features of Two Blind Mole Rat Subspecies (Rodentia: Spalacidae) from Turkey. Anat. Histol. Embryol. 38, (2009) 145-153. [23] T. Kankılıç, Türkiye’deki Spalax leucodon cilicicus Mehely, 1909 ve
Spalax leucodon anatolicus Mehely, 1909 Alttürleri Arasında Genetik
Farklılıkların Belirlenmesi. Doktora Tezi. Ankara Üniversitesi, 198s., Ankara, (2010).
[24] M. Sözen, K. Çataklı, F. Eroğlu, F. Matur, and M. Sevindik, Distribution of chromosomal forms of Nannospalax nehringi (Satunin, 1898) (Rodentia: Sapalacidae) in Çankırı and Çorum provinces, Turkey. Turk J Zool 35(3) (2011) 367-374.
[25] T. Kankılıç, T. Kankılıç, M. Sözen, and E. Çolak, Genetic diversity and geographic variation of chromosomal races of Nannospalax xanthodon (Nordmann, 1840) and Nannospalax ehrenbergi (Nehring, 1898) from Turkey, revealed by RAPD analysis. Acta zool. bulg., 65 (1), (2013) 45-58.
[26] M. Sözen, F. Çolak, M. Sevindik, and F. Matur, Cytotypes of
Nannospalax xanthodon (Satunin, 1898) (Rodentia: Spalacidae) from
western Anatolia. Turk J Zool 37: (2013) 462-469.
[27] T. Kankılıç, T. Kankılıç, P. S. Şeker, and E. Kıvanç, Morphological and biometrical comparisons of the baculum in the genus Nannospalax Palmer, 1903 (Rodentia: Spalacidae) from Turkey with consideration of its taxonomic importance. Turk J Zool. 38: (2014) 144-157.
[28] M. Sözen, F. Çolak, M. Sevindik, and F. Matur, Two new cytotypes and additional karyological records for blind mole rats, Nannospalax
xanthodon and N. ehrenbergi (Mammalia, Rodentia) in Turkey. Folia
Zool. – 64 (2): (2015) 167-172.
[29] G. Yürümez, Y. Çoşkun, Morphological and karyological characterictics of Nannospalax ehrenbergi (Nehring, 1898) (Rodentia: Spalacidae) from Mardin Province. C.B.U Journal of Sciences 1.1 (2005) 29-36.
[30] Y. Çoşkun, Z. A. Hamad, A. Kaya, Morphological properties of
Nannospalax (Rodentia: Spalacidae) distributed in North Iraq,
Hacettepe J. Biol & Chem. (2016), 44 (2), 173-179.
[31] SPSS 15.0 (Statistical Package for Social Sciences) for Windows. www.spss.com. (1989-2007).
[32] STATISTICA (data analysis software system),version 7.1. www.statsoft.com. (2005).
[33] J. Hintze, PAST Kaysville, Utah: NCSS, (2008).
[34] J.F. Rohlf, NTSYS-pc, Numerical Taxonomy and Multivariate Analysis System, Exeter Publishing, Setauket, N.Y. (1993).
[35] E. Nevo, M.G. Filipucci, C.D. Redi, S. Simson, G. Heth, and A. Beiles, Karyotype and genetic evolution in speciation of subterranean mole rats of the genus Spalax in Turkey. Evol. J. Linn. Soc. 54, (1995) 203–229. [36] E. Nevo, M.G. Filipucci, C.D. Redi, A. Korol and A. Beiles, Chromosomal speciation and adaptive radiation of mole-rats in Asia Minor correlated with increased ecological stress. Proc. Natl. Acad. Sci. USA 91: (1994) 8160-8164.