PRESIDENT
Dr. Mustafa AYDIN Istanbul Aydın University, TR HONORARY EDITOR
Prof. Dr. Hasan SAYGIN Istanbul Aydın University, TR EDITOR
Prof. Dr. Hasan Alpay HePeRkAN Istanbul Aydın University, Faculty of engineering
Mechanical engineering Department
Florya Yerleskesi, Inonu Caddesi, No.38, kucukcekmece, Istanbul, Turkey Fax: +90 212 425 57 59 - Tel: +90 212 425 61 51 / 22001
e-mail: [email protected] ASSISTANT EDITOR
Prof. Dr. Oktay ÖzCAN
Istanbul Aydın University, Faculty of engineering e-mail: [email protected]
Ass. Prof. eylem Gülce ÇOkeR
Istanbul Aydın University, Faculty of engineering e-mail: [email protected]
EDITORIAL BOARD
AYDIN Nizamettin Yildiz Technical University, TR
CATTANI Carlo University of Salerno, ITALY
CARLINI Maurizio University “La Tuscia”, ITALY
CHAPARRO Luis F. University of Pittsburg, USA
DIMIROVSkI Gregory M. SS C. and Methodius University, MAC
HARBA Rachid Orleans University, FR
HePBAŞLI Arif Yaşar University, TR
JeNANNe Rachid Orleans University, FR
kOCAkOYUN Şenay Istanbul Aydin University, TR
kONDOz Ahmet University of Surrey, Uk
RUIz Luis Manuel Sanches Universitat Politècnica de València, Spain
SIDDIQI Abul Hasan Sharda University, Indian
STAVROULAkIS Peter Telecommunication System Ins., GR
ADVISORY BOARD
AkAN Aydın Istanbul University, TR
AkATA erol Istanbul Aydin University, TR
ALTAY Gökmen Bahcesehir University, TR
ANARIM, emin Bosphorus University, TR
ASLAN zafer Istanbul Aydin University, TR
ATA Oğuz Istanbul Aydin University, TR
AYDIN Devrim Dogu Akdeniz University, TR
BAL Abdullah Yildiz Technical University, TR
BİLGİLİ erdem Piri Reis University, TR
CekIÇ Yalcin Bahcesehir University, TR
CeYLAN Murat konya Selcuk University, TR
el kAHLOUT Yasser TUBITAk-MAM, TR
eRSOY Aysel Istanbul University, TR
VISUAL DESIGN & ACADEMIC STUDIES COORDINATION OFFICE Nabi SARIBAŞ - Gamze AYDIN - elif HAMAMCI - Çiğdem TAŞ
PRINTED BY
Armoninuans Matbaa Yukarıdudullu, Bostancı Yolu Cad. keyap Çarşı B-1 Blk. No:24 Ümraniye/İstanbul Tel: 0216 540 36 11 Fax: 0216 540 42 72 e-mail: [email protected]
ISSN: 2146-0604
GÜNeRHAN Huseyin ege University, TR
GÜNAY Banihan University of Ulster, Uk
GÜNGÖR Ali Bahcesehir University, TR
HePeRkAN Hasan Istanbul Aydın University, TR
kALA Ahmet Istanbul University, TR
kAR A. kerim Marmara University, TR
kARAMzADeH Saeid Istanbul Aydin University, TR
kARAÇUHA ertuğrul Istanbul Technical University, TR
kARAHOCA Adem Bahcesehir University, TR
kARAkOÇ Hikmet Anadolu University,TR
kARTAL Mesut Istanbul Technical University, TR
keNT Fuad Istanbul Technical University, TR
kILIÇ Niyazi Istanbul University,TR
kINCAY Olcay Yildiz Technical University, TR
kUNTMAN Ayten Istanbul University, TR
kOCAASLAN İlhan Istanbul University, TR
ÖNeR Demir Maltepe University, TR
Öz Hami kafkas University, TR
ÖzBAY Yüksel konya Selçuk University, TR
PAkeR Selçuk Istanbul Technical University, TR
PASTACI Halit Halic University, TR
SAYAN Ömer F. Telecommunications Authority, TR
ŞeNeR Uğur Istanbul Aydın University, TR
SİVRİ Nuket Istanbul University, TR
SÖNMez Ferdi Istanbul Arel University, TR
SOYLU Şeref Sakarya University, TR
UÇAN Osman Nuri Istanbul kemerburgaz University, TR
UĞUR Mukden Istanbul University, TR
YILMAz Aziz Air Force Academy, TR
YILMAz Reyat Dokuz eylul University, TR
International Journal of Electronics, Mechanical and Mechatronics Engineering (IJEMME) is peer-reviewed journal which provides a platform for publication of original scientific research and applied practice studies. Positioned as a vehicle for academics and practitioners to share field research, the journal aims to appeal to both researchers and academicians.
From the Editor
Prof. Dr. Hasan Alpay HEPERKAN
A Comparative Study on Maximum Shear Strain Distribution in a Layered Viscoelastic Medium
Kaveh DEHGHANIAN, Mustafa Tolga YILMAZ ...1571
Structural Performance Assestment of Historical Dilovasi Sultan Suleyman (Diliskelesi)
Bridge in Turkey
Ferit CAKIR...1579
Evaluation of an Experimental Setup Developed For Measuring the Friction Coefficients
From the Editor
International Journal of Electronics, Mechanical and Mechatronics Engineering (IJEMME), is an
international multi-disciplinary journal dedicated to disseminate original, high-quality analytical and
experimental research articles on Robotics, Mechanics, Electronics, Telecommunications, Control Systems,
System Engineering, Biomedical and Renewable Energy Technologies. Contributions are expected to have
relevance to an industry, an industrial process, or a device. Subject areas could be as narrow as a specific
phenomenon or a device or as broad as a system.
The manuscripts to be published are selected after a peer review process carried out by our board of experts
and scientists. Our aim is to establish a publication which will be abstracted and indexed in the Engineering
Index (EI) and Science Citation Index (SCI) in the near future. The journal has a short processing period
to encourage young scientists.
Prof. Dr. Hasan HEPERKAN
Editor
A Comparative Study on Maximum Shear Strain Distribution in a Layered
Viscoelastic Medium
Kaveh DEHGHANIAN
1, Mustafa Tolga YILMAZ
2Abstract - For practical calculations, the ovaling and racking deformations on buried structures are estimated by estimating the maximum shear strain (γmax) in imperforated ground using vertically incident shear waves (Vs). The relationship between maximum shear strain (max )and depth in a uniformly elastic half-space is a function of shear-wave velocity in the uniform medium and acceleration history in free field. In this study, the relationship between the distribution of max in elastic half space and in layered medium is examined by supposing that the travel time of shear waves from the free boundary to a depth of interest in a layered medium is equal to d/Vs. Different variety of strong ground motion time histories and three Vs profiles are used for analyses. The effect of nonlinear material response to shearing was investigated by using the method of equivalent linearization.
Keywords: Shear strain, underground structures, ovaling, racking, free field. 1. Introduction
Underground structures serve as means of transportation, sanitation, irritation and storage. Recent earthquakes such as Kobe (1995), Kocaeli (1999) and Chi-Chi (1999) showed the vulnerabilities of these structures to severe seismic loads. Ovaling and racking deformations due to vertically induced shear waves are the main causes of seismic damages (Hashash et.al, 2001). Analytical solutions using free field approach and soil-structure interaction have been proposed to calculate ground deformations. In free-field approach, it is assumed that the structure conforms to the surrounding ground deformations. Due to lack of in-situ ground deformation data, simplified formulas are used to calculate γmax.
max is generally related to the formula of Newmark, supposing unidirectional wave propagation in an unbounded
uniformly elastic medium, such that
max = vmax / C (1)
where vmax is the maximum particle velocity, and C is the apparent wave velocity (Newmark, 1968; St.John and
Zahrah, 1987; Hashash et.al, 2001). For ovaling analyses, a reasonable simplification for computation of max is to
assume vertically incident shear waves propagating through horizontal layers (Wang, 1993; Hashash et.al, 2001). In that case, C is approximately equal to Vs, the propagation velocity of shear waves in a layer. However, equation (1)
A Comparative Study on Maximum Shear Strain Distribution in a Layered
Viscoelastic Medium
Kaveh DEHGHANIAN
1, Mustafa Tolga YILMAZ
2Abstract - For practical calculations, the ovaling and racking deformations on buried structures are estimated by estimating the
maximum shear strain (γmax) in imperforated ground using vertically incident shear waves (Vs). The relationship between maximum
shear strain (max )and depth in a uniformly elastic half-space is a function of shear-wave velocity in the uniform medium and
acceleration history in free field. In this study, the relationship between the distribution of max in elastic half space and in layered
medium is examined by supposing that the travel time of shear waves from the free boundary to a depth of interest in a layered medium is equal to d/Vs. Different variety of strong ground motion time histories and three Vs profiles are used for analyses. The
effect of nonlinear material response to shearing was investigated by using the method of equivalent linearization.
Keywords: Shear strain, underground structures, ovaling, racking, free field. 1. Introduction
Underground structures serve as means of transportation, sanitation, irritation and storage. Recent earthquakes such as Kobe (1995), Kocaeli (1999) and Chi-Chi (1999) showed the vulnerabilities of these structures to severe seismic loads. Ovaling and racking deformations due to vertically induced shear waves are the main causes of seismic damages (Hashash et.al, 2001). Analytical solutions using free field approach and soil-structure interaction have been proposed to calculate ground deformations. In free-field approach, it is assumed that the structure conforms to the surrounding ground deformations. Due to lack of in-situ ground deformation data, simplified formulas are used to calculate γmax.
max is generally related to the formula of Newmark, supposing unidirectional wave propagation in an unbounded
uniformly elastic medium, such that
max = vmax / C (1)
where vmax is the maximum particle velocity, and C is the apparent wave velocity (Newmark, 1968; St.John and
Zahrah, 1987; Hashash et.al, 2001). For ovaling analyses, a reasonable simplification for computation of max is to
assume vertically incident shear waves propagating through horizontal layers (Wang, 1993; Hashash et.al, 2001). In that case, C is approximately equal to Vs, the propagation velocity of shear waves in a layer. However, equation (1)
yields conservative estimates for max, especially in shallow ranges of depth. The ground max spectrum provides the
INTERNATIONAL JOURNAL OF ELECTRONICS, MECHANICAL AND MECHATRONICS ENGINEERING Vol.8 Num.3 - 2018 (1571-1578)
1 Department of Civil Engineering, Istanbul Aydin University, Istanbul, Turkey, e-mail: [email protected] 2 Department of Engineering Sciences, Middle East Technical University, Ankara, Turkey
relationship between max and depth for an acceleration record on uniformly elastic half space (Chen and Hou, 1992).
By defining the seismic hazard in terms of shear-strain spectrum, it is possible to estimate max reasonably for any
given depth in a uniformly elastic half space. In order to estimate shear strain in actual sites which generally consists of layered geological formations, a relationship relating max spectra in uniformly elastic half space to the distribution
of max in layered soil profiles is necessary. A reasonable method may be the use of equivalent travel-time concept
proposed by Imai et al. (1981) for the estimation of maximum shear-stress in layered medium. This is examined for estimation of max in layered soil profiles. Furthermore, the effect of nonlinearity of soil behavior on the accuracy of
this method is investigated.
2. Shear-Strain Spectrum
The equation of particle motion due to vertically incident shear waves that propagate with velocity Vs in a linearly
elastic medium can be written as
2 2 2 2 2
y
u
V
t
u
s
(2)where, u(t,y) depicts the horizontal displacement of a particle located at coordinate y and at time t due to the disturbance propagating in the vertical direction. The relationship between shear strain () at any depth (d) and shear wave velocity is
d
V
a
V
d
V
s F s F sγ
ω
,
ω
ω
sin
ω
(3)In equation (3), aF denotes the complex Fourier coefficient of acceleration history (a) in free field. Equation (3) can
be expressed in time domain by
s
S
S
st
d
V
v
t
d
V
v
t
d
V
V
2
1
,
γ
(4)where v(t) is the velocity history in free field. Hence, max is a function of d/Vs, the travel time of vertically incident
shear waves from free boundary to a point at depth d (Chen and Hou, 1992).
3. The Concept of Equivalency in Travel Time
Equations (3) and (4) are applicable for uniformly elastic half space. According to Imai et al. (1981), the maximum shear stress (τmax) at any given depth in layered soils can be estimated by supposing that the travel time of vertically
incident shear waves from the free boundary to the depth of interest is equivalent to the travel time in a hypothetically uniform elastic medium. This travel time is calculated by the formula,
l i i i sV
d
V
d
1 (5)INTERNATIONAL JOURNAL OF ELECTRONICS, MECHANICAL AND MECHATRONICS ENGINEERING
Vol.8 Num.3 - 2018 (1571-1578) Kaveh DEHGHANIAN, Mustafa Tolga YILMAz
relationship between max and depth for an acceleration record on uniformly elastic half space (Chen and Hou, 1992).
By defining the seismic hazard in terms of shear-strain spectrum, it is possible to estimate max reasonably for any
given depth in a uniformly elastic half space. In order to estimate shear strain in actual sites which generally consists of layered geological formations, a relationship relating max spectra in uniformly elastic half space to the distribution
of max in layered soil profiles is necessary. A reasonable method may be the use of equivalent travel-time concept
proposed by Imai et al. (1981) for the estimation of maximum shear-stress in layered medium. This is examined for estimation of max in layered soil profiles. Furthermore, the effect of nonlinearity of soil behavior on the accuracy of
this method is investigated.
2. Shear-Strain Spectrum
The equation of particle motion due to vertically incident shear waves that propagate with velocity Vs in a linearly
elastic medium can be written as
2 2 2 2 2
y
u
V
t
u
s
(2)where, u(t,y) depicts the horizontal displacement of a particle located at coordinate y and at time t due to the disturbance propagating in the vertical direction. The relationship between shear strain () at any depth (d) and shear wave velocity is
d
V
a
V
d
V
s F s F sγ
ω
,
ω
ω
sin
ω
(3)In equation (3), aF denotes the complex Fourier coefficient of acceleration history (a) in free field. Equation (3) can
be expressed in time domain by
s
S
S
st
d
V
v
t
d
V
v
t
d
V
V
2
1
,
γ
(4)where v(t) is the velocity history in free field. Hence, max is a function of d/Vs, the travel time of vertically incident
shear waves from free boundary to a point at depth d (Chen and Hou, 1992).
3. The Concept of Equivalency in Travel Time
Equations (3) and (4) are applicable for uniformly elastic half space. According to Imai et al. (1981), the maximum shear stress (τmax) at any given depth in layered soils can be estimated by supposing that the travel time of vertically
incident shear waves from the free boundary to the depth of interest is equivalent to the travel time in a hypothetically uniform elastic medium. This travel time is calculated by the formula,
l i i i sV
d
V
d
1 (5)for the estimation of τmax in the lth layer below the ground surface. Then, max can be calculated by
2 l s l max maxV
(6)where ρl and (Vs)1 are respectively the density and the shear-wave velocity of the layer of interest. Hence, d/Vs
calculated by equation (5) is first substituted in equations (3) or (4) for the estimation of Vsּ(t). Then, by supposing
that Vs = (Vs)1, the maximum absolute value of Vsּ(t) yields max for the lth layer. The procedure can be simplified if
the relationship between d/Vs and Vsּmax is first computed for any given a(t), and then d/Vs calculated by equation (5),
is used for interpolation in the calculated range of Vsּmax.
Equations (3) to (5) are based on the assumption of linearly elastic medium whereas the geological formations are expected to show nonlinear stress-strain response to severe shearing during seismic events. The effect of nonlinear material behavior on max can be involved in calculations by the well-known method of equivalent linearization
(Schnabel et al., 1972). The accuracy of the method was investigated by the comparisons with the 1-dimensional site-response analyses. The program PROSHAKE, computing the dynamic site site-response by the method of equivalent linearization (EduPro Civil Systems, 1998), was used for the determination of max in each layer. In the analyses, the
ground motion was defined for a hypothetical station on the ground surface, so that (t) was computed by the deconvolution technique. The strain-dependent degradation in shear modulus (G), and the increase in material damping (ξ) were modeled by the empirical relationship of Vucetic and Dobry (1991), applicable to lightly over-consolidated fine soils with a Plasticity Index of 15, so that the strain-dependent reduction in material rigidity is significant in the dynamic response analyses. The representative value for ξ and the reduction in G are estimated by supposing that the cyclic amplitude of is equal to 65% of max. (Vs)l is proportional to the square-root of G in the
equivalent-linear method of analysis due to the relation G =ρ× (Vs). The tolerable relative error, the limit for relative
difference between the results of successive iterations, was accepted as 1%. In these analyses, the secant shear modulus is changed for each layer until their values are consistent with max induced in each layer. The same iterative procedure
was implemented in a spread sheet program for the calculation of max by the shear-strain spectrum. 4. Analyses
A number of accelerograms were selected from the strong-motion databases PEER and DAPHNE to collect a sample for the empirical determination of parameters. The emphasis was placed on using the records that involve significant ground-motion amplitudes for buried structures. The PEER database provided filtered records. The records are attributed to the seismic events presented in Table 1. The sites of records were classified according to the site classification system of International Building Code (ICC, 2009). This widely known system is related to the parameter Vs30, the weighted harmonic mean of Vs to the depth of 30 m (Borcherdt, 1994). The site class D is pertinent
to stiff-soil (180 m/s ≤ Vs30 ≤ 360 m/s) condition. The frequencies above 15 Hz can be heavily contaminated for accelerograms by frequency surface waves and by waves reflected from stratified formations. The high-frequency contamination yields amplitudes that are not consistent with the assumptions about the properties of viscoelastic media considered in analyses, and can be suppressed by a low-pass filter to improve the coherence between the velocity profiles and the accelerogram defining the free-field motion (Silva, 1988). Therefore, the records were filtered by a 4-pole/4-pole low-pass Butterworth filter (Akkar and Bommer, 2007). The ground motion records presented in Table 1 were supposed to be the records of ground motion in free field after suppressing the frequencies above 15 Hz.
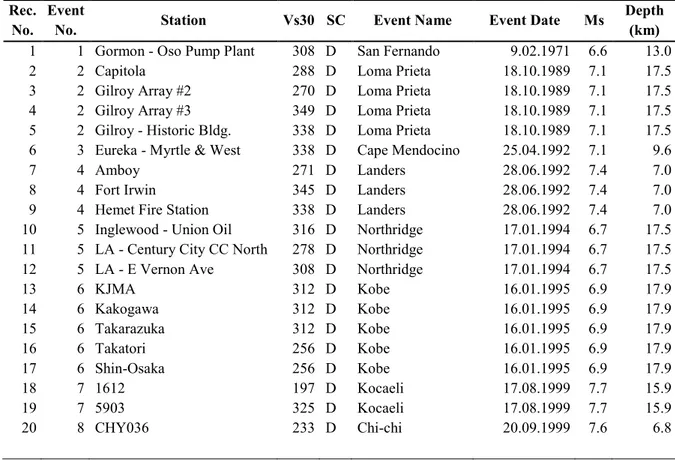
Three real velocity profiles, shown in Figure 1, were considered in site-response analyses. The first profile (Figure 1.a) is adopted from the site Bell-La Bulk Mail presented by Nigbor and Swift (2001). The second and third profiles (1.b, and 1.c) are adopted from the sites Gilroy #2 (USGS) and Palo Alto Veterans Hospital presented by Boore et al. (2003). An elastic half space representing the soft rock was considered to be lying beneath the viscoelastic layers. The distribution of Vs with respect to d/Vs in three sites is shown in Figure 2. d was taken as the average depth of each
uniformly viscoelastic layer. The material density of all actual formations was set to 2000 kg/m3, so that the results of
analyses can be solely attributed to the distribution of Vs.
The records 6 and 16 (Table 1) were scaled by the factor 0.60 to keep max below 1% because the accuracy of equivalent
linearization in site-response analysis can be considerably low if max is greater than 1% (Gerolymos and Gazetas,
2005). Due to the size limitations in the computer program, the record numbered as 20 in Table 1 was cropped to shorten the record length by the 70 seconds that involve the most significant amplitudes of ground motion. The cropped record was filtered at high-pass frequency of 0.1 Hz.
Table 1: The list of ground-motion records. Rec.
No. Event No. Station Vs30 SC Event Name Event Date Ms Depth (km)
1 1 Gormon - Oso Pump Plant 308 D San Fernando 9.02.1971 6.6 13.0 2 2 Capitola 288 D Loma Prieta 18.10.1989 7.1 17.5 3 2 Gilroy Array #2 270 D Loma Prieta 18.10.1989 7.1 17.5 4 2 Gilroy Array #3 349 D Loma Prieta 18.10.1989 7.1 17.5 5 2 Gilroy - Historic Bldg. 338 D Loma Prieta 18.10.1989 7.1 17.5 6 3 Eureka - Myrtle & West 338 D Cape Mendocino 25.04.1992 7.1 9.6 7 4 Amboy 271 D Landers 28.06.1992 7.4 7.0 8 4 Fort Irwin 345 D Landers 28.06.1992 7.4 7.0 9 4 Hemet Fire Station 338 D Landers 28.06.1992 7.4 7.0 10 5 Inglewood - Union Oil 316 D Northridge 17.01.1994 6.7 17.5 11 5 LA - Century City CC North 278 D Northridge 17.01.1994 6.7 17.5 12 5 LA - E Vernon Ave 308 D Northridge 17.01.1994 6.7 17.5 13 6 KJMA 312 D Kobe 16.01.1995 6.9 17.9 14 6 Kakogawa 312 D Kobe 16.01.1995 6.9 17.9 15 6 Takarazuka 312 D Kobe 16.01.1995 6.9 17.9 16 6 Takatori 256 D Kobe 16.01.1995 6.9 17.9 17 6 Shin-Osaka 256 D Kobe 16.01.1995 6.9 17.9 18 7 1612 197 D Kocaeli 17.08.1999 7.7 15.9 19 7 5903 325 D Kocaeli 17.08.1999 7.7 15.9 20 8 CHY036 233 D Chi-chi 20.09.1999 7.6 6.8
INTERNATIONAL JOURNAL OF ELECTRONICS, MECHANICAL AND MECHATRONICS ENGINEERING
Vol.8 Num.3 - 2018 (1571-1578) Kaveh DEHGHANIAN, Mustafa Tolga YILMAz
Three real velocity profiles, shown in Figure 1, were considered in site-response analyses. The first profile (Figure 1.a) is adopted from the site Bell-La Bulk Mail presented by Nigbor and Swift (2001). The second and third profiles (1.b, and 1.c) are adopted from the sites Gilroy #2 (USGS) and Palo Alto Veterans Hospital presented by Boore et al. (2003). An elastic half space representing the soft rock was considered to be lying beneath the viscoelastic layers. The distribution of Vs with respect to d/Vs in three sites is shown in Figure 2. d was taken as the average depth of each
uniformly viscoelastic layer. The material density of all actual formations was set to 2000 kg/m3, so that the results of
analyses can be solely attributed to the distribution of Vs.
The records 6 and 16 (Table 1) were scaled by the factor 0.60 to keep max below 1% because the accuracy of equivalent
linearization in site-response analysis can be considerably low if max is greater than 1% (Gerolymos and Gazetas,
2005). Due to the size limitations in the computer program, the record numbered as 20 in Table 1 was cropped to shorten the record length by the 70 seconds that involve the most significant amplitudes of ground motion. The cropped record was filtered at high-pass frequency of 0.1 Hz.
Table 1: The list of ground-motion records. Rec.
No. Event No. Station Vs30 SC Event Name Event Date Ms Depth (km)
1 1 Gormon - Oso Pump Plant 308 D San Fernando 9.02.1971 6.6 13.0 2 2 Capitola 288 D Loma Prieta 18.10.1989 7.1 17.5 3 2 Gilroy Array #2 270 D Loma Prieta 18.10.1989 7.1 17.5 4 2 Gilroy Array #3 349 D Loma Prieta 18.10.1989 7.1 17.5 5 2 Gilroy - Historic Bldg. 338 D Loma Prieta 18.10.1989 7.1 17.5 6 3 Eureka - Myrtle & West 338 D Cape Mendocino 25.04.1992 7.1 9.6 7 4 Amboy 271 D Landers 28.06.1992 7.4 7.0 8 4 Fort Irwin 345 D Landers 28.06.1992 7.4 7.0 9 4 Hemet Fire Station 338 D Landers 28.06.1992 7.4 7.0 10 5 Inglewood - Union Oil 316 D Northridge 17.01.1994 6.7 17.5 11 5 LA - Century City CC North 278 D Northridge 17.01.1994 6.7 17.5 12 5 LA - E Vernon Ave 308 D Northridge 17.01.1994 6.7 17.5 13 6 KJMA 312 D Kobe 16.01.1995 6.9 17.9 14 6 Kakogawa 312 D Kobe 16.01.1995 6.9 17.9 15 6 Takarazuka 312 D Kobe 16.01.1995 6.9 17.9 16 6 Takatori 256 D Kobe 16.01.1995 6.9 17.9 17 6 Shin-Osaka 256 D Kobe 16.01.1995 6.9 17.9 18 7 1612 197 D Kocaeli 17.08.1999 7.7 15.9 19 7 5903 325 D Kocaeli 17.08.1999 7.7 15.9 20 8 CHY036 233 D Chi-chi 20.09.1999 7.6 6.8
SC: site class (International Code Council).
(a) (b) (c)
Figure 1: Velocity profile used for the site response analyses for (a) Bell - La Bulk Mail site, for (b) Gilroy #2
(USGS), and for (c) Palo Alto Veterans Hospital.
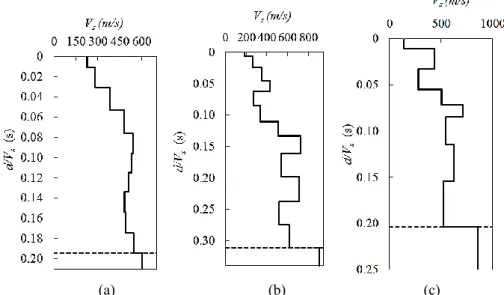
Figure 3 shows the range of geometric means of maximum strain ratio (max-l/max) for two horizontal components of
ground motion used in PROSHAKE analyses, such that a linear relationship between stress and strain is considered. max-l denotesmaximum absolute shear strain computed by PROSHAKE. Vsּmax is calculated by equation (3) or (4).
Then, max is calculated by supposing that Vs= (Vs)l. The comparisons of figures (2) and (3) reveal that this analysis is
very sensitive to the variability in Vs. An investigation of the ratio between Vs in soft layers and that in stiffer layers
shows that the method may slightly underestimate max in soft layers located beneath much stiffer layers. However,
the predictions are conservative for most of the layers. For instance, the lowest Vs ratio (0.62) occurs at the travel time
0.07 s at the site Gilroy #2 (USGS), such that max-l/max is 1.16. In contrast, at the site Bell - La Bulk Mail site, the Vs
ratio is the highest (0.94) for d/Vs = 0.14 s, but max-l/max is almost 1.0. Whereas, at the site Palo Alto Veterans Hospital
the Vs ratio is considerably low (0.64) for d/Vs = 0.05 s, which is close to the minimum ratio at the site Gilroy #2
(USGS), but the underestimation of max is negligible. One important observation is that, the scattering of max-l/max
for any given d/Vs is very limited.
0 10 20 30 40 50 60 70 80 90 100 0 150 300 450 600 d (m) Vs (m/s)
Elastic Half Space
0 20 40 60 80 100 120 140 160 180 200 0 200 400 600 800 d (m) Vs (m/s)
Elastic Half Space
0 20 40 60 80 100 120 140 0 200 400 600 800 d (m) Vs (m/s)
(a) (b) (c)
Figure 2: The travel times for middle geological layers on the sites (a) Bell - La Bulk Mail, (b) Gilroy #2 (USGS),
and (c) Palo Alto Veterans Hospital.
(a) (b)
(c)
Figure 3: The ranges of max-l/max computed by supposing linear response of layers on the sites (a) Bell - La Bulk
Mail, (b) Gilroy #2 (USGS), and (c) Palo Alto Veterans Hospital.
0 0.5 1.0 1.5 2.0 0 0.05 0.10 0.15 0.20 max-l / max d / V s (s ) median 0 0.5 1.0 1.5 2.0 2.5 3.0 0 0.05 0.10 0.15 0.20 0.25 0.30 max-l / max d / V s (s ) median 0 0.5 1.0 1.5 2.0 0 0.05 0.10 0.15 0.20 0.25 max-l / max d / V s (s ) median
INTERNATIONAL JOURNAL OF ELECTRONICS, MECHANICAL AND MECHATRONICS ENGINEERING
Vol.8 Num.3 - 2018 (1571-1578) Kaveh DEHGHANIAN, Mustafa Tolga YILMAz
(a) (b) (c)
Figure 2: The travel times for middle geological layers on the sites (a) Bell - La Bulk Mail, (b) Gilroy #2 (USGS),
and (c) Palo Alto Veterans Hospital.
(a) (b)
(c)
Figure 3: The ranges of max-l/max computed by supposing linear response of layers on the sites (a) Bell - La Bulk
Mail, (b) Gilroy #2 (USGS), and (c) Palo Alto Veterans Hospital.
0 0.5 1.0 1.5 2.0 0 0.05 0.10 0.15 0.20 max-l / max d / V s (s ) median 0 0.5 1.0 1.5 2.0 2.5 3.0 0 0.05 0.10 0.15 0.20 0.25 0.30 max-l / max d / V s (s ) median 0 0.5 1.0 1.5 2.0 0 0.05 0.10 0.15 0.20 0.25 max-l / max d / V s (s ) median
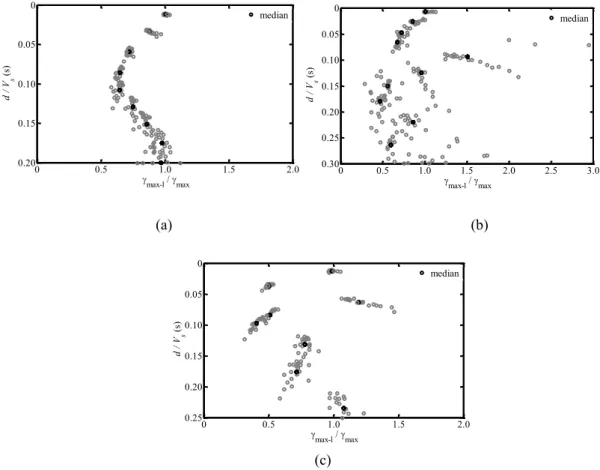
In order to investigate the effect of nonlinearity of soils’ response to shearing, the same profiles were analyzed by using the relationships between ξ, (G/Gmax) and cyclic amplitude of that were suggested by Vucetic and Dobry
(1991). Figure 4 shows the scattering of max-l/max by d/Vs. The comparisons of figures (3) and (4) reveals that the
scattering of max-l/max and the underestimation of equation (3) for embedded soft layers can be more prominent if the
soils behave nonlinearly. Thiscan be explained by the reduction in G, consequently in equivalent Vs. Except for these
soft layers embedded in much stiffer layers, equation (3) usually yields a reasonable or conservative estimate for max.
(a) (b)
(c)
Figure 4: The ranges of max-l/max computed by supposing nonlinear response of layers on the sites (a) Bell - La
Bulk Mail, (b) Gilroy #2 (USGS), and (c) Palo Alto Veterans Hospital.
6. Conclusions
The assumption that the parameter Vsּmax in any soil layer is strongly related to the travel time of shear waves from
ground surface to the depth of interest yields a method for the estimation of max, provided that the shear-strain
spectrum suggested by Chen and Hou (1992) is available. Therefore, in calculation of seismic hazard for buried structures and in the selection of ground-motion records, the emphasis should be given to this spectrum. However, strain ratio is sensitive to the site layering, and may show limited scattering. The procedure explained in this study may result in the underestimation of max in soft layers embedded in much stiffer layers. Detailed site-response analyses
for the calculation of max in such soft layers are observed to be crucial. Otherwise, the method yields either reasonably
accurate or conservative estimates for max in layered geological formations. The accuracy of the method is very
satisfactory for almost uniform Vs profiles. All conclusions are based on the assumption that the ground motion is
0 0.5 1.0 1.5 2.0 0 0.05 0.10 0.15 0.20 max-l / max d / V s (s ) median 0 0.5 1.0 1.5 2.0 2.5 3.0 0 0.05 0.10 0.15 0.20 0.25 0.30 max-l / max d / V s (s ) median 0 0.5 1.0 1.5 2.0 0 0.05 0.10 0.15 0.20 0.25 max-l / max d / V s (s ) median
induced by a field of vertically propagating shear waves. Hence, the proposed method can be acceptable for first-order estimations of max, particularly in the absence of the data necessary for more accurate analysis methods, if the seismic
hazard is expressed by a shear-strain spectrum.
References
[ 1] Akkar, S. and Bommer, J. (2007). Empirical Prediction Equations for Peak Ground Velocity Derived from Strong-Motion Records from Europe and the Middle East, Bulletin of the Seismological Society of America, Vol. 97, No.
2, pp. 511–530.
[ 2] Borcherdt, RD. (1994). Estimates of Site-Dependent Response Spectra for Design (Methodology and Justification). Earthquake Spectra, Vol.10, No.4, pp. 617-653.
[ 3] Boore, D.M., Gibbs, F. and Rodriguez, M. (2003). A compendium of P- and S-wave velocities from
surface-to-borehole logging; summary and reanalysis of previously published data and analysis of unpublished data.
Open-File Report 2003-191, USGS, California, United States of America.
[ 4] Chen, CH. and Hou, PC. (1992). Response Spectrum of Ground Shear Strain. 10th World Conference on
Earthquake Engineering, Rotterdam.
[ 5] Daphne, Strong Ground Motion Database of Turkey. (15 May 2014). http://daphne.deprem.gov.tr/2K/ daphne_v4.php.
[ 6] ICC, International Code Council. (2009). International Building Code, the United States.
[ 7] EduPro Civil Systems. (1998). PROSHAKE – Ground Response Analysis Program, EduPro Civil Systems Inc., Redmond, Washington.
[ 8] Gerolymos, N. and Gazetas G. (2005). Constitutive Model for 1-D Cyclic Soil Behavior Applied to Seismic Analysis. Soils and Foundations, Vol. 45, No.3, pp. 147-159.
[ 9] Hashash, YMA, Hook, JJ, Schmidt, B and Yao JIC. (2001). Seismic Design and Analysis of Underground Structures. Tunneling and Underground Space Technology, Vol.16, No.4, pp.247–293.
[ 10] Imai T, Tonouchi K. and Kanemori T. (1981). The Simple Evaluation Method of Shear Stress Generated by
Earthquakes in Soil Ground. Bureau of Practical Geological Investigation: Japan, pp. 39-58.
[ 11] Newmark, NM. (1968). Problems in Wave Propagation in Soil and Rock. Symposium on Wave Propagation and Dynamic Properties of Earth Materials, August 23-25, Univ. of New Mexico Press, Albuquerque, NM, pp. 7-26.
[ 12] Nigbor, R.L. and Swift J.N. (2001). Resolution of Site Response Issues from the Northridge Earthquake, ROSRINE/ USC-01, Revision 0.9, 26 November.
[ 13] PEER Strong Ground Motion Database. (15 May 2014). http://peer.berkeley.edu/smcat/.
[ 14] Schnabel, PB, Lysmer, J. and Seed, HB. (1972). SHAKE: A Computer Program for Earthquake Response
Analysis of Horizontally Layered Sites. Report No. UCB/EERC-72/12, Earthquake Engineering Research Center,
University of California, Berkeley, pp. 1-92.
[ 15] Silva, W. (1988). Soil Response to Earthquake Ground Motion, EPRI NP-5747 Final Report, Woodward-Clyde Consultants, California.
[ 16] St. John, CM. and Zahrah, TF. (1987). Aseismic Design of Underground Structures. Tunneling and
Underground Space Technology, Vol. 2, No. 2, pp. 165 -197.
[ 17] Vucetic, M. and Dobry, R. (1991). Effect of Soil Plasticity on Cyclic Response. Journal of Geotechnical
Engineering, Vol.117, No.1, pp. 89-107.
[ 18] Wang, JN. (1993). Seismic Design of Tunnels, a Simple State-of-the-Art Design Approach. Parsons Brinckerhoff Inc. Publication, New York, pp. 53-133.
Structural Performance Assestment of Historical Dilovasi Sultan Suleyman
(Diliskelesi) Bridge in Turkey
Ferit CAKIR
Abstract - Masonry arch bridges are regarded as the oldest examples of engineered structures in the world and they reflect the
culture of previous civilizations with their various sizes, styles, and spans. These bridges were constructed centuries ago addressing the load-carrying problems of old times. The preservation of these structures receives a great deal of attention in the structural engineering community. In this respect, current study focuses on historical Dilovası Sultan Suleyman (Diliskelesi) Bridge in Kocaeli, Turkey. In order to investigate the structural behavior of the current form of the bridge, Modal and Response Spectrum analyses were carried out utilizing finite element methods.
Keywords: Masonry arch bridges, Dilovası Sultan Suleyman (Diliskelesi) Bridge, Modal Analysis, Response Spectrum Analysis,
Finite Element Method
1. Introduction
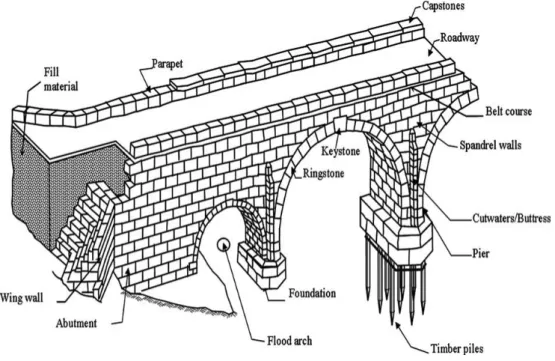
Many masonry bridges have been built in earthquake prone regions of the world and a large portion of them are not seismically safe. Historical arch bridges, encompassing various sizes, styles, and spans reflect the cultures of the previous civilizations. As such, they constitute an important part of the cultural heritage in the world, hence their preservation for the next generation is crucial. Indeed, several of these structures which are over 2000 years old, are already vital components of transportation systems in many communities (Sevim et al. 2011). As a consequence of the long history of arch bridges, many samples exist around the world. Figure 1 provides a typical detail of various components making up a masonry arch bridge. Individual components have their own names that are universally accepted as the terminologies used to identify these components. An essential understanding of the structural behavior of masonry arch bridges requires information about their structural elements.
INTERNATIONAL JOURNAL OF ELECTRONICS, MECHANICAL AND MECHATRONICS ENGINEERING Vol.8 Num.3 - 2018 (1579-1588)
induced by a field of vertically propagating shear waves. Hence, the proposed method can be acceptable for first-order estimations of max, particularly in the absence of the data necessary for more accurate analysis methods, if the seismic
hazard is expressed by a shear-strain spectrum.
References
[ 1] Akkar, S. and Bommer, J. (2007). Empirical Prediction Equations for Peak Ground Velocity Derived from Strong-Motion Records from Europe and the Middle East, Bulletin of the Seismological Society of America, Vol. 97, No.
2, pp. 511–530.
[ 2] Borcherdt, RD. (1994). Estimates of Site-Dependent Response Spectra for Design (Methodology and Justification). Earthquake Spectra, Vol.10, No.4, pp. 617-653.
[ 3] Boore, D.M., Gibbs, F. and Rodriguez, M. (2003). A compendium of P- and S-wave velocities from surface-to-borehole logging; summary and reanalysis of previously published data and analysis of unpublished data. Open-File Report 2003-191, USGS, California, United States of America.
[ 4] Chen, CH. and Hou, PC. (1992). Response Spectrum of Ground Shear Strain. 10th World Conference on
Earthquake Engineering, Rotterdam.
[ 5] Daphne, Strong Ground Motion Database of Turkey. (15 May 2014). http://daphne.deprem.gov.tr/2K/ daphne_v4.php.
[ 6] ICC, International Code Council. (2009). International Building Code, the United States.
[ 7] EduPro Civil Systems. (1998). PROSHAKE – Ground Response Analysis Program, EduPro Civil Systems Inc., Redmond, Washington.
[ 8] Gerolymos, N. and Gazetas G. (2005). Constitutive Model for 1-D Cyclic Soil Behavior Applied to Seismic Analysis. Soils and Foundations, Vol. 45, No.3, pp. 147-159.
[ 9] Hashash, YMA, Hook, JJ, Schmidt, B and Yao JIC. (2001). Seismic Design and Analysis of Underground Structures. Tunneling and Underground Space Technology, Vol.16, No.4, pp.247–293.
[ 10] Imai T, Tonouchi K. and Kanemori T. (1981). The Simple Evaluation Method of Shear Stress Generated by Earthquakes in Soil Ground. Bureau of Practical Geological Investigation: Japan, pp. 39-58.
[ 11] Newmark, NM. (1968). Problems in Wave Propagation in Soil and Rock. Symposium on Wave Propagation and Dynamic Properties of Earth Materials, August 23-25, Univ. of New Mexico Press, Albuquerque, NM, pp. 7-26.
[ 12] Nigbor, R.L. and Swift J.N. (2001). Resolution of Site Response Issues from the Northridge Earthquake, ROSRINE/ USC-01, Revision 0.9, 26 November.
[ 13] PEER Strong Ground Motion Database. (15 May 2014). http://peer.berkeley.edu/smcat/.
[ 14] Schnabel, PB, Lysmer, J. and Seed, HB. (1972). SHAKE: A Computer Program for Earthquake Response Analysis of Horizontally Layered Sites. Report No. UCB/EERC-72/12, Earthquake Engineering Research Center, University of California, Berkeley, pp. 1-92.
[ 15] Silva, W. (1988). Soil Response to Earthquake Ground Motion, EPRI NP-5747 Final Report, Woodward-Clyde Consultants, California.
[ 16] St. John, CM. and Zahrah, TF. (1987). Aseismic Design of Underground Structures. Tunneling and Underground Space Technology, Vol. 2, No. 2, pp. 165 -197.
[ 17] Vucetic, M. and Dobry, R. (1991). Effect of Soil Plasticity on Cyclic Response. Journal of Geotechnical Engineering, Vol.117, No.1, pp. 89-107.
[ 18] Wang, JN. (1993). Seismic Design of Tunnels, a Simple State-of-the-Art Design Approach. Parsons Brinckerhoff Inc. Publication, New York, pp. 53-133.
Figure 1: Main components of a masonry arch bridge (Ural et al. 2008) 2. Seismic Behavior of Masonry Bridges
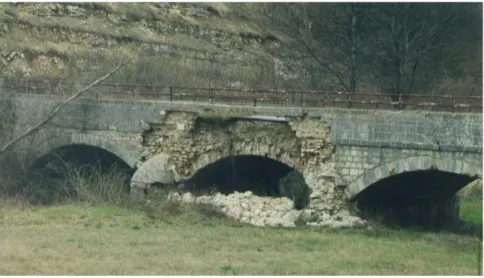
Masonry arch bridges are exposed to many different external and internal effects throughout their lives. An understanding of the load carrying capabilities of these bridges and an estimation of the type and intensity of load on them would be beneficial in order to better understand the performance of these bridges and how they have been able to survive the changes in the loading regime. The fact that many masonry bridges have been able to keep up with these loads and changes is a testimony to the complexity of their structural behaviors. Major loads on masonry bridges are dead loads, live loads, lateral loads, and water and earth forces. Lateral loads are horizontal loads acting on the structures and might be the most dangerous loads for masonry bridges. The most common lateral load is due to earthquake which has a dynamic nature. An earthquake load is a function of the mass of the structure and the intensity of the ground acceleration. Since the nature of earthquakes is random, the timing of the occurrence and the magnitude of the corresponding loads due to earthquake is uncertain. Therefore, the potential damaging effects of earthquakes may become more severe than those of the wind loads. Masonry bridges have large masses due to heavy construction materials such as stones, bricks and mortars. Thus, earthquake load significantly affects masonry bridges. The heavy mass increases the intensity of the force on the bridge. At the same time, the ancient masonry structures lack the structural ductility that is needed to perform well during earthquakes. As a result, the masonry bridges are vulnerable to earthquakes and seismic effects have been among the most important reasons for collapse among masonry bridges. Earthquake loads originate from ground shaking and formation of seismic waves which usually have two major components -- horizontal and vertical. Recent research shows that the horizontal waves are more dangerous than the vertical waves on masonry structures; and many ancient and newer masonry structures have been destroyed due to horizontal waves (Meyer, 2006). According to the reports on earthquake damages on masonry bridges, earthquake damages are observed in the spandrels (Figure 2) or the superstructures (Figure 3) (Cakir and Seker, 2015; Cakir, 2011).
INTERNATIONAL JOURNAL OF ELECTRONICS, MECHANICAL AND MECHATRONICS ENGINEERING Vol.8 Num.3 - 2018 (1579-1588)
Ferit CAKIR
Figure 1: Main components of a masonry arch bridge (Ural et al. 2008) 2. Seismic Behavior of Masonry Bridges
Masonry arch bridges are exposed to many different external and internal effects throughout their lives. An understanding of the load carrying capabilities of these bridges and an estimation of the type and intensity of load on them would be beneficial in order to better understand the performance of these bridges and how they have been able to survive the changes in the loading regime. The fact that many masonry bridges have been able to keep up with these loads and changes is a testimony to the complexity of their structural behaviors. Major loads on masonry bridges are dead loads, live loads, lateral loads, and water and earth forces. Lateral loads are horizontal loads acting on the structures and might be the most dangerous loads for masonry bridges. The most common lateral load is due to earthquake which has a dynamic nature. An earthquake load is a function of the mass of the structure and the intensity of the ground acceleration. Since the nature of earthquakes is random, the timing of the occurrence and the magnitude of the corresponding loads due to earthquake is uncertain. Therefore, the potential damaging effects of earthquakes may become more severe than those of the wind loads. Masonry bridges have large masses due to heavy construction materials such as stones, bricks and mortars. Thus, earthquake load significantly affects masonry bridges. The heavy mass increases the intensity of the force on the bridge. At the same time, the ancient masonry structures lack the structural ductility that is needed to perform well during earthquakes. As a result, the masonry bridges are vulnerable to earthquakes and seismic effects have been among the most important reasons for collapse among masonry bridges. Earthquake loads originate from ground shaking and formation of seismic waves which usually have two major components -- horizontal and vertical. Recent research shows that the horizontal waves are more dangerous than the vertical waves on masonry structures; and many ancient and newer masonry structures have been destroyed due to horizontal waves (Meyer, 2006). According to the reports on earthquake damages on masonry bridges, earthquake damages are observed in the spandrels (Figure 2) or the superstructures (Figure 3) (Cakir and Seker, 2015; Cakir, 2011).
Figure 2: Collapse of spandrel of a masonry bridge during the 1997 Umbria-Marche earthquake
Figure 3: Damages occurred in superstructure of the Misis Bridge during the 1998 Adana-Ceyhan earthquake (Ural
et al. 2008)
3. Historical Dilovası Sultan Suleyman (Diliskelesi) Bridge in Kocaeli
Kocaeli is one of the oldest settlements of Anatolia, which is located in the Marmara Region in Turkey. Established at the intersection of a major road and rail routes between Asia and Europe, Kocaeli is one of the most important industrial sites in the Marmara Region today (Figure 4). The history of Kocaeli dates back to much older times. In the early ages, the region was called Bithynia and different cities were established in the region throughout the history named Olbia, Astakos, Nicomedia, Iznikmid, Izmit and Kocaeli respectively. Due to its historical background, Kocaeli is primarily a cultural destination; it has a rich cultural heritage. One of the well-known historical structures in the region is Dilovası Sultan Suleyman (Diliskelesi) Bridge. Since the bridge is located in socially and culturally active areas, it is intensely used in the present day.
Figure 4: Map of Turkey (Adapted from Google Maps)
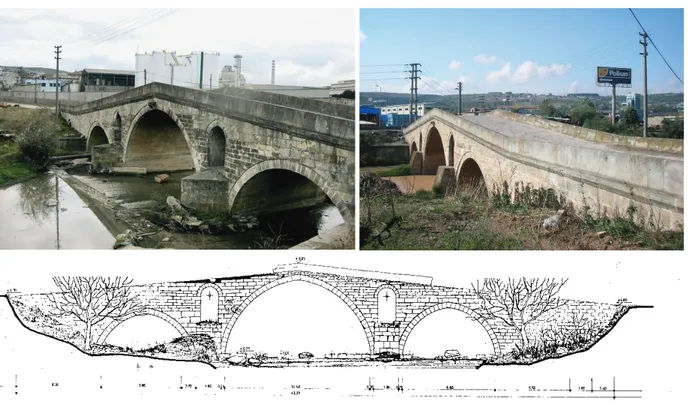
Dilovası Sultan Suleyman (Diliskelesi) Bridge, ordered by Kanuni Sultan Süleyman and built by Architect Sinan in the 16th century, is 45 meters long. The structure is located on a creek with the same name in the Dilovasi district of Kocaeli. The bridge has a small evacuation eye at the end of the middle belt opening which is 10.60 meters. The relatively smaller arches on both sides of the large arch in the middle are made of limestone cut in sharp forms (Kantaratlas, 2018). The keystone of the belt is placed outwardly (Figure 5).
INTERNATIONAL JOURNAL OF ELECTRONICS, MECHANICAL AND MECHATRONICS ENGINEERING Vol.8 Num.3 - 2018 (1579-1588)
Ferit CAKIR
Figure 4: Map of Turkey (Adapted from Google Maps)
Dilovası Sultan Suleyman (Diliskelesi) Bridge, ordered by Kanuni Sultan Süleyman and built by Architect Sinan in the 16th century, is 45 meters long. The structure is located on a creek with the same name in the Dilovasi district of Kocaeli. The bridge has a small evacuation eye at the end of the middle belt opening which is 10.60 meters. The relatively smaller arches on both sides of the large arch in the middle are made of limestone cut in sharp forms (Kantaratlas, 2018). The keystone of the belt is placed outwardly (Figure 5).
Figure 5: Dilovası Sultan Suleyman (Diliskelesi) Bridge (Kantaratlas, 2018; Şükür, 2008)
4. Structural Performance Assessment of historical Dilovası Sultan Suleyman (Diliskelesi) Bridge
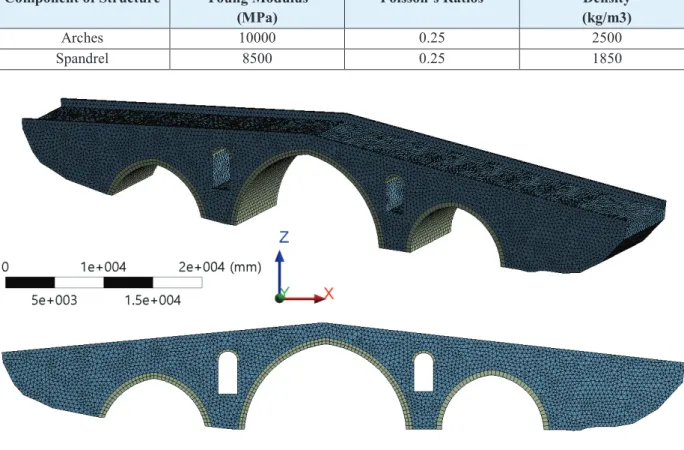
In this study, firstly, the numerical model was prepared using finite element analysis (FEA) program, ANSYS Workbench (2017). In the modeling process, SOLID 65 elements, which have eight nodes and three degrees of freedom per node, was preferred for the description of the bridge. The three-dimensional model was discretized with 317025 nodes and 188775 solid elements (Figure 6). Modal Analysis and Response Spectrum Analysis (RSA) were performed on the numerical model. The obtained analyses results were too complicated to present each node or element, therefore, contour pictures, bars, and scale tables were used to present the results of the analyses. Moreover, fixed boundary conditions were considered in the foundation sections and sidewalls. The mechanical properties used in all numerical analyses are summarized in Table 1 (Cakir and Seker, 2015; Cakir and Uysal, 2014; Cakir et al, 2014).
Table 1: Mechanical properties of the materials
Component of Structure Young Modulus
(MPa) Poisson’s Ratios (kg/m3) Density
Arches 10000 0.25 2500
Spandrel 8500 0.25 1850
Figure 6: Numerical model of the bridge
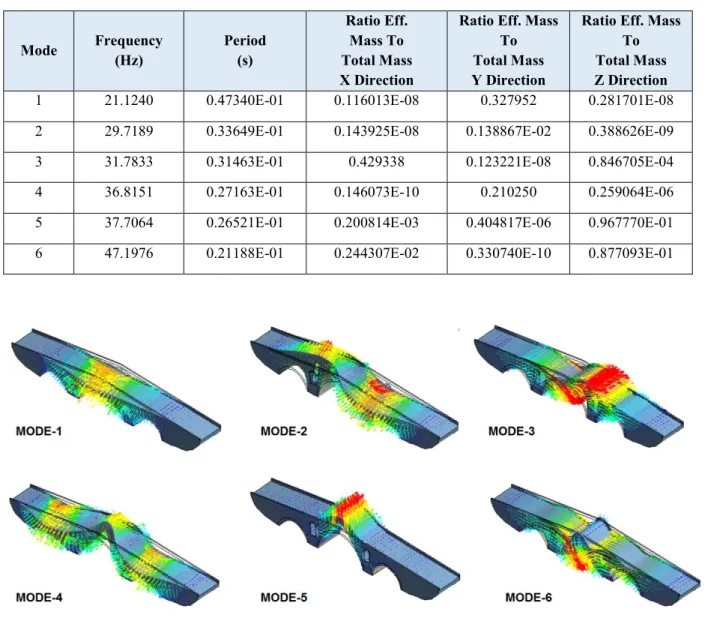
The modal analysis of vibration is simply used to determine mode shapes and characterizing resonant frequencies. Modal analysis changes from a multiple degree of freedom problem to a vibration problem. In the dynamic analysis of the bridge, primarily mode shapes and mode vibration periods were determined; the first four mode frequencies, periods, and mass participation ratios were summarized in Table 2. Furthermore, the first six mode shapes were shown in Figure 7.
Table 2: The first six mode frequencies, periods, and mass participation ratios
Mode Frequency (Hz) Period (s)
Ratio Eff. Mass To Total Mass X Direction
Ratio Eff. Mass To Total Mass Y Direction
Ratio Eff. Mass To Total Mass Z Direction
1 21.1240 0.47340E-01 0.116013E-08 0.327952 0.281701E-08 2 29.7189 0.33649E-01 0.143925E-08 0.138867E-02 0.388626E-09 3 31.7833 0.31463E-01 0.429338 0.123221E-08 0.846705E-04 4 36.8151 0.27163E-01 0.146073E-10 0.210250 0.259064E-06 5 37.7064 0.26521E-01 0.200814E-03 0.404817E-06 0.967770E-01 6 47.1976 0.21188E-01 0.244307E-02 0.330740E-10 0.877093E-01
Figure 7: The first six mode shapes
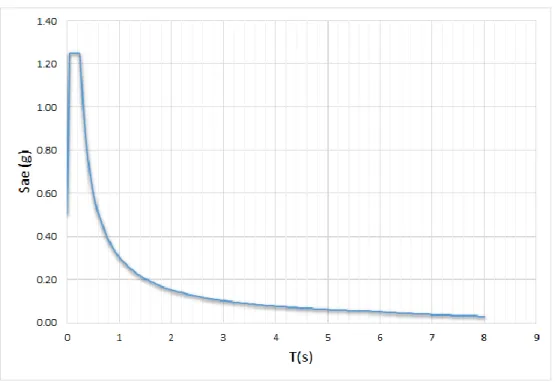
The seismic performance of the bridge was also investigated through RSA conducted on the finite element model in horizontal direction. The response spectrum corresponding to the seismic hazard level was selected by using Turkey's New Earthquake Hazard Map (Figure 8). The simulated ground records for the 475 year return period (the possibility to be exceeded in 50 years is 10%) were used in the evaluation of the bridge.
INTERNATIONAL JOURNAL OF ELECTRONICS, MECHANICAL AND MECHATRONICS ENGINEERING Vol.8 Num.3 - 2018 (1579-1588)
Ferit CAKIR
Table 2: The first six mode frequencies, periods, and mass participation ratios
Mode Frequency (Hz) Period (s)
Ratio Eff. Mass To Total Mass X Direction
Ratio Eff. Mass To Total Mass Y Direction
Ratio Eff. Mass To Total Mass Z Direction
1 21.1240 0.47340E-01 0.116013E-08 0.327952 0.281701E-08 2 29.7189 0.33649E-01 0.143925E-08 0.138867E-02 0.388626E-09 3 31.7833 0.31463E-01 0.429338 0.123221E-08 0.846705E-04 4 36.8151 0.27163E-01 0.146073E-10 0.210250 0.259064E-06 5 37.7064 0.26521E-01 0.200814E-03 0.404817E-06 0.967770E-01 6 47.1976 0.21188E-01 0.244307E-02 0.330740E-10 0.877093E-01
Figure 7: The first six mode shapes
The seismic performance of the bridge was also investigated through RSA conducted on the finite element model in horizontal direction. The response spectrum corresponding to the seismic hazard level was selected by using Turkey's New Earthquake Hazard Map (Figure 8). The simulated ground records for the 475 year return period (the possibility to be exceeded in 50 years is 10%) were used in the evaluation of the bridge.
Figure 8: Earthquake Regions Map of Turkey and Kocaeli
Figure 9: Uniform hazard spectra for the selected seismic hazard level.
The maximum normal stress was found to be 3.6997 MPa around the base section of the small arch of the bridge (Figure 10). The obtained equivalent stress was about 3.0595 MPa around the bridge base (Figure 11). Moreover, the observed maximum lateral displacement was about 1.4514mm at the top of the bridge corresponding to 0.02% drift ratio (Figure 12). Table 3 indicates that at this drift ratio level, the structural response of the bridge is below the immediate occupancy (IO) damage level (0.1%). In the light of the obtained information, it is seen that the structure is quite good in terms of earthquake performance.
Figure 10: Normal stress obtained from the RSA
Figure 11: Equivalent stress obtained from the RSA
INTERNATIONAL JOURNAL OF ELECTRONICS, MECHANICAL AND MECHATRONICS ENGINEERING Vol.8 Num.3 - 2018 (1579-1588)
Ferit CAKIR
Figure 10: Normal stress obtained from the RSA
Figure 11: Equivalent stress obtained from the RSA
Figure 12: Maximum lateral displacement obtained from the RSA
Table 3: Acceptance criteria for unreinforced masonry in-plane walls and piers
Primary members Secondary members Limiting behavioral node Immediate occupancy (IO) (%) Life safety (LS) (%) Life safety (LS) (%) Life safety (LS) (%) Life safety (LS) (%) FEMA 356 Bed-joint sliding 0.1 0.3 0.4 0.6 0.8
FEMA 274 Rocking 0.1 0.3heff/L 0.4heff/L 0.6heff/L 0.8heff/L
ASCE 41 Rocking 0.1 0.3heff/L 0.4heff/L 0.6heff/L 0.8heff/L 5. Conclusions
Historical structures that are built centuries ago reflect the previous civilizations which have passed the world. Today, it is still possible to see some of these structures as a whole. These magnificent structures need to be well protected and preserved due to their historical and cultural values. Many historical structures are located at earthquake prone zones in the world, and the majority of these structures are considered to be seismically inadequate and unsafe. Historical bridges face many inadequacies in terms of seismic performance. Thus, they have to be retrofitted with the convenient restoration methods against earthquake damages. To determine the structural protection requirements for these structures, a deep understanding of their behavior and an effective evaluation of the structural integrity and failure mechanism is needed. The subject of earthquake hazard assessment of a historical structure has gained great attention in the last few decades. A sustained effort on the subject is strongly needed.
This paper briefly investigates the basic principles to be considered in performance-based seismic evaluation of historical structures. The seismic performance evaluation of the historical Sultan Suleyman (Diliskelesi) Bridge in Kocaeli, Turkey is presented. RSA was used for the performance evaluation. The seismic hazard levels, evaluation of existing seismic hazard, selection of earthquake ground motions as well as site geology, geological and tectonic settings of the area, seismic activity of the region and local soil conditions are needed for a thorough evaluation. The results of the analyses show that the critical stresses are calculated in the base section of the bridge and arch. It is also detected that the supports of the arches that carry the spandrel of the bridge deserve special attention since they have a considerable effect in the structural performance.
References
[ 1] ANSYS, (2017). 18.2 Release, Finite Element Analysis Program, USA
[ 2] ASCE 41-06. (2006). Seismic Rehabilitation of Existing Buildings. American Society of Civil Engineers: Reston, VA.
[ 3] Cakir, F. (2011), “Assessment of structural integrity and seismic retrofit of masonry bridges using micropiles”, MSc., Thesis, Department of Civil, Architectural and Environmental Engineering, Graduate College of the Illinois Institute of Technology, Chicago, USA.
[ 4] Cakir, F., Uysal, H. (2014). “Seismic performance of the historical masonry clock tower and influence of the adjacent walls”. Earthquakes and Structures,7(2), 217-231.
[ 5] Cakir, F., Seker, B.S. (2015). “Structural performance of renovated masonry low bridge in Amasya, Turkey”,
Earthquakes and Structures, 8(6), 1387-1406
[ 6] Cakir, F., Seker, B.S. and Dogangun, A. (2014). “Assessment of structural performance of historical Ishan Church with experimental tests and numerical modeling”, Gradevinar,J. Croatian Soc. Civ. Eng., 66(5), 433-443.
[ 7] FEMA 274, (1997). NEHRP Commentary on the Guidelines for the Seismic Rehabilitation of Buildings. Federal Emergency Management Agency: USA.
[ 8] FEMA 356, (2000). Prestandard and Commentary for the Seismic Rehabilitation of Buildings. Federal Emergency Management Agency: USA
[ 9] KantarAtlas, (2018). https://kantaratlas.blogspot.com/2017/11/gebze-bridge.html?view=flipcard
[ 10] Meyer, P.K., (2006). “The impact of high frequency/low energy seismic waves on unreinforced masonry”, M.Sc Thesis, Massachusetts Institute of Technology, Cambridge, USA
[ 11] Sevim, B., Bayraktar A., Altunisik A.C., Atamturktur S. & Birinci F., (2011). “Assessment of nonlinear seismic performance of a restored historical arch bridge using ambient vibrations”, Nonlinear Dynamics (2011) 63: 755–770
[ 12] Şükür, R, (2008). http://www.gazeteulus.com/yuzlerce-yillik-tarihi-miras-mimar-sinan-koprusu.html [ 13] Ural, A., Oruç, Ş., Doğangün, A. & Tuluk Ö İ, (2008), “Turkish historical arch bridges and their
Evaluation of an Experimental Setup Developed For Measuring the Friction
Coefficients
Doğuhan Ufuk IŞIK
1(BSc)
, Prof. Dr. Hüseyin Erol AKATA
2Abstract - In the presented study, an experimental setup was developed in order to measure the friction coefficient and examine
the material flow during upsetting. A grid pattern was printed on the side and upper surfaces of ring shaped test specimen, and photos of the final positions of the grids were taken for different upset ratios. Grid deformation views and the standard procedure for friction coefficient determination were used in the analysis of the ring-compression test results. Two different test materials were upset to different ratios in the tests and the friction coefficients for unlubricated conditions were determined. The friction coefficients are harmonious with similar test results as expected. Variation in the grid dimensions with respect to deformation ratios offer a better analysis for the ring deformations.
Keywords: Friction, Ring - compression, deformation. 1. Introduction
Determination and evaluation of the friction coefficients is a very important issue due to their effect on the material flow pattern and deformation loads during deformation processes. Ring-compression test is a widely used experimental procedure for the determination of the friction coefficients [1, 2]. The outer and inner diameters and the heights of the rings of the material to be deformed are machined according to 6:3:2 ratio and the change in the inner diameter and height are determined for various deformation ratios; obtained results are then inserted on a standard calibration curves chart in order to determine the friction coefficients [1, 3, 4].
Examination of the variation of the deformation on the rings’ surfaces necessary to better analyze the ring compression tests [1, 5, 6]. In order to make a quantitative analysis, a grid pattern is drawn on the side and upper surfaces of the rings and photos of the final positions of the grids are taken for different upset ratios. Grid deformations and the determination procedures of the standard friction coefficient can be used in the analysis of the ring-compression tests. Test specimen were machined with two different testing materials as commercially pure aluminum and Ms 58 Brass, and were upset with different ratios under unlubricated conditions. The results are harmonious with similar test results as expected.
INTERNATIONAL JOURNAL OF ELECTRONICS, MECHANICAL AND MECHATRONICS ENGINEERING Vol.8 Num.3 - 2018 (1589-1592)
References
[ 1] ANSYS, (2017). 18.2 Release, Finite Element Analysis Program, USA
[ 2] ASCE 41-06. (2006). Seismic Rehabilitation of Existing Buildings. American Society of Civil Engineers: Reston, VA.
[ 3] Cakir, F. (2011), “Assessment of structural integrity and seismic retrofit of masonry bridges using micropiles”, MSc., Thesis, Department of Civil, Architectural and Environmental Engineering, Graduate College of the Illinois Institute of Technology, Chicago, USA.
[ 4] Cakir, F., Uysal, H. (2014). “Seismic performance of the historical masonry clock tower and influence of the adjacent walls”. Earthquakes and Structures,7(2), 217-231.
[ 5] Cakir, F., Seker, B.S. (2015). “Structural performance of renovated masonry low bridge in Amasya, Turkey”, Earthquakes and Structures, 8(6), 1387-1406
[ 6] Cakir, F., Seker, B.S. and Dogangun, A. (2014). “Assessment of structural performance of historical Ishan Church with experimental tests and numerical modeling”, Gradevinar,J. Croatian Soc. Civ. Eng., 66(5), 433-443.
[ 7] FEMA 274, (1997). NEHRP Commentary on the Guidelines for the Seismic Rehabilitation of Buildings. Federal Emergency Management Agency: USA.
[ 8] FEMA 356, (2000). Prestandard and Commentary for the Seismic Rehabilitation of Buildings. Federal Emergency Management Agency: USA
[ 9] KantarAtlas, (2018). https://kantaratlas.blogspot.com/2017/11/gebze-bridge.html?view=flipcard
[ 10] Meyer, P.K., (2006). “The impact of high frequency/low energy seismic waves on unreinforced masonry”, M.Sc Thesis, Massachusetts Institute of Technology, Cambridge, USA
[ 11] Sevim, B., Bayraktar A., Altunisik A.C., Atamturktur S. & Birinci F., (2011). “Assessment of nonlinear seismic performance of a restored historical arch bridge using ambient vibrations”, Nonlinear Dynamics (2011) 63: 755–770
[ 12] Şükür, R, (2008). http://www.gazeteulus.com/yuzlerce-yillik-tarihi-miras-mimar-sinan-koprusu.html [ 13] Ural, A., Oruç, Ş., Doğangün, A. & Tuluk Ö İ, (2008), “Turkish historical arch bridges and their
2. Experimental Procedure
An experimental set-up was designed and manufactured in order to perform the ring-upsetting experiments. The dies were machined from H13 hot-wok tool steel and hardened to a level of HRC 54. For other parts of the set-up, the specimen was placed on the die halves concentrically and they were machined from medium carbon steel in order to keep them aligned. The related parts and their alignment of the experimental set up are given in Figure 1.
The ring shaped test specimens were machined from commercially pure aluminum and Ms58 brass rods in 16 mm diameter with 8 mm inner diameter and three different heights; 5 mm, 8 mm and 16 mm. The grid lines of 2 mm spacing were printed on the upper and cylindrical side surfaces of the specimen. The specimen and the grids are shown in the Figure 2.
Figure 1: Experimental set-up photos
INTERNATIONAL JOURNAL OF ELECTRONICS, MECHANICAL AND MECHATRONICS ENGINEERING Vol.8 Num.3 - 2018 (1589-1592)
Doğuhan Ufuk IŞIK, Hüseyin Erol AKATA
2. Experimental Procedure
An experimental set-up was designed and manufactured in order to perform the ring-upsetting experiments. The dies were machined from H13 hot-wok tool steel and hardened to a level of HRC 54. For other parts of the set-up, the specimen was placed on the die halves concentrically and they were machined from medium carbon steel in order to keep them aligned. The related parts and their alignment of the experimental set up are given in Figure 1.
The ring shaped test specimens were machined from commercially pure aluminum and Ms58 brass rods in 16 mm diameter with 8 mm inner diameter and three different heights; 5 mm, 8 mm and 16 mm. The grid lines of 2 mm spacing were printed on the upper and cylindrical side surfaces of the specimen. The specimen and the grids are shown in the Figure 2.
Figure 1: Experimental set-up photos
Figure 2: Test specimen and the grid lines (The ones on the left are Aluminum and the right are Brass)
3. Experimental Results
Ring compression tests were carried out at the civil engineering material test laboratory of Istanbul Aydin University with a 1000 kN Universal tension-compression test machine at 1 mm/min test speed in unlubricated conditions. The specimen’s photographs were taken before and after each upsetting operation, and heights were measured and recorded. A typical load-displacement curve photo is given in Figure 3.
The inner and outer diameters and heights of the ring specimen were measured and checked from the photos taken. The results were inserted into the standard ring compression calibration curves that were taken from literature and digitalized as MS Excel curves. The results are shown in Figure 4. Side views of the test specimen are given in Figure 5. The grid deformations can be seen in the photos.
Figure 3: A typical Load-displacement print-out from testing machine.
a
Figure 5: Side grid photos of the ring specimen.
As it can be seen in Figure 4, the friction coefficient values lie between μ 0,1 and 1,15 which are normal for unlubricated, dry friction of metal to metal contact conditions. The experimental results are harmonious with the literature indicating that the experimental set-up and the used procedure are acceptable for such works.
4. Conclusions
In the presented study, an attempt was made to obtain material flow pattern and friction coefficients in ring compression standard test. The experimental results are harmonious with the literature. The grid measurements and their evaluation have a potential in the deformation analysis studies.
5. Acknowledgements
Authors wish to thank to Istanbul Aydin University, Civil Engineering Material Test Laboratory for their help during the experimental studies.
References
[1] Male AT, Cockroft MG. “A method for the deformation of coefficient of friction of metals under bulk plastic deformation”. J Ins Met 1964– 1965;93:38–46.
[2] Koboyashi S. “Deformation characteristics and ductile fracture at 1040 steel in simple upsetting of solid cylinders and rings”. ASME Paper 69-WA/Prod-14 1–8; 1970.
[3] Lange K. “Handbook of metal forming”. USA: McGraw-Hill International Book Company; 1985.
[4] Dieter GE. “Mechanical metallurgy. second ed”. Japan: McGraw-Hill International Book Company; 1984. [5] Sahin M, Cetinarslan CS, Akata HE; “Effect of Surface Roughness on Friction Coefficients During Upsetting Processes for Different Materials”, Materials & Design 28 (2): 633-640 2007
[6] Rajesh E, SivaPrakash M., “Analysis of friction factor by employing the ring compression test under different lubricants” International Journal of Scientific & Engineering Research, Volume 4, Issue 5, 1163-1170, May-2013 1163 ISSN 2229-5518