METHODS OF INFORMATION SEARCH AND
DATAANALYSIS
Shirdokht ZIARATI Dogus University, ISTAN BU L
Abstract: This article is an attempt to propose a methodology for information search
and data analysis. The aim is to help field researchers to measure concept, to develop appropriate tabulation and to inform about the problem of percentage and Index in data analysis.
There are six important stages: Observation, Information search design (Problem-posing), Data analysis design, Methodology, Experimentation, and analysis of results.
Key words: Methodology, Information-search, Data-analysis, Observation, Hypothesis, Concepts, Measurement, Experimentation, Percentage and Index
Özet: Bu makale, araştırma ve veri analizi için bir metodoloji sunma çabasıdır.
Amaç, kavram ölçümüne, tablo planlamasına bir örnek oluşturarak alan araştımala- rına yardımcı olmak ve veri analizi Indeks’i ve yüzde oranlaması problemi konula rında bilgi vermektir.
Altı önemli aşama vardır: Gözlem, Biligi araştıma tasarımı, veri analizi tasarımı, me todoloji, deney yapma ve sonuçların değerlendirilmesi
Anahtar kelimeler: Metodoloji, Araştıma, Veri-analizi, Gözlem, Hipotez, Kavram lar, Ölçme, Deney, Yüzde Oranı ve Index.
1- OBSERVATION
Working in the field and/or studying the documents, speaking with the specialists and so forth can be observation. For example, our observation in one business process shows us a problem in the strategy of management. We want to have more information about this problem and find a solution. Observation(s) help us to select a problem, or we find one subject more interesting than others to study. Using an on-line search facility, known as the Search Bank on Internet, many articles, papers and books may be found to help us. After classification of them, we may find one aspect of this subject, which may not have been studied (or a part of an earlier study, which inspires us to develop it further). This aspect can be the title for our study. After selecting a problem we must think about the topic. It is not enough only to choose a topic, but giving a description of the title and clarify the focus of our study.
2- INFORMATION SEARCH DESIGN
2.1. Problem-posing and hypothesis: After selecting a problem and describing it, the second stage is posing the key question, predicting the answer and formulating the hypothesis. The key question should have at least one variable (factor). However a hypothesis has two variables and it pre-supposes a relationship between two variables.
A question can be simple or complex. For example: how has the productivity been reported in a business process in the company A? This is a simple question and the answer is a description . A complex question often starts with why. Why is the rate of the cost-efficiency higher in company A than company B? This question is complex and the answer is an explication. A study can be descriptive or analytic. A hypothesis predicts the answer to a complex question. For example: the rate of cost-efficiency is higher in company A because the human resource is more qualified than B. Rate of cost-efficiency is first variable which is depended on the second variable: the qualification of the personnel. Then Y= f (X). Y is called the "dependant variable" that varies depending on the value of "independent variable" X. A research can confirm a hypothesis or refuse it.
Reviewing the literature can help us to construct the hypothesis. If we can not find the publications on the subject, it is better stating the key questions. When a subject is new and nobody has studied it before, our study can become a "pilot study" on that subject.
2.2. Definition of concepts and the measurements: Identifying the variables, defining the concepts and creation of indicators is the second part of "information search design".
In each key question or hypothesis, we have one or two concepts to define. After definition we must find or create a scale to measure each concept. For example what does "cost-efficiency" mean and how it is measured? In a university, cost-efficiency can be calculated by counting all the costs (personnel salary, rent of the building, electricity and so on). Efficiency can be calculated on the base of the success of the students in the examinations (internal efficiency) and their success in professional
life after university (external efficiency). You see how difficult it is to define such complex concepts especially "external efficiency". Perhaps the researcher decides to limit his/her definition to internal efficiency, or perhaps he/she decides to see a given employment factors as the indicator of external efficiency.
3. DATAANALYSIS DESIGN
Data analysis can be done when the data is classified and presented in tables and /or graphics. We give an example of one of our researches by fieldwork: "Problems of regional development: A study of factors influencing highly educated personnel to work in a province". The selected problem was why the highly educated persons do not want to work in province. One of our hypotheses was that the personnel who are not satisfied with their work environment do not want to work in a province. In this hypothesis we had two variables: the independent variable is "perception of the work environment" and our dependent variable is "decision to remain or leave".
See the Index and the Scale for measurements of these two variables.
Index of Decision to Remain or Leave combined the following questions:
□ a. Have you considered staying in this city for some period of time
b. (1) Yes (0) No
If yes, for how long:
□ (1) Less than one year
(2) 1 to 3 years
(3) 3 to 5 years
(4) 5 years or more
c. If less than 5 years or none of the above: Under what conditions
Would you consider staying longer?
Originally the scale was developed from highly mobile to less mobile as follows:
Highly Mobile
(1) Would not stay in city under any condition
(2) Does not consider staying now but would stay under certain conditions.
(3) Considers staying for less than 1 year and would not stay under any condition.
(4) Considers staying for less than 1 year but would stay longer under certain condi tions
(5) Considers staying 1 to 3 years and would not stay longer under any condition.
(6) Considers staying 1 to 3 years but would stay longer under certain conditions.
(7) Considers staying from 3 years to 5 years and would not stay any longer under any condition.
(8) Considers staying from 3 years to 5 years but would stay longer under certain conditions.
(9) Considers staying 5 years or more.
Less Mobile
However, because of the small size of the "universe" (population) many categories were empty and the following combinations were made for the purpose of analysis:
Highly Mobile
1- Does not consider staying/ or Considers staying for some period but would not stay longer under any condition/ or considers staying for less than one year but would stay longer under certain conditions
2- Considers staying for one to three years but would stay longer under certain conditions
3- Considers staying for three to five years but would stay longer under certain condition
4- Considers staying five years or more
Less Mobile
Developing a measure of satisfaction with work environment:
To develop a methodology to measure the level of satisfaction with the work environment, first it is necessary to establish the perception of employees on a number of items related to Herzberg's hygiene and motivation factors as cited in Ziarati,R (1995).
Index of hygiene and motivation factors
Answer box: Items
I I (1) Interpersonal Relations
I I (2) Competent Supervision, Knowledge of Work
I I (4) Physical Conditions of Work, Comfort, etc
I I (5) Transportation Arrangements Accommodation when Travelling
I I (6) Rest Periods and Lunch Facilities
I I (7) Factors Affecting Personal Life, (place of Living, Working Hours, Vacation)
I I (8) Fringe Benefits, Pension, Medical Insurance
I I (9) Pay Unit of Money you receive from the Organisation
I I (10) Possibility of Growth Opportunity to Develop Skills, Acquire New Skills
I I (11) Advancement-Improvement in Status or Position in Organisation
I I (12) Appraisal System-Objective Method for Evaluating Quality and Quantity of Work Performed
I I (13) Salary Structure Appropriate Salary for Various Positions at Different Levels
The answer box column on the left-hand side of the list above relates to the scale of satisfaction (see below). Each box needs to have a number between 1 and 7. 1 means dissatisfied and seven means very satisfied. The scale of satisfaction ranges from dissatisfied to very satisfied as presented below:
Scale of Satisfaction with Work Environment
Factors Dissatisfied
LImportant, this organisation will not help obtain 2.Fairly important, this organisation will not help obtain 3.Important, this organisation will help obtain to some extent 4.Fairly important, this organisation will help obtain to some extent 5.Not important
6.Fairly important, this organisation will help obtain to a great extent 7.Important, this organisation will help obtain to great extent
An employee can now consider each item listed under the index of hygiene and motivation factors and insert a number between 1 and 7 inclusive in the boxes provided on the left-hand side by deciding which scale of satisfaction applies. Therefore if "Interpersonal Relation" is important to the employee and "this organisation will not help to obtain" this, then 1 inserted in the box number 1. On the other hand, if "this organisation will help to a great extent" this, then 7 is inserted in box number 1. After filling all the boxes, the numbers in the boxes are added together. Therefore a number between 13 and 91 can be obtained, 13 for dissatisfied and 91 for very satisfied. Now a "score of satisfaction" can be established.
Score of Satisfaction Code Dissatisfied A B- C D E- F-Very satisfied G-Preparation of Table:
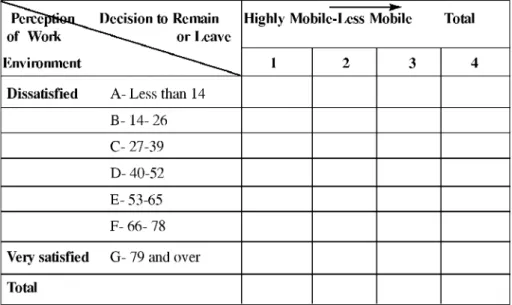
A table can be prepared by the combination of two factors, dependent variable: Decision to Remain or Leave, and Independent variable: Perception of Work Environment.
Decision to Remain or Leave
1- Considers staying for some period but would not stay longer under any condition/ or does not consider staying/ or considers staying for less than one year but would stay longer under certain conditions
2- Considers staying for one to three years but would stay longer under certain conditions
3- Considers staying for three to five years but would stay longer under certain condition
4- Considers staying five years or more.
Boundary Less than 14 14- 26 27-39 40-52 53-65 66- 78 79 and over
Perception of work environment
Range for total score on 13 items: Dissatisfied 13 - 91 Very satisfied. Group data:
Dissatisfied A less than 14; B 14-26; C 27-39; D 40-52; E 53-65; F 66-78; G 79 and over Very satisfied.
Planning the tabulation:
Table n° 1: Decision of employees to remain or leave organisation in relation with their perception of work environment, 1999.
Selecting a problem, defining a subject, problem-posing and predicting a hypothesis, constructing the operational definition of concepts, identifying the indicators for measurements is the answer to "what" we want to study.
4. METHODOLOGY
The methodology is the answer to the question of "how" we want to study. You can have one, two or a combination of several methods. First we must draw up an action plan and make a descriptive outline. For example: one of our methods can be a documentary study. A documentary study is necessary, but not enough. It must be one part of a study and be completed by other methods.
Another method can be fieldwork. In this case in the methodology we explain our method of data collection: It can be by using a questionnaire and/or interviewing some persons. In research design we must prepare the schema of tables (plan of tables ready to put the data after data collection) and be ready to use the computer for statistical treatment (data processing). We can prepare a list of the graphics and clarify the variables that must be shown in each graphic before starting the data collection stage. All these preparations reduce the time after data collection for presentation of the results.
Method of correlation analysis on the statistics of the yearbooks or of the results of census can be one chapter of our study. In our professional life we always need to use statistics.
5. EXPERIMENT ATION
In this part we provide an answer to each key question of research and verify our hypothesis (hypotheses).
If one of our methods is a documentary study, in this case our next stage can have the flowing steps:
- Reading and taking notes, on the top of each page write the name of the author and in parentheses the year of publication and the page number concerning the quotation. Put the quotation mark "..." if we find one idea and we want to write it as appears in the text. If we use our own words, we don’t need the quotation marks but must put a footnote with the page number. The next steps are:
- classifying the quotations in order of our outline in several parts;
- analysing and integrating the quotations and putting them into the content; avoid successive quotations or long quotations;
- make grammatical sense;
- use the present tense;
- make a critical commentary;
- putting it all together and synthesise the findings;
If our method is analysis of statistics we choose the statistics of the annuals and the census. We need to classify, synthesise and put them in the small tables and analyse them in line with our key questions or hypotheses. The existence and the validity of the statistics are in direct relation to the socio-economic level and especially to the level of the instruction of the population of a country. Given this fact, the margin of error is very important in the analysis of statistics
A documentary study (based on the existing work, as well as the statistical annuals and the census) although necessary, can not in any case be sufficient. There is the risk of consolidation of errors if we limit ourselves to a documentary study. That is why, for accomplishing a research work, an analysis of a system or an institution, it is indispensable to master the techniques of inquiry in the field.
If our method is an inquiry by questionnaire and we want to complete it by interviewing, we do the data collection after choosing the persons or institutions (Universe and Samples) for interviewer.
After data collection, statistical treatment or data processing, presentation of the data in the tables of percentage and drawing the graphics, we analyse the data. Each table and graphic must be related to one key question or the hypothesis.
6. DATAANALYSIS PROBLEMS 6.1. percentages and Index:
Sometimes there is a paradox according to the type of statistical method used
( see following Tables).
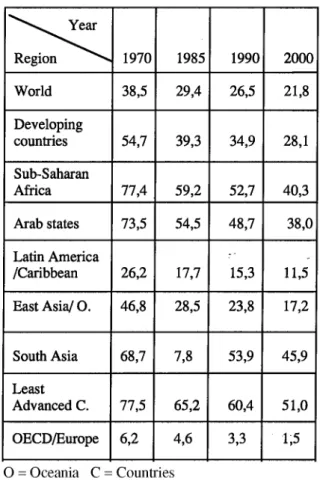
Note that illiteracy increased in numbers (the number of the illiterate people in the world) from 1978 to 1985 ( it was 890,1 million in 1970 and it increased to 949,5 in 1985). It remained, more or less, stable from 1985 to 1990 and decreased only towards the year 2000 slightly (see Table 2). But illiteracy decrease in percentage (the proportion of the illiterate in the total population) from 1978 to 1985 (it was 38,5 % in 1970 and it decrease to 29,4% in 1985. It continued to decrease from 1985 to 1990, and from 1990 to 2000 (see tables 3 and 4). That is a paradox statistic.
How to correct the impression given by percentage?
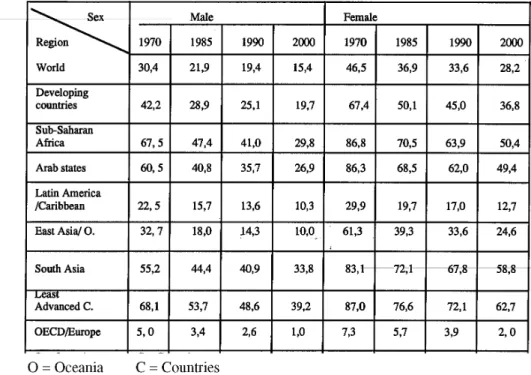
Male and female gap decreased in percentage and increased in index (F/M ).
For example: in the world, from 1970 to the year 2000, the gap between the male and female rates decreased from 16,1 to 12,8.
Way of counting: in 1970 there were 46,5% F - 30,4% M = 16,1%;
In the year 2000 there will be 28,2% F - 15,4% M = 12,8%.
But in 1970 there were 1,5 times more illiterate female than illiterate male.
Way of counting: F 46,5 / 30,4 M = 1,5 in 1970;
F 28,2 / 15,4 M = 1,8 in the year 2000.
In term of index, one can say that there were 100 male illiterates and 150 female illiterates. In the year 2000 there will be 100 male illiterates and 180 female illiterates in the world. This is why, it is also necessary to use the index and not limit ourselves to the use of percentages.
For example, in the UNESCO's survey we studied the gap between female and male illiteracy rates in the world region by region. We also studied the illiteracy gap between the "developed" countries and "developing" countries. The gap in both cases have been increased with respect of time. Such understanding can not be obtained by looking at percentage alone, in fact the percentage figures show a decrease (to see Tables 5, 6 and 7) *.
Table N°2: Total Population and Illiterates aged 15 years and more (In millions) in
the World, 1970-2000.
Adult population of IS years & more Illiterates
1970 1985 1990 2000 1970 1985 1990 2000 World ^ 2311,5 3226,2 3580,7 4293,6 890,1 949,5 948,1 932,4 Developing Countries 1540,7 2307,6 2626,1 3272,7 842,3 907,2 916,6 919,7 of which: Sub Saharan Africa Arab states Latin America/C East - Asia South - Asia Least -Advanced Countries 148.6 67.6 164.0 692,5 440.0 135,2 226,1 107,5 252,1 1036.3 648,4 212.3 263.4 125.4 286,9 1171,3 738,6 245.4 364.4 172.7 362.7 1375, 952,2 _ 333.4 115.0 49,7 43.0 324,1 302,3 104,8 133,9 58.6 44.6 295.3 374,8 138.4 138,8 61,1 146,8 65,6 43 ,V 278,8 398.1 148.2 41,7 236,5 437.1 170.1 Developed 918,6 954,6 1020,9 47,8 42,3 31,5 15,7 Countries 770,8 Classification by continent Africa 200,3 305,2 354,3 485,5 152,6 171,8 177, 186,4 America 326,0 459,4 503,6 598,1 52,8 54,7 50,4 42,5 Asia 1253,9 1846,8 2088,7 2538,3 652,0 694,4 699,7 695,5 Europe, EX-USSR 518,1 597,0 614,6 649,3 31,1 26,9 19,1 9,7 Oceania 13,1 17,8 19,4 22,3 1,5 1,7 1,4 1,2
Table N°3: Rates (percentages) of Illiteracy in order of world regions (1970 - 2000). \ s . Year Region > 1970 1985 1990 2000 World 38,5 29,4 26,5 21,8 Developing countries 54,7 39,3 34,9 28,1 Sub-Saharan Africa 77,4 59,2 52,7 40,3 Arab states 73,5 54,5 48,7 38,0 Latin America /Caribbean 26,2 17,7 15,3 11,5 East Asia/ 0 . 46,8 28,5 23,8 17,2 South Asia 68,7 7,8 53,9 45,9 Least Advanced C. 77,5 65,2 60,4 51,0 OECD/Europe 6,2 4,6 3,3 1,5 O = Oceania C = Countries
Table N°4: Male and Female Rates (percentages) of Illiteracy in order of world re
gions (1970 - 2000).
Sex Male Female
Region World 1970 1985 1990 2000 1970 1985 1990 2000 30,4 21,9 19,4 15,4 46,5 36,9 33,6 28,2 Developing countries 42,2 28,9 25,1 19,7 67,4 50,1 45,0 36,8 Sub-Saharan Africa 67,5 47,4 41,0 29,8 86,8 70,5 63,9 50,4 Arab states 60,5 40,8 35,7 26,9 86,3 68,5 62,0 49,4 Latin America /Caribbean 22,5 15,7 13,6 10,3 29,9 19,7 17,0 12,7 East Asia/ 0. 32,7 18,0 14,3 10,0 61,3 39,3 33,6 24,6 South Asia 55,2 44,4 40,9 33,8 83,1 72,1 67,8 58,8 Least Advanced C. 68,1 53,7 48,6 39,2 87,0 76,6 72,1 62,7 OECD/Europe 5 ,0 3,4 2,6 1,0 7,3 5,7 3,9 2 ,0 O = Oceania C = Countries
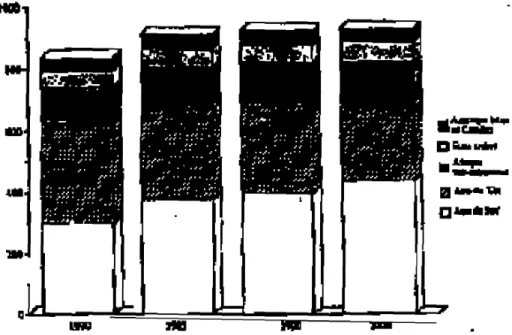
Graphic 1: Illiterate Population aged 15 years and more, in order of developing
regions, 1970-2000 (in millions).
M i
lave iW KB
Source: UNESCO, Division of the adult education, 1988,
Table N°5: EVOLUTION OF THE ILLITERACYINDICATION ACCORDING TO
THE SEX FROM 1970 TO 2000.
N , SEX ^ S Y E A R REGION 1970 MALE Index 2000 % FEMALE Index 1970 2000 % World 100 51 -15 100 61 -18, Developing Countries 100 46 -22,5 100 55 -30,6 Sub-Saharan Africa 100 44 -37,7 100 58 -36,4 Arabs States 100 .44 -33 100 57 -30,9
Latin America & C. 100 46 -12,2 : 100 42 -17,2
East Asia 100 31 -22 100 40 -35
South Asia 100 61 -21,4 100 71 -24,3
Least Advanced C. 100 58 -28,2 100 72 -24,3
Industrialised
Countries 100 20 -4 100 27 -5,3
Source: ZIARATI, Shirdokht, Coopération en matiere de recherche en éducation (Cooperation in the field of research in education), 1999, with collaboration of UNESCO/ Dogus Institute-Oxford Brookes University, Page 73.
Between 1970 and 2000 the reduction of illiteracy rates according to sex shows that men improved their percentage of 15 points and women of 18 points in the world. But if we consider the ratio of the two relative percentages of male illiterates in 1970 and in the year 2000 (the index), we note that 100 male illiterates in 1970 and 51 ones in the year 2000. The ratio of two relative percentages of female illiterates is 100 female illiterates in 1970 and 61 ones in the year 2000.
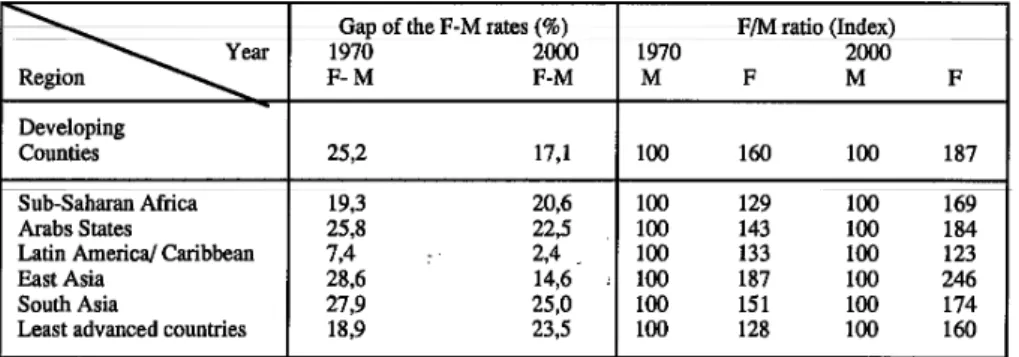
TABLE N° 6: EVOLUTION OF THE GAP BETWEEN ILLITRATE MEN AND
ILLITERATE WOMEN ACCORDING TO THE REGION OF THE YEAR 1970 TO THE YEAR 2000.
Gap of the F-M rates (%) F/M ratio (Index)
^ Year 1970 2000 1970 2000 Region F -M F-M M F M F Developing Counties 25,2 17,1 100 160 100 187 Sub-Saharan Africa 19,3 20,6 100 129 100 169 Arabs States 25,8 22,5 100 143 100 184
Latin America/ Caribbean 7,4 - 2,4 100 133 100 123
East Asia 28,6 14,6 . 100 187 100 246
South Asia 27,9 25,0 100 151 100 174
Least advanced countries 18,9 23,5 100 128 100 160
The illiterate ratio of F/M (index) increases everywhere except in Latin America and Caribbean. The East Asia, Arabs states and the South Asia are three regions where the phenomenon of illiteracy will become more and more female in the year 2000 *.
In conclusion, the gap between male and female are not in relationship with the den sity of the rate of general schooling of a region neither with its level of development. It is rather a cultural phenomenon.
It is necessary to add that the sex is not the only important factor of access to the inst ruction, the region also intervenes. The gap between the two regions of the world (de veloping countries and developed countries) has increased from 1970 to 2000.
TABLE N° 7: EVOLUTION OF THE GAPBETWEEN DEVELOPED COUNTRI
ES AND DEVELOPiNG COUNTRIES FROM 1970 TO THE YEAR 2000.
Region ^ 1970 1985 1990 2000 Developed countries Developing countries 100 100 882 854 100 100 1058 1873
So in 1970, in the term of Index, there were 100 illiterates in the "developed" count ries and 882 illiterates in the "developing" countries; in the year 2000, there are 100 in developed countries and 1873 in developing countries. It means there were 9 ti mes more illiterate persons in developing countries than developed countries in 1970, but in the year 2000 the same ratio is carried to 18 times more. If we compare the de veloped countries and the 47 Least Advanced Countries (L. A. C.), the ratio of illite racy (rate of Least Advanced Countries/ rate of Developed Countries) in 1970 was 12; in the year 2000 is 34. Note that the gap of illiteracy is enormous between the de veloped countries and developing countries (in particular with the L. A. C.) and ac centuates itself strongly from 1970 to the year 2000. Such understanding can not be obtained by looking at the percentage alone. Because, the percentage figures show a decrease of the gap.
REFERENCES:
HERZBERG, F. (1967), A Sociological Approach to Economic development, publis hed in Review of Development, and society, N: Y: St. Matin's Press, Pages
150-163.
TOUBA, J. R.; Nagafbagy, R.; Ziarati, S.; et al, (1974), Problem of Regional Deve lopment, University of Teheran, 178 pages.
ZIARATI, R. (1995), Learning organisation, keynote speech, European Action Prog ramme For Education and Training, Leonardo conference, Birmingham, UK.
ZIARATI, S., (1999), Coopération en matière de recherche en education: Les lexons de l'expérience, Dogus Institute/Oxford Brookes University, with collaborati on of UNESCO, 165 pages.
ZIARATI, S., (1999), Hand book of Information and data analysis course, Dogus University, Istanbul.
ZIARATI, S., (1994), Basic education population and development, serial n° 2 of Education For All. Status and Trends, published by UNESCO, Paris, 48 pa ges.