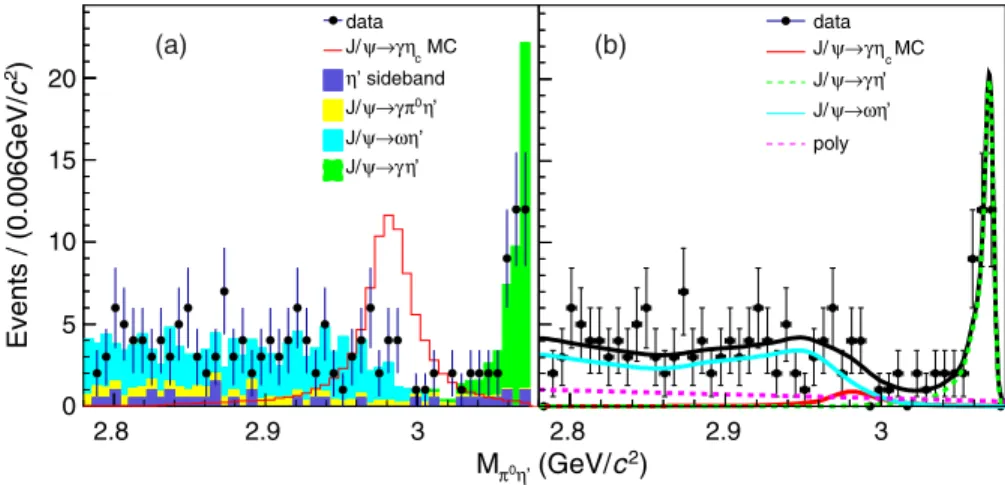
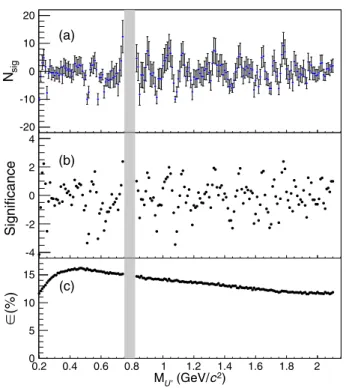
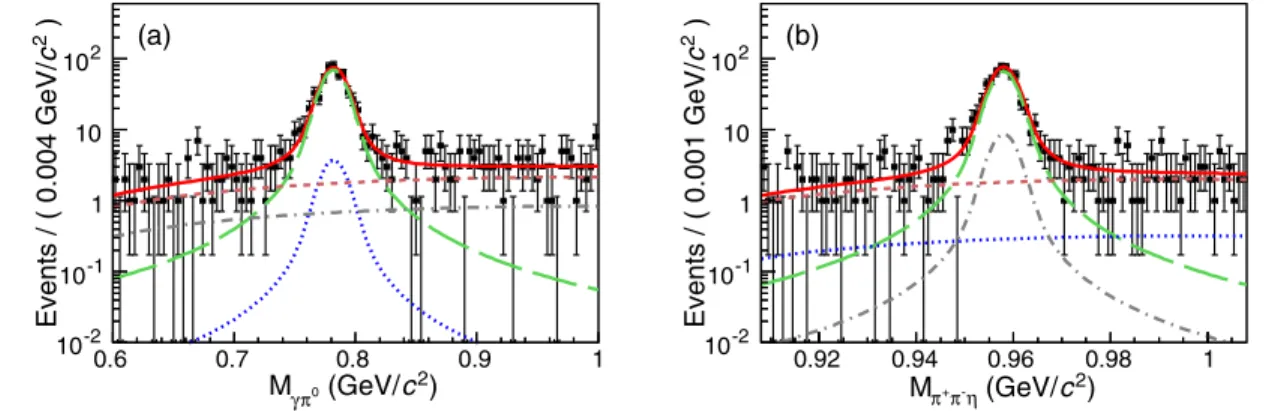
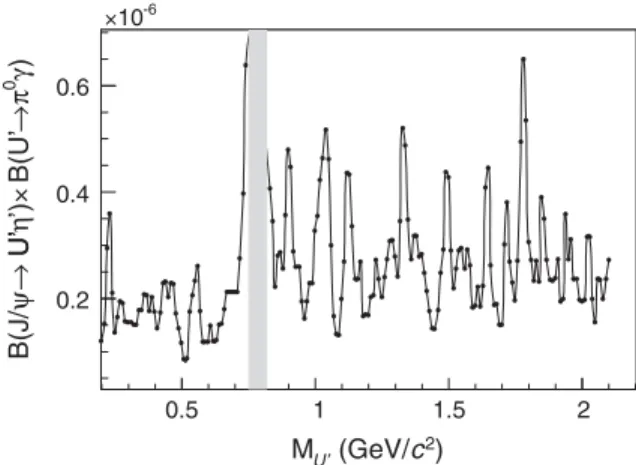
Search for intermediate resonances and dark gauge bosons in J/psi -> gamma pi(0)eta '
Tam metin
Şekil
Benzer Belgeler
1996 yılında dâhil olduğu Gümrük Birliği katılımının ardından, 2005 yılında baĢlayan müzakerelere baĢlama kararı ile hızlanan sürecin Türkiye ekonomisi
Bu çalıĢmada habercilikde yapılan yönlendirme, dezenformasyon ve propaganda Azerbaycan ve Ermenistan devletlerinin Dağlık Karabağ problemi ile ilgili yapılan
Bu çalışmada sezgisel sürü optimizasyon algoritmaları anlatılmış ve bu algoritmalardan yapay balık sürü algoritması ve ateş böceği sürü
ÇalıĢma bulguları ıĢığında ĠSG açısından hastane ortamında sağlık çalıĢanlarını kas ve iskelet sistemi rahatsızlıkları ve tükenmiĢliğin etkilerine
Yürürlüğe giren bu yasa hastanelerde verilen sağlık hizmetleri ile ilgili çok tehlikeli işler sınıfı olarak dâhil edilmiş olup, uygulamaların nasıl
1İstanbul Aydın Üniversitesi, Mühendislik Mimarlık Fakültesi, Gıda Mühendisliği Bölümü, Florya--İSTANBUL İSTANBUL 2İstanbul Aydın Üniversitesi, ABMYO, Gıda
Halka açık şirket sayısı ve piyasa değerinin ülke potansiyelini yansıtır büyüklüğe ulaştığı, ulusal ve ulusla- rarası yatırımcıların en üst seviyede
Bu çalışmada yağ kusması problemini önlemek amacıyla, kakao yağının peynir altı suyu tozu ve maltodekstrin ile püskürtmeli kurutma işlemiyle enkapsülasyonu ve kakao
