NOVEMBER 2016
İZMİR KATİP ÇELEBİ UNIVERSITY GRADUATE SCHOOL OF SCIENCE AND ENGINEERING
AUDIOMETER DEVICE DESIGN WITH INTEGRATION OF DIFFERENT SOURCES
M.Sc. THESIS Yiğit Ömer UZUN
(Y130101017)
Department of Biomedical Technologies
KASIM 2016
İZMİR KATİP ÇELEBİ ÜNİVERSİTESİ FEN BİLİMLERİ ENSTİTÜSÜ
FARKLI KAYNAKLARA ENTEGRE İŞİTME CİHAZI TASARIMI
YÜKSEK LİSANS TEZİ Yiğit Ömer UZUN
(Y130101017)
Biyomedikal Teknolojileri Ana Bilim Dalı
v
Thesis Advisor: Assistant Prof. Dr. Yalçın İŞLER ... İzmir Katip Çelebi University
Jury Members: Assistant Prof. Dr. Savaş ŞAHİN ... Izmir Katip Çelebi University
Assistant Prof. Dr. Nalan ÖZKURT ... Yaşar University
Yiğit Ömer UZUN, a M.Sc. student of IKCU Institute of Biomedical Technologies student ID Y130101017, successfully defended the thesis entitled “AUDIOMETER DEVICE DESIGN WITH INTEGRATION OF DIFFERENT SOURCES”, which he prepared after fulfilling the requirements specified in the associated legislations, before the jury whose signatures are below.
Date of Submission: 16 November 2016 Date of Defense: 09 December 2016
vii
ix
FOREWORD
At the all my university life and in this work Assistant Prof. Dr. Yalçın İŞLER encouraged and inspired me very important ideas. I would like to present my gratitude to him. Within this study and before this period, I am glad to Audiologist Specialist Selhan GÜRKAN for his supports.
I would like to express my gratitude to my family and in particular to my wife, Büşra UZUN.
Scientific Research Projects Coordinatorship of İzmir Katip Çelebi University supported this thesis study. Project No.: 2016-TYL-FEBE-0031.
xi TABLE OF CONTENTS Page FOREWORD ... ix TABLE OF CONTENTS ... xi ABBREVIATIONS ... xiii LIST OF TABLES ... xv
LIST OF FIGURES ... xvii
SUMMARY ... xix
ÖZET ... xxi
1. INTRODUCTION ... 1
1.1 Auditory System ... 1
1.1.1 Anatomy and physiology of the ear ... 2
1.1.1.1 The outer ear ... 2
1.1.1.2 The middle ear... 3
1.1.1.3 The inner ear ... 4
1.1.2 Sound perception ... 5
1.1.3 The common investigations for hearing ... 7
1.2 Audiometry ... 8
1.2.1 Masking in audiometry ... 8
1.2.2 Audiogram ... 10
1.3 Techniques And Procedures ... 11
1.3.1 Pure tone audiometry ... 11
1.3.1.1 Hughson-Westlake technique... 12
1.3.2 Tone decay test (TDT) ... 13
1.3.3 Short increment sensitivity index test(SISI) ... 14
1.3.4 Bekesy audiometry ... 15
1.3.5 Speech audiometry ... 15
1.3.5.1 Speech discrimination test ... 16
1.3.5.2 Speech reception threshold test ... 16
1.4 Audiometer ... 17
1.4.1 Comparison of different audiometers... 18
2. DESIGN AND INSTRUMENTATION ... 21
2.1 Main Control Card ... 22
2.2 Pure Tone Generator ... 23
2.2.1 Communication with DS1868 ... 24
2.3 External Input dB Meter... 25
2.4 Attenuator Circuits ... 26
2.5 Source Switch Circuit ... 29
2.6 Power Supply Board ... 29
2.7 Software ... 30
2.7.1 Flowcharts ... 31
xii
3.1 Graphical User Interface (GUI) ... 37
3.2 Output Signals and Calibration ... 38
3.3 Thesis Outputs ... 41
4. CONCLUSION AND DISCUSSION ... 45
REFERENCES ... 49
xiii
ABBREVIATIONS
SPL : Sound Pressure Level
HL : Hearing Level
ISO : International Standards Organization SISI : Short Increment Sensitivity Index
BERA : Brain-Stem Evoked Response Audiometry HTL : Hearing Threshold Level
TDT : Tone Decay Test
SDS : Speech Discrimination Test SRT : Speech Reception Test SPI : Serial Peripheral Interface GUI : Graphical User Interface AEP : Auditory Evoked Potentials PRS : Pattern Recognition Score
USART : A Universal Synchronous/Asynchronous Receiver/Transmitter UART : A Universal Asynchronous Receiver/Transmitter
CAN : Control Area Network ADC : Analog to Digital Converter DAC : Digital to Analog Converter SRAM : Static Random Access Memory RST : Serial Port Reset Input
CLK : Serial Port Clock Input DQ : Serial Port Data Input CS : Chip-Select Input SDI : Serial Data Input SCLK : Serial Clock Input SDO : Serial Data Output MSB : Most Significant Bit
SMPS : Switch Mode Power Supply PGA : Programmable Gain Amplifier FFT : Fast Fourier Transform
xv
LIST OF TABLES
Page Table 1.1: Threshold values in dB SPL for 0 dB HL (ISO, 1984) [1]. ... 7 Table 1.2: Comparison of different audiometers. ... 19 Table 2.1: Calculation of digital potentiometer. ... 24
xvii
LIST OF FIGURES
Page
Figure 1.1: Cross-section of the human ear [3]. ... 2
Figure 1.2: The middle ear [3]. ... 4
Figure 1.3: The inner ear [3]. ... 4
Figure 1.4: Cross-section of the cochlea [3]. ... 5
Figure 1.5: Fletcher and Munson curves to show the response of a human hearing mechanism by means of frequency and loudness levels. ... 6
Figure 1.6: Audiogram of normal ears and impaired ears [2]. ... 10
Figure 1.7: Hughson-Westlake technique threshold selection [8]. ... 13
Figure 1.8: A general block diagram of audiometer[5]. ... 18
Figure 2.1: General block diagram of device. ... 21
Figure 2.2: STM32F746G-DISCO discovery board. ... 22
Figure 2.3: Pure tone generator circuit. ... 23
Figure 2.4: Output amplitude as a function of DS1868 [11]. ... 24
Figure 2.5: 17 bit I/O shift register [11]. ... 25
Figure 2.6: dB meter circuit. ... 25
Figure 2.7: Functional block diagram of PGA2311 [13]. ... 27
Figure 2.8: Attenuator circuits. ... 28
Figure 2.9: Serial interface protocol [13]. ... 29
Figure 2.10: The transmission of pure tone audio signal to the right channel. ... 29
Figure 2.11: Power supply circuit [14]. ... 30
Figure 2.12: ARM mbed [15]. ... 31
xviii
Figure 2.14: Mod 1 software flowchart. ... 32
Figure 2.15: Mod 2 software flowchart. ... 33
Figure 2.16: Mod 3 software flowchart. ... 35
Figure 3.1: First page screen. ... 37
Figure 3.2: Manual test screen. ... 37
Figure 3.3: Automatic test screen. ... 38
Figure 3.4: Audio control screen. ... 38
Figure 3.5: Comparison of 1000 Hz pure tone. ... 39
Figure 3.6: Comparison of white noise. ... 39
Figure 3.7: Comparison of pink noise. ... 39
Figure 3.8: 500 Hz pure tone FFT. ... 40
Figure 3.9: 1000 Hz pure tone FFT. ... 40
Figure 3.10: 8000 Hz pure tone FFT. ... 41
Figure 3.11: Sound card and HEARLAB. ... 41
Figure 3.12: Test environment [16]. ... 42
Figure 3.13: Designed audiometer prototype (Front view). ... 43
xix
AUDIOMETER DEVICE DESIGN WITH INTEGRATION OF DIFFERENT SOURCES
SUMMARY
Audiometry is the technique to identify the nature of hearing loss and to determine the threshold of hearing by recording responses of the patient after presenting him with auditory stimuli with varying intensity levels. There are different audiometric techniques and procedures used for achieving this.
The vast majority of medical devices found in the marketplace as a commercial product for the field of audiology have been developed for clinical limited testing. These devices cannot be used for purposes other than those specified by the manufacturer. This has serious limitations in the experimental design of scientific research carried out in limited budget training research hospitals, and it reduces the quality of the research that is revealed. With the circuit designs that can be integrated externally to the devices used in the audiology clinics, the capabilities of these devices can be increased and the usage capacity can be increased in line with the requirements of the clinician or researcher.
In this study, an audiometer is designed and prototyped to generate pure tone, control both audio channels separately, control audio sources connected from external input. The pure tone produced or the audio signal from the external source is routed through switches and transmitted to the patient through the attenuator circuit. Device control is performed by STM32F746 development kit.
The device has three different modes as manual test automatic, pure tone threshold test and volume control. In manual mode, the operator can send pure tone signals to the patient's ear at a frequency of 250 Hz - 8000 Hz and a range of 0-110 dB with 1 dB sensitivity. According to the responses taken from the patient response button, an audiogram is created simultaneously on the device screen. In addition, masking white noise and pink noise with sound-loaded on the memory card can be used. The Hughson Westlake method was used as the automatic test method. After the test is started, hearing threshold values are recorded according to the test procedure. An audiogram is created simultaneously on the screen during the test. In the audio control mode, the audio signals from the external source can be independently controlled 1 dB in two channels.
This audiometer helps contribute to academic studies. Moreover, this has been used in graduate-degree theses in Audiometer branch of Otology in the Faculty of Medicine in Dokuz Eylul University. Developed audiometer is also almost ready to manufacture as a commercial device after some procedures for international test and calibration.
Research Fund of the İzmir Katip Celebi University supported this work. Project Number: 2016-TYL-FEBE-0031.
xxi
FARKLI KAYNAKLARA ENTEGRE İŞİTME CİHAZI TASARIMI ÖZET
Odyometri işitme kaybını tanımlamak ve hastaya değişen şiddetlerde işitsel uyaranlar sunduktan sonra hasta tepkisini kaydetmek suretiyle işitme eşiğini belirlemek için kullanılan bir yöntemdir. Bunun için kullanılan farklı teknikler ve prosedürler vardır. Odyoloji alanına yönelik ticari bir ürün olarak piyasada bulanan tıbbi cihazların büyük çoğunluğu klinik amaçlı olarak sınırlı testleri uygulamaya yönelik geliştirilmiş olup bu cihazların üretici tarafından belirlenen amaçlar dışında kullanma olanağı sunulmamaktadır. Bu durum özellikle sınırlı bütçelerle eğitim araştırma hastanelerinde yürütülen bilimsel araştırmaların deneysel tasarımlarında ciddi sınırlılıklar getirmekte ve ortaya çıkartılan araştırmanın niteliğini düşürmektedir. Odyoloji kliniklerinde kullanılan cihazlara harici olarak eklenebilecek devre tasarımlarıyla bu cihazların yetenekleri artırılabilir, klinisyen ya da araştırmacının gereksinimleri doğrultusunda kullanım kapasitesi arttırılabilir.
Bu çalışmada saf ton ses üretebilen, her iki kanalı bağımsız olarak kontrol edebilen, hafıza kartında bulunan pembe ve beyaz gürültü seslerini maskeleme olarak kullanabilen, farklı kaynaklara entegre olarak ses kontrolü yapabilen bir odyometre cihazı tasarlanmış ve prototibi gerçekleştirilmiştir. Saf ses fonksiyon jeneratörü ile üretilmektedir. Üretilen saf ses veya dış kaynaktan gelen ses sinyali anahtarlar ile yönlendirilerek zayıflatıcı devreden geçerek hastaya iletilir. Cihaz kontrolü STM32F746 geliştirme kiti ile yapılmıştır.
Cihaz manuel test otomatik, saf ses eşik testi ve ses kontrolü olmak üzere 3 farklı moda sahiptir. Manuel modda operatör hasta kulağına 250 Hz - 8000 Hz frekans aralığında, 0-110dB şiddetinde saf ses sinyallerini 1 dB hassasiyetle gönderebilmektedir. Hasta cevap butonundan alınan tepkilere göre cihaz ekranında eş zamanlı olarak odyogram grafiği oluşturulmaktadır. Ayrıca, maskeleme sesi olarak hafıza kartına yüklenmiş olan beyaz ve pembe gürültü sesleri kullanılabilmektedir. Otomatik test yöntemi olarak Hughson Westlake metodu kullanılmıştır. Test başlatıldıktan sonra test prosedürüne göre işitme eşik değerleri kaydedilir. Test sırasında eş zamanlı olarak ekranda odyogram oluşturulur. Ses kontrol modunda ise dış kaynaktan gelen ses sinyalleri iki kanalda bağımsız olarak 1 dB kontrol edilebilmektedir.
Tasarlanan cihaz akademik çalışmalara katkı sağlayacak düzeydedir. Dahası Dokuz Eylül Üniversitesi, Tıp Fakültesi, Kulak Burun Boğaz Ana Bilim Dalı, Odyometri Yüksek Lisans ve Doktora programlarındaki tezlerde kullanılmıştır. Geliştirilen odyometre cihazı aynı zamanda uluslararası test ve kalibrasyon işlemleri yapıldıktan sonra ticari olarak üretilebilir düzeydedir.
xxii
Bu çalışma İzmir Katip Çelebi Üniversitesi Bilimsel Araştırma Projeleri Koordinasyon Birimince Desteklenmiştir. Proje Numarası: 2016-TYL-FEBE-0031
1
1. INTRODUCTION 1.1 Auditory System
The human hearing system comprises of two sections: (i) a peripheral section, which is an ear, and (ii) a central section located in the brain, which carries the sensation from the ears to the auditory area of the cerebral cortex. The auditory area of the cerebral cortex (called auditory cortex) is the area of the brain, which consecrated to interpreting the sound that comes to ears. The ear receives the sound in the form of sound energy, which is a form of air vibration. This vibrating energy comes into the external part of the ear (called external auditory meatus) and vibrates the eardrum (technically known as tympanic membrane). A chain of small bones called malleus, incus and stapes, which conduct this vibration to a specialised organ called cochlea, picks up this quivering of the tympanic membrane [1]. The cochlea is the transducer of the hearing system. The function of the cochlea is to convent the vibratory energy into electrical energy. Once this has been achieved, this electrical energy enters the nerve of hearing (called auditory nerve) and carries the sensation through different parts of the brain to the auditory cortex, where the sensation of sound is analysed and interpreted. For proper hearing, each part of this system right from the external auditory meatus to the auditory cortex has to be normal. A disorder in any of them may cause the loss of hearing.
The ear has three sections: the external auditory meatus, the middle ear and the inner ear (Figure 1.1). Each section plays significant and unique roles in decomposing and converting acoustical waves into electrochemical impulse signals to prepare signals to use by the brain.
The external ear is the area from the pinna (technically called auricle) to the eardrum. The middle ear is from the eardrum to the cochlea, it consists of the three small bones called ossicles, which are placed in a closed space (called tympanum) filled with air. The inner ear is the portion of the ear deeper to this, it houses the transducer (called cochlea), and the organ of balance (called vestibular labyrinth).
2
Figure 1.1: Cross-section of the human ear [3].
When sound reaches the inner ear through the eardrum, this phenomenon is called air conduction. This is the usual path of sounds to reach the eardrum. Sound, particularly in the low frequency range, may reach the inner ear via the bones in the head rather than from the eardrum, this phenomenon is called bone conduction [2]. The normal process via the ear canal is called air conduction. Wearing earplugs results in a greater percentage of the sound heard coming from bone conduction. Normally only a small fraction of sound is received in this way; however, deaf people whose inner ear still functions normally may be able to hear sound conducted to the ear in this way, for instance by holding between the teeth a wooden rod connected to a vibrating object.
1.1.1 Anatomy and physiology of the ear
The ear has three main sections as shown in Figure 1.1: • Outer Ear,
• Middle Ear and • Inner Ear. 1.1.1.1 The outer ear
The main duty of the outer ear is to guide and concentrate acoustic vibrations to the eardrum. The divisions of the outer ears are:
3
Pinna
This is the external flap of cartilage surrounding the entrance to the ear. The shape of the pinna causes a resonance effect that will alter the amplitude of the pressure wave at different frequencies. Since this spectrum shaping changes based on the sounds origin, the pinna also helps with sound localization.
Auditory canal
The auditory canal is a complex cavity roughly 3-cm long. It acts as a resonator that further shapes the spectrum. Specifically, this resonator amplifies the spectrum between 2 kHz and 5 kHz. This is an important range for speech recognition. The combination of the auditory canal and the pinna together is also called as the meatus. Tympanic membrane (eardrum)
It is located at the end of auditory canal. The function of the tympanic membrane is to collect air vibrations and to convert them into mechanical movements in the middle ear. It is an incredible sensitive instrument and it operates the range of more than 100 dB. In other words, the eardrum can detect more than 10,000,000,000 times the minimum sound level (SPL, sound pressure level).
1.1.1.2 The middle ear
The middle ear is a 2-cm space between the tympanic membrane and the cochlea. It consists of three bones (the malleus, incus, and stapes) surrounded by air, which is shown in Figure 1.2. These bones, are also known as the ossicles, are among the smallest bones in the human body. The function of .the middle ear is to correct the impedance mismatch between the air in the outer ear and the fluid in the inner ear by collecting energy in the comparatively large tympanic membrane and focusing it on the relatively small oval window that sits at the base of the stapes. Similar to every medium, the middle ear will also more or less change the spectrum.
4
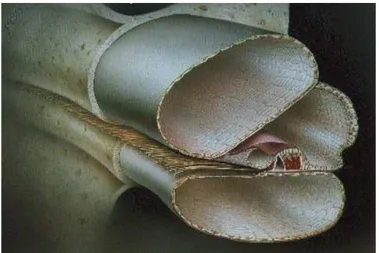
Figure 1.2: The middle ear [3]. 1.1.1.3 The inner ear
The most important portion of the inner ear is the cochlea, shown in Figure 1.3. It is an approximately 35 mm long coiled tube. This tube is full of a lymphatic fluid and is divided lengthwise by the basilar membrane and organ of corti. The stapes connects to the cochlea at its base through the oval window. Vibrations from the stapes travel through the lymphatic fluid to the apex of the cochlea and then back down the other side of the partition to the round window. This induces movement of the partition. The manner in which the partition moves plays an important part in how the sound is encoded into neural impulses.
5
Figure 1.4 shows a cross-section of the cochlea. Along the left side there are a series of nerves that are fed into the middle of the cochlea. This area is known as the organ of corti and is where transduction (conversion of physical movement to neural impulses) occurs. It sits at top the basilar membrane and below the tectorial membrane. As the basilar membrane moves up and down the tectorial membrane sheers across the organ of corti. This causes the cilia that sit above the hair cells to bend. This results in the firing of the nerves attached to the hair cells. It is important to note that at different points along the cochlea the organ of corti may be registering different levels of vibration. All told, there are about 30,000 sensory hair cells measuring the exact movement of the cochlea.
Figure 1.4: Cross-section of the cochlea [3]. 1.1.2 Sound perception
Sound is generated in nature whenever an object vibrates in an elastic medium like air. Sounds in nature are complex and not pure tone or sine waves [4]. However, all complex sounds can be considered as a mixture of different pure tone sounds of different frequencies.
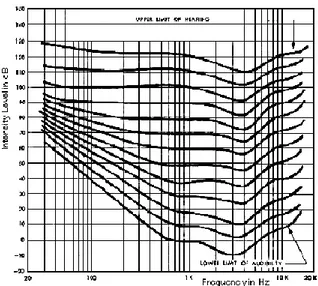
The ear is not equally sensitive to all frequencies, particularly in the low and high frequency ranges. The frequency response over the entire audio range has been charted, originally by Fletcher and Munson in 1933, with later revisions by other authors, as a set of curves showing the sound pressure levels of pure tones that are perceived as being equally loud [1]. The curves are plotted for each 10 dB rise in level with the reference tone being at 1 kHz, also called loudness level contours and the Fletcher-Munson curves (Figure 1.5). The lowest curve represents the threshold of hearing, the highest the threshold of pain.
6
Figure 1.5: Fletcher and Munson curves to show the response of a human hearing mechanism by means of frequency and loudness levels.
The curves are lowest in the range from 1 to 5 kHz, with a dip at 4 kHz, indicating that the ear is most sensitive to frequencies in this range. The intensity level of higher or lower tones must be raised substantially in order to create the same impression of loudness. The phon scale was devised to express this subjective impression of loudness, since the decibel scale alone refers to actual sound pressure or sound intensity levels.
Although human hearing ranges from 20 Hz to 20 kHz, there is little speech information above 8000 Hz, and perception of frequencies below 100 Hz is increasingly tactile in nature, making them difficult to assess. In addition, the loss of hearing sensitivity is observed first at high frequency (8 kHz) and later on as the loss progresses, its effect is observed in the mid-frequency region (1-2 kHz) as well. By the time the loss is observed in the low frequency region, the subject will be near to deafness. Hence, audiometric tests carried out in the low frequency region do not give any significant information about hearing loss. Therefore, audiologists routinely test only in the range of 250-8000 Hz, often in octave steps. Standardized frequencies tested include 250, 500, 1000, 1500, 2000, 3000, 4000, 6000, and 8000 Hz. This represents octave intervals, by convention, but intervening frequencies may also be tested [1].
7
The sound level of acoustic measurements given in dB, is calculated by assuming the sound pressure of 20 microPa as the reference level, is known as sound pressure level (SPL).
Sound level dB SPL = 20 log (measured sound pressure / 20 microPa) (1.1) However, the sound level of pure tones is calculated by taking average hearing threshold in dB of normal hearing young adults as the reference, and is known as hearing level (HL) in audiometry [5].
Sound level dB HL = 20 log (measured sound average threshold of normal hearing) (1.2) The hearing threshold is frequency dependent, and hence SPL corresponding to a given HL varies with frequency. Intensity levels in audiometers are indicated in HL. Table 1.1 gives the dB SPL (dB HL) threshold values of a normal person for standard frequencies. The "0 dB" hearing level in audiometry is a modal value derived from a large population of normals. Normal values for auditory thresholds were defined by the International Standards Organization (ISO) in 1984. These values are derived from large population studies of normal adults 18-30 years of age.
Table 1.1: Threshold values in dB SPL for 0 dB HL (ISO, 1984) [1].
Frequency (Hz) 250 500 1k 1.5k 2k 3k 4k 6k 8k
dB SPL 25.5 11.5 7 6.5 9 10 9 10.5 13
Since both HL and SPL are logarithmic units, a certain increment in HL corresponds to the same value increment in SPL [4].
1.1.3 The common investigations for hearing
Different audiological investigations help us to diagnose the nature of deafness and localise the site of disorder. The commonest investigation for deafness is pure tone audiometry. It measures hearing acuity (i.e. how perfectly the subject can hear) and tells us whether is deafness is conductive (disorder in external auditory meatus and / or middle ear) or sensorineural (disorder in the inner ear or in the nerve of hearing in the brain) or whether the deafness is mixed, i.e. a disorder combining both the conductive apparatus as well as the inner ear / nerve of hearing.
8
Tympanometry is also a common audiological investigation. It assesses the structural integrity of the middle ear. It helps us to diagnose the nature of the disorder in the middle ear in cases of conductive or mixed deafness. It can tell us whether there is any stiffness of the ossicular chain, whether the ossicular chain is broken, or whether there is collection of fluid in the middle or the eardrum had become immobile due to adhesions in the middle ear.
If audiometry test has diagnosed the deafness to be sensorineural in type, there are some specialised test like- short increment sensitivity index (SISI), tone decay, speech audiometry and acoustic reflex tests which can tell us whether the disorder is in the cochlea or in the nerve of hearing [2]. The brain-stem evoked response audiometry (BERA) is used for sensorineural deafness and is usually done to objectively assess the site of lesion in retrocochlear type of sensorineural deafness (i.e. if a lesion is expected in the auditory nerve or in the neural pathways, which carry the sensation through the brain). It is also used to objectively assess the hearing acuity of children who cannot respond properly.
1.2 Audiometry
Audiometry is the technique to identify the nature of hearing loss and to determine the threshold of hearing by recording responses of the patient after presenting him with auditory stimuli with varying intensity levels. There are different audiometric techniques and procedures used for achieving this. For air conduction testing, stimuli are presented to each ear independently with specialized earphones. For bone conduction testing, a bone vibrator is placed onto the mastoid process of either right or left temporal bone; external auditory canals are not usually occluded [6]. All equipment must be continually calibrated to conform with international standards. This ensures that a gradual loss of hearing noted on serial testing is truly valid and not due to machine error. Audiometry is performed in an isolated sound-dampened environment. As with other psychoacoustic testing, all audiometric equipment is discretely arranged so that visual (nonacoustic) cues are minimized [6].
1.2.1 Masking in audiometry
In audiometry, both ears are tested separately. In air and bone conduction audiometry where sound is applied to one ear, the contra lateral cochlea is also stimulated by
9
transmission through the bone of the skull. In case the sound in one ear is sufficient to stimulate the second ear, it is called cross hearing.
During the air conduction test, the stimuli while passing from test ear to cochlea of the non-test ear gets attenuated. This loss of sound energy is called interaural attenuation and varies between 45 to 80 dB [4]. However, during bone conduction test, the cochleae of both sides are equally stimulated i.e. the inter-aural attenuation is of 0 dB. Hence, cross hearing is a serious concern in case of bone conduction test than it is for air conduction. A bone vibrator is placed over the mastoid process of the appropriate ear and pure tones are transmitted. Factors such as vibrator placement and pressure may influence results. Fewer frequencies are tested: 250, 500, 1000, 2000, 3000, and 4000 Hz. In addition, audiometer output is limited to approximately 80 dB due to distortion and other technical factors. Interrupted signals in an ascending series are again preferred. Whenever cross hearing is suspected, it is necessary to remove the non-test ear from procedure.
A simple procedure by which this can be done is to deliver a noise to the non-test ear in order to remove it from the test procedure by masking. Here masking noise is loud enough to prevent the tone reaching and stimulating the non-test ear, but at the same time, it should not mask the sensitivity of the test ear over-masking [4]. Thus, an audiologist should provide appropriate level of masking. The masking noise is often selected to be a wide-band noise, or narrow band noise with the band centered about the test frequency. Wide-band noise has uniform power density spectrum over all the audible frequency range i.e. from 250 Hz to 8 kHz. However, the masking effect is actually contributed by frequency components centered on the test tone frequency, over a bandwidth of about 1/3 to 1/2 octave, known as critical band. Broadband noise band-pass filtered with a band approximately corresponding to the critical band is known as narrow band noise, and compared to wide band noise it gives the same masking effect at a lower sound pressure level.
10
1.2.2 Audiogram
An audiogram is a plot of threshold intensity versus frequency. The intensity scale in HL increases downwards, and hence the audiogram resembles like an attenuation response, a lower point on the audiogram indicating higher loss. A typical audiogram (dB HL vs. frequency graph) comparing normal and impaired hearing is shown in Figure 1.6. The dip or notch at 4 kHz as shown, or at 6 kHz, is a symptom of noise-induced hearing loss.
Figure 1.6: Audiogram of normal ears and impaired ears [2].
Most thresholds are approximately 0 dB HL for a normal ear. Points below 0 dB HL on the scale denote louder threshold levels, whereas those above, expressed in negative decibels with respect to the zero level, are less intense levels, because of individual hearing differences, some people may normally hear. Thresholds for the left ear typically appear in blue and for the right ear, in red. The symbols used on most audiograms are
x - left air conduction o - right air conduction
□ - left air conduction with masking ∆ - right air conduction with masking
11
1.3 Techniques And Procedures
There are two types of audiometric techniques, subjective type and objective type. In subjective test, the patient has to respond when he hears the presented sound. Subjective type audiometric test involves presentation of systematically varying acoustic stimuli to the subject and recording the responses.
Objective test only requires co-operation from the patient towards attachment of the measuring electrodes or probes.
There are different audiometeric procedures depending on the stimuli used. 1.3.1 Pure tone audiometry
Pure tone audiometry is a procedure for determination of the extent of hearing loss and the cause, i.e. conduction or sensorineural loss. The subject is hearing threshold for acoustic stimuli of different frequencies are measured. The initial level of the stimuli is selected by the audiologist.
In this technique, at the outset, patient is instructed to signal the audiologist each time a tone is perceived. A variety of response signals may be employed - responding "yes" with each tone, tapping the rhythm of tones, or pointing to the ear where the tone is heard, or better by a response switch. For air conduction thresholds, earphones are comfortably positioned and the better ear tested first, if known. If not known, some audiologists will quickly screen each ear using the same initial frequency and the better ear tentatively determined. Tones are often presented in an ascending series, that is, from low to high frequency [6]. Initially a single frequency stimulus at some presumed level is presented to the patient. Initially a pure tone of 30 dB HL is presented to the subject. If the response is positive, the tone level is decreased in steps of 10 dB until the patient does not give response. On the other hand, after applying 30 dB tone at first time, if the patient does not hear it, the level is raised in steps of 10 dB step until it is heard for first time. Once, the response is positive, the tone is decreased by 10 dB. If the patient hears this tone, the tone is again decreased by 5 dB. If the patient does not hear it, the tone is again raised by 5 dB. In this way by several presentations, the hearing threshold is obtained. Often, tone intensities slightly above and below this auditory threshold are tested to verify and help "hone in" on the precise threshold value. The minimum presentation level at
12
which the subject responds at least 50% times (3 responses out of 6 tone presentations), is taken as the hearing threshold.
1.3.1.1 Hughson-Westlake technique
The basic audiometric assessment method is called the Hughson-Westlake technique. When you are performing audiometric assessment, you can use whether an ascending technique or a descending technique or a combination. The words ascending and descending mean going up and going down. When applied to audiometry, they relate to the clinician increasing the level of the sound or decreasing the level of the sound to determine the client’s hearing threshold. The Hughson-Westlake technique is the most common testing technique used. It is more common form known as the modified Hughson-westlake technique in which the original method has been changed slightly. It is an ascending method and is sometimes referred to as the ‘up 5dB -down 10dB’ procedure.
The first presentation is reasonably loud e.g. 60dBHTL. If the client responds, the intensity is reduced by 10dB until there is no response. It is then increased by 5dB until there is a response. The intensity is again reduced by 10dB until there is no response and then increased by 5dB until there is a response. If the initial sound is not responded to, increase the level of intensity by 5dB until the client responds. Sometimes starting at 60dBHTL is too loud. If the client were likely to have normal or near normal hearing, it would be better to start at 30dBHTL. Occasionally it is best to start at 0dB and increase from there.
The threshold is determined when there are 2 out of 3 responses.(Figure 1.7) Only the responses on the ascending series are taken into account, which is why it is called an ascending technique [7].
13
Figure 1.7: Hughson-Westlake technique threshold selection [8]. For example,
There was no response at 0 dB HL after initial descent. 5 dB HL – no response
10 dB HL – response 0 dB HL – no response
5 dB HL – response (there has now been a response in 1 of 2 presentations) -5 dB HL – no response
0 dB HL– response (At the level 0 dB HL, there were 0 / 3 responses. This not threshold.)
5 dB HL – response (There have been 2 / 3 responses, this is threshold).
The results of the audiometry are reported in an audiogram. Different shapes of audiograms are associated with different types of hearing loss [4]. When prescribing hearing aids the audiogram will guide the degree of amplification required at various frequencies.
1.3.2 Tone decay test (TDT)
Of all the auditory tests designed for detection of the site of pathology in the sensorineural pathway, the tone decay test is the most commonly used [1]. This is because the test can be reliably carried out on any pure tone audiometer. It has been statistically shown that a pathology in the auditory nerve causes an abnormally rapid deterioration in the threshold of hearing of a tone if presented continuously to the ear.
14
In this test, we try to quantify the deterioration in the auditory nerve. This test can be carried out with or without detecting the hearing threshold of the subject.
The operator selects the frequency. The subject is instructed to press the response switch as soon as he hears the tone and he will once again press the switch if he doesn’t hear the tone. The duration between these two responses is measured. The tone is presented and the level is incremented, starting form 30 dB HL, until the subject responds. If the subject is able to hear the tone for more than one-minute [4], the tone level is decremented in steps of 5 dB, and the same procedure is repeated until the tone is audible for less than a minute. If the subject is not able to hear the tone continuously for more than one minute, the intensity is incremented by 5 dB and again tested for the same. The tone is either incremented or decremented without switching off the tone. The lowest intensity for which patient is able to hear the tone for about 1 min. is considered as threshold at that frequency for tone decay test. Similarly, the testing is done for other frequencies and the relation between threshold and frequency is obtained. Tone decay test is used to diagnose the sensorineural deafness [4].
Tone decay is usually classified as normal if decay is 0 to 5 dB, as mild if 10 to 15 dB, as moderate if 20 to 25 dB, and as severe if 30 dB or above. Severe decay is considered to be suggestive of a retrocochlear lesion and warrants further investigation. If tone decay in excess of 30 dB exists the patient should be subjected to thorough and detailed neuro-otological examination.
1.3.3 Short increment sensitivity index test(SISI)
The SISI test is used to detect the pathology in cochlear or retrocochlear lesions [4]. This test is normally carried out after finding the pure tone hearing threshold using normal pure tone audiometry This test determines the capacity of a patient to detect a brief 1 dB increment in intensity, provided at 5 seconds interval at a particular frequency.
In SISI test, the operator will select the test frequency and set the level to 20 dB supra-threshold level. The tone is presented with brief bursts of 1 dB modulation above the carrier tone at every 5 s. The 1 dB increment is presented for an interval of 300 ms, out of which the rise time and fall time are 50 ms each. The patient is asked to press the response button whenever he detects a change in the level [4]. Twenty
15
such bursts are given and out of them, the number of bursts the patient is able to detect is recorded. The no. of responses is converted to percentage and stored as the test results. The same procedure is repeated for each frequency, and the result is stored. A SISI audiogram is plotted on the basis of percent score for each of the test frequencies.
1.3.4 Bekesy audiometry
This is another form of pure tone audiometry, its specialty being that, a self-recording audiometer is used in which the changes in intensity as well as frequency are done automatically by means of a motor [4]. The change in frequency can occur in forward or in backward manner. Conventionally, a forward change is used. The motor drive attenuator is controlled by a switch, which is operated by the patient. The patient presses the switch as soon as he hears a sound and releases it as soon as he stops hearing the sound. The audiometer is so programmed that a tracing is recorded only when the patient presses the switch, the frequency being continually changed either in the forward or backward manner. A graphical representation of the patients hearing threshold across the entire frequency range is thus obtained by the successive crossing and recrossing of the hearing threshold in the form of a jugged line. Two tracings are recorded for each ear, one by presenting a continuous tone and other by presenting a pulsed tone [4].
In type I, the tracings for the continuous and pulsed tones are superimposed upon each other, found in normal ears and ears with conductive deafness. In type II, the tracings for the continuous and pulsed tones are superimposed up to 1k Hz, but above 1k Hz, the tracing for continuous tone falls below that of the pulsed tone. In type III, the tracing for continuous tone falls considerably below that of the pulsed tone right from the start. In type IV, the tracing for continuous tone falls below that of pulsed tone right from low frequencies but not as much as type III. In type V, the continuous tone is above the pulsed tone [4].
1.3.5 Speech audiometry
While pure tone threshold testing attempts to assess sensitivity, speech audiometry testing attempts to address the integrity of the entire auditory system by assessing the ability to here clearly and to understand speech communication. The main use of speech audiometry is in the identification of neural types of hearing loss, in which
16
both the reception as well as the discrimination of speech is impaired more markedly than in cochlear or conductive hearing loss. There are two types of speech audiometric tests, speech discrimination test and speech-reception threshold test. 1.3.5.1 Speech discrimination test
In this test, lists of monosyllable-speech discrimination words are presented over earphones for each ear which patient is asked to repeat. The percentage of the total number of words presented that the patient is able to identify correctly gives the speech discrimination score (SDS). The SDS is determined when the patient repeats 50% of the words correctly. The result of this test is from 0 to 100%. Generally, a high score is associated with normal hearing or conductive hearing loss and low score is associated with sensorineural loss.
1.3.5.2 Speech reception threshold test
This test is almost similar to the speech discrimination test. This test uses two syllable words with equal stress (spondees) and these words are attenuated successively. The SRT (speech reception threshold) is supposed to the lowest hearing level in dB HL where the subject correctly identifies 50% of spondee words among lists applied to the subject. To estimate SRT, a group of six spondee words is presented at 25 dB above the average pure tone audiometry threshold for 500 Hz and 1000 Hz, and then at successively lower intensities. When the level is such that the subject is able to identify three words out of six correctly, the level is taken as SRT. The SRT of a normal subject is very closely related to his pure tone-hearing threshold and the SRT is generally 2 dB lower than average of pure tone hearing level thresholds at 500 Hz and 1 kHz. A list of 36 such words in English language are prepared by the Central Institute for the Deaf.
A way of differentiating between neural and other types of hearing loss is by graphically plotting the performance intensity function. This is done by ascertaining the speech discrimination score at different sensation levels and plotting the percentage of correctly identified words as a function of the intensity of presentation of the words.
17
1.4 Audiometer
An audiometer is a medical device that is used for carrying out these hearing tests and procedures. Audiometer can designed in different types depending upon the different criteria: frequency range, range of acoustic output, mode of acoustic presentation, masking facility, procedures used, and types of acoustic stimuli. It should be capable of generating pure tones at a specific frequency, specific intensity, and duration, either singly or in series.
A conventional audiometer must handle the frequency selection with calibrated scale and tone masking with noise level selection. After carefully observing the responses of the subject, the audiologist changes the level of the stimulus manually. This comes with some limitations and drawbacks. For example, the interrupter switch is used for tone switching mechanically. The presence of some mechanical parts makes the instrument more susceptible to dust and humidity. Moreover, the calibration is necessary once in six months at least.
The enhancement in technology has helped producing the various switches as simple, flexible, and noise free. Furthermore, the hearing test procedure becomes automated. The application of microprocessor (or even PC) in audiology offers many advantages in terms of flexibility and simplicity over their conventional counterparts. In addition, increased accuracy and precision removes the need for frequent calibration of audiometer, which was required for earlier audiometers.
A generalized block diagram of an audiometer is given in Figure 1.8. It consists of two audio source channels, which are tone generator (or oscillator) and noise generator. Each channel has an equalization circuit, an attenuator circuit, and a power amplifier. The tone generator should produce pure-tone sinusoid signal having a frequency range from 250 Hz to 8 kHz. The frequency of the generator can vary by an external frequency control input. The generated signal must be almost stable. The signal is allowed to fluctuate within ±3 percentage of the indicated frequency. The generated signal reaches the equalization circuit first to provide frequency dependent attenuation. This is required to calibrate the output sound levels in dB HL and to provide different amount of attenuation for different output devices like headphone, loudspeaker, and vibrator. The attenuator, known as the hearing or tone level control, should be capable of controlling the output sound level over a desired range in steps of 5 dB. Calibration should ensure the output sound level to be within + 3 dB of the
18
indicated value. For the masking purpose, the noise generator should provide wide-band noise, which has energy spectrum equally distributed over the test frequency range i.e. up to 8 kHz. There should also be a facility for narrow band noise, wherein the narrow band noise output should be distributed around the test frequency. The output power available from the power amplifier determines the maximum sound pressure level available from the headphones and the bone vibrator. The amplifier must have low distortion and a good S/N ratio to meet the standard requirements. A response switch is given to the patient, to indicate his response.
Figure 1.8: A general block diagram of audiometer[5]. 1.4.1 Comparison of different audiometers
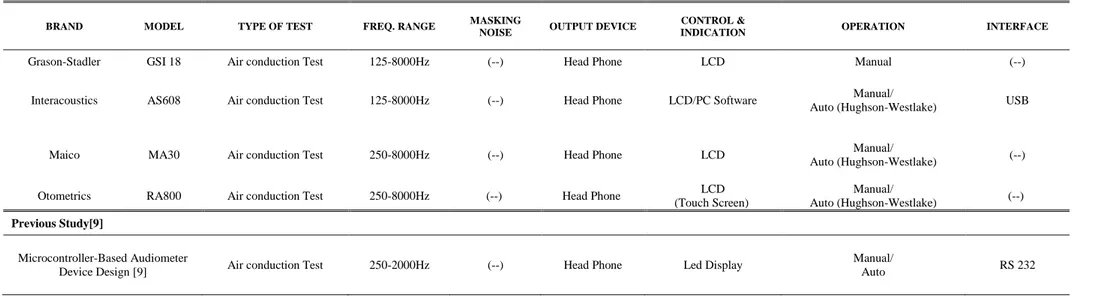
A comparison of various audiometers are summarized in this subsection (Table 1.2). These screening audiometers are produced for commercial purposes. As seen in the table, these audiometers have frequency values between 125-8000 Hz and they have not masking features. In addition, they have manual and automated audio test features. These devices are used Hughson-Westlake method for automatic audio test. The purpose of this thesis, designing an audiometer that can be controlled with the touch screen, capable of automatic and manual audio test, capable of audio control of integrated to different sources, capable of masking which can use audio files on the memory card and audio from integrated sources as a masking audio.
19
Table 1.2: Comparison of different audiometers. BRAND MODEL TYPE OF TEST FREQ. RANGE MASKING
NOISE OUTPUT DEVICE
CONTROL &
INDICATION OPERATION INTERFACE
Grason-Stadler GSI 18 Air conduction Test 125-8000Hz (--) Head Phone LCD Manual (--)
Interacoustics AS608 Air conduction Test 125-8000Hz (--) Head Phone LCD/PC Software Manual/
Auto (Hughson-Westlake) USB
Maico MA30 Air conduction Test 250-8000Hz (--) Head Phone LCD Manual/
Auto (Hughson-Westlake) (--)
Otometrics RA800 Air conduction Test 250-8000Hz (--) Head Phone LCD
(Touch Screen)
Manual/
Auto (Hughson-Westlake) (--)
Previous Study[9]
Microcontroller-Based Audiometer
Device Design [9] Air conduction Test 250-2000Hz (--) Head Phone Led Display
Manual/
21 2. DESIGN AND INSTRUMENTATION
The designed device is composed of various parts (Figure 2.1).These sections; 1. Audiometer Box
Main Control Card (STM32F746G-DISCO) Signal Generator (Pure Tone Generator) Attenuator Circuits
Analog Switches
External Input dB meter Circuit Power Supply Board
2. Headset
3. Patient Response Button
Figure 2.1: General block diagram of device.
Audio signals which are generated in pure tone generator, played from memory card or transmitted from integrated devices, are transmitted to attenuators with selector switches. Audio signals are processed at this part of audiometer and transmitted to the patients. Patients’ responses are taken by patient response button. Users can control the audiometer by the touch screen.
22 2.1 Main Control Card
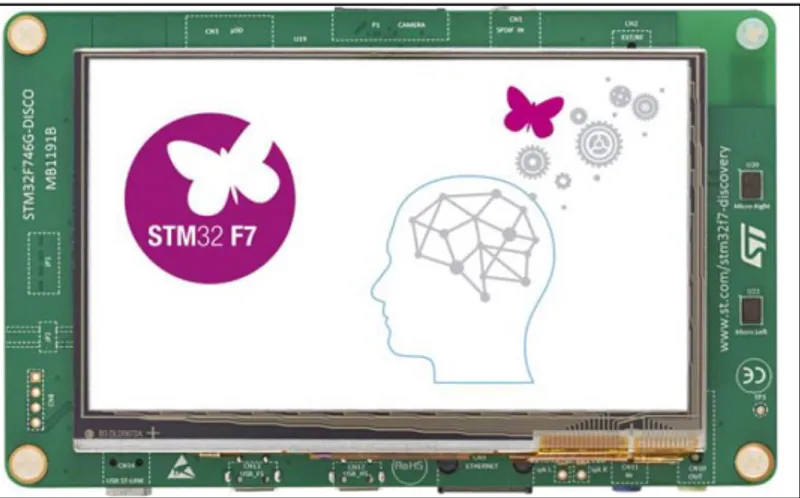
STM32F746G-DISCO discovery board manages all control operations of audiometer (Figure 2.2). The STM32F746G-DISCO discovery board (32F746GDISCOVERY) is a complete demonstration and development platform for STMicroelectronics ARM® Cortex®-M7-core based STM32F746NGH6 microcontroller. This microcontroller features four I2Cs, six SPIs with three multiplexed simplex I2S, SDMMC, four USARTs, four UARTs, two CANs, three 12-bit ADCs, two 12-bit DACs, two SAIs, 8- to 14-bit digital camera module interface, internal 320+16+4-Kbyte SRAM and 1-Mbyte Flash memory, USB HS OTG, USB FS OTG, Ethernet MAC, FMC interface, Quad-SPI interface, SWD debugging support.
The full range of hardware features on the board helps evaluate almost all peripherals (USB OTG HS, USB OTG FS, 10/100-Mbit Ethernet, microSD card, USART, SAI Audio DAC stereo with audio jack input and output, MEMS digital microphones, SDRAM, Quad-SPI Flash memory, 4.3-inch color LCD-TFT with a capacitive multi-touch panel, SPDIF RCA input, etc.) and to develop applications [10].
Figure 2.2: STM32F746G-DISCO discovery board.
With the embedded program that is written into the STM32F746NGH6 microcontroller on the main control card, Graphical User Interface (GUI) is designed and memory card audio player is programmed. Pure tone generator circuit and attenuator circuits are controlled by SPI 3-wire serial communication and audio signals are controlled via 74HC4066 analog switch.
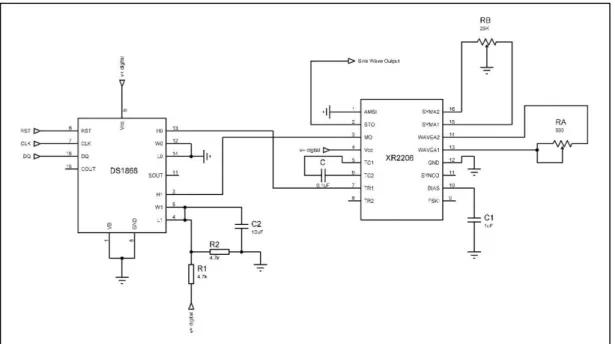
23 2.2 Pure Tone Generator
Pure tone is generated with XR2206 function generator that is capable of producing high quality sine waveform of high-stability and accuracy. The circuit for sine wave generation with minimum harmonic distortion is designed (Figure 2.3). In addition, DS1868 digital potentiometer is used for adjusting frequency and amplitude of pure tone by main controller board with serial communication.
The DS1868 Dual Digital Potentiometer Chip consists of two digitally controlled solid-state potentiometers. Each potentiometer is composed of 256 resistive sections. Between each resistive section and both ends of the potentiometer are tap points that are accessible to the wiper. The position of the wiper on the resistor array is set by an 8-bit value that controls which tap point is connected to the wiper output. Communication and control of the device is accomplished via a 3-wire serial port interface. This interface allows the device wiper position to be read or written.
Figure 2.3: Pure tone generator circuit.
The harmonic content of sinusoidal output can be reduced to -0.5% by adjustments. The potentiometer RA adjust the sine-shaping resistor and RB provides the fine adjustment for the waveform symmetry. The adjustment procedure is as follows:
Set RB at midpoint and adjust RA for minimum distortion With RA set as above, adjust RB to further reduce distortion.
24
The frequency of oscillation f0 is determined by the external timing capacitor (C) across pin 5 and 6, and by the timing resistor of DS1868 digital potentiometer is used for timing resistor connected to pin 7. The frequency is given at equation 2.1.;
𝑓𝑜 = 1
𝑅.𝐶 Hz (2.1)
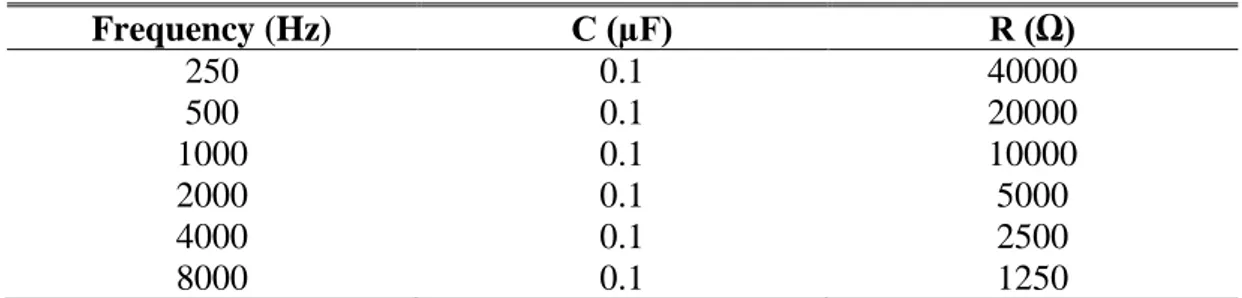
The value of timing capacitor is 0.1µF. DS1868 digital potentiometer chip can be adjusted between 0-50kΩ (H1-W1-L1). The calculation of frequencies are shown in Table 2.1.
Table 2.1: Calculation of digital potentiometer.
Frequency (Hz) C (µF) R (Ω) 250 0.1 40000 500 0.1 20000 1000 0.1 10000 2000 0.1 5000 4000 0.1 2500 8000 0.1 1250
Maximum output amplitude is inversely proportional to external resistor DS1868 (Figure 2.4). Amplitude is extremely 60mV peak per kΩ of DS1868 digital potentiometer chip (H0-W0-L0). Output amplitude is set to 100dB sound level of headset.
Figure 2.4: Output amplitude as a function of DS1868 [11]. 2.2.1 Communication with DS1868
Communication and control of the DS1868 is accomplished through a 3-wire serial port interface that drives an internal control logic unit. The 3-wire serial interface consists of the three input signals: RST, CLK, and DQ.
25
The RST control signal is used to enable the 3-wire serial port operation of the device. The RST signal is an active high input and is required to begin any communication to the DS1868. The CLK signal input is used to provide timing synchronization for data input and output. The DQ signal line is used to transmit potentiometer wiper settings and the stack select bit configuration to the 17-bit I/O shift register of the DS1868 (Figure 2.5).
Figure 2.5: 17 bit I/O shift register [11]. 2.3 External Input dB Meter
Audio signals’ volume are measured by dB meter circuits and shown on the screen. Audio signals processed in the dB meter and divided to 0-5V for analog inputs of main controller board (Figure 2.6). Moreover, dB value is calculated by embedded software.
Figure 2.6: dB meter circuit.
Meters acquire AC rms voltage on measuring, recording, and output levels in an electronic gear in general. For a given resistor R, the power is
26 So, the difference in voltage level is
20 log(V2/V1) dB = 10 log (V22 / V12 ) dB = 10log (P2
P1) (2.3)
or, absolute voltage level
20log ( V
Vref) (2.4)
where Vref is reference voltage.
The obvious level to choose is one-volt rms, and in this case, the level is written as dBV. This is rational, and convenient with modern analog-digital cards whose maximum range is often about one volt rms. There is no simple method to convert dBV into dB of sound level. It depends on how you convert the electrical power into sound power. Even if your electrical signal is connected directly to a loudspeaker, the conversion will depend on the efficiency and impedance of your loudspeaker. In this study impedance of headset, which are TDH39 model, is 10Ω. Calculations of dB meter made by main board according to TDH39 Headset [12].
2.4 Attenuator Circuits
Audio signals that are generated from pure tone generator and audio player calibrated to 90 dB volume, transmitted to attenuator circuits. In addition, audio signals from different sources are measured by dB meter circuit and transmitted to attenuator circuits. PGA2311 stereo audio controller is used on the circuits.
The PGA2311 device is a high-performance, stereo audio volume control designed for professional and high-end consumer audio systems. The PGA2311 uses an internal high-performance operational amplifier to yield low noise and distortion. The PGA2311 also provides the capability to drive 660-Ω loads directly without buffering. The 3-wire serial control interface allows for connection to a wide variety of host controllers, in addition to support for daisy chaining of multiple PGA2311 devices.
The heart of the PGA2311 is a resistor network, an analog switch array, and a high-performance operational amplifier stage. The switches select taps in the resistor network that determine the gain of the amplifier stage. Switch selections are
27
programmed using a serial control port. The serial port allows connection to a wide variety of host controllers. The Functional Block Diagram shows a model diagram of the PGA2311 (Figure 2.7).
Figure 2.7: Functional block diagram of PGA2311 [13].
The gain for each channel is set by its corresponding 8-bit code, either R[7:0] or L[7:0]. The gain code data is straight binary format. If N equals the decimal equivalent of R[7:0] or L[7:0], then the following relationships exist for the gain settings:
For N = 0: Mute Condition. The input multiplexer is connected to analog ground (AGNDR or AGNDL).
For N = 1 to 255
𝐆𝐚𝐢𝐧 (𝐝𝐁) = 𝟑𝟏. 𝟓 − [𝟎. 𝟓 𝐰 (𝟐𝟓𝟓 − 𝐍)] (2.5) This results in a gain range of +31.5 dB (with N = 255) to −95.5 dB (with N = 1). In design of attenuator circuits, the daisy changing of multiple PGA2311 chips feature is used. 16+16=32bits shift register data is sent to these chips. The first 16 bits of data is set the volume of first chip and second half of the data is set volume of second chip. Thus, two PGA2311 chips are controlled one 3-wire serial connections. The PGA2311 also provides the capability to drive 660Ω loads without buffering. Therefore, there is no need to design buffering circuit for TDH39 (10 Ω) Headsets. Attenuator circuits are designed according to recommended connection diagram of device (Figure 2.8).
28
Figure 2.8: Attenuator circuits.
The serial control port is used to program the gain settings for the PGA2311. The serial control port includes three input pins and one output pin. The inputs include CS (pin 2), SDI (pin 3), and SCLK (pin 6). The output pin is SDO (pin 7).
The CS pin functions as the chip-select input. Data can be written to the PGA2311 only when CS is LOW. SDI is the serial data input pin. Control data are provided as a 16-bit word at the SDI pin, 8 bits each for the left and right channel gain settings (Figure 2.9). Data are formatted as MSB first, in straight binary code. SCLK is the serial clock input. Data are clocked into SDI on the rising edge of SCLK.
29
Figure 2.9: Serial interface protocol [13]. 2.5 Source Switch Circuit
Audio signals, which are generated from pure tone generator audio player and different sources, are transmitted to patient by selection of analog switches. There are 2 74HC4066 analog switch chips used on this audiometer. One of them located to output of pure tone generator and used for selection of right and left channel. Other one is used for controlling external inputs and audio player outputs that transmits the audio signal to the headsets according to audiometer’s operating mode. As an example, the transmission of pure tone audio signal to the right channel is shown below (Figure 2.10).
Figure 2.10: The transmission of pure tone audio signal to the right channel. 2.6 Power Supply Board
The power supply could be designed as a linear structure. In this type of power supply, line voltage is reduced to designed voltage with transformer. After rectification and filtering process, output voltage is regulated. Using line-frequency
30
transformers and huge size of filtering equipment are cause lots of cost, power consumption and large sizes.
Next, in the process of regulation, voltage of regulation chip turns to thermal energy depends to drawn of current. In practice, SMPS power supply is designed with the help of manual and application manual of TOP244Y embedded system and 12V DC is obtained (Figure 2.11). Then this voltage level inverted to +-5V level with Meanwell DCW08A-05 and SCW08A-05.
Figure 2.11: Power supply circuit [14]. 2.7 Software
In this audiometer, audio input-output processes, pure tone generator and attenuator circuits are controlled by main control board that is STM32F746NG-DISCO development kit. The user interface of touch screen is designed on main control board and easy to use device is provided. Main control board controls audio input and outputs by making Low and High nE inputs of audio switches. Pure tone generator and attenuator control is performed with a 3-wire serial control interface. 3-wire serial communication contains shift registers that controls right and left channels. In addition, the volume of external inputs are measured by dB meter circuit using analog inputs of main control board. Wav files, which are masking sounds in the SD card, are played with embedded software and transmitted to patients’ ear.
31
STM32F746G microcontroller software is written in C++ and compiled by ARM mbed (Figure 2.12). The software size is 127kb.
Figure 2.12: ARM mbed [15]. 2.7.1 Flowcharts
The general structure of the program is designed as shown in Figure 2.13. Interrupts are created with the modes selected from the home page and it goes to the related page.
32
In Mode 1, operations are performed according to the information received from the touch screen and buttons. The flowchart is shown in Figure 2.14.
33
In Mode 2, the Modified Hughson-Westlake Method was applied as an automatic test. This method is a common method used in manual tests. In this mode, voice signals are sent to the patient's ear for about 5 seconds. This time is provided by the loop delay. Mode 2 software flowchart is shown in Figure 2.15.
34
35
In Mode 3, the sound signals from the external source are attenuated according to the desired sound intensity and controlled with 1 dB sensitivity. The flowchart is shown in Figure 2.16.
37 3. RESULTS
3.1 Graphical User Interface (GUI)
In this study, 4.3-inch LCD-TFT with capacitive touch screen, which is on the STM32F746G-DISCO discovery kit, is used. Three different interfaces are designed according to audiometer design. The menu, first page screen is provided switch between these interfaces (Figure 3.1).
Figure 3.1: First page screen.
On the manual test screen, there is an audiogram chart, which draw an audiogram synchronously, and there are indicators that show the channel selection with colour change (Figure 3.2). In addition, there are buttons set the frequency, audio volume and there is a masking menu under this section. Patient response indicator, which is at the bottom of screen, turns green when patient push the response button.
38
There are audiogram chart, channel selection buttons, frequency and volume indicators and patient response button on the automatic test screen (Figure 3.3).
Figure 3.3: Automatic test screen.
There are on-off buttons, source selection, and input-output volume adjustment buttons for both channels. With the menu button, which is at the bottom-left corner of screen, is turns to menu screen and provided switch between screens (Figure 3.4).
Figure 3.4: Audio control screen. 3.2 Output Signals and Calibration
Device output signals are pure sound, noise sounds and external source sounds. The pure tone signal is adjusted by comparing the sample signal with the aid of an oscilloscope program designed in computer environment according to the procedure (Figure 3.5). This computer program also has the signal generator feature. The signal generated by the program and produced by the device.
39
Figure 3.5: Comparison of 1000 Hz pure tone.
In addition, the white and pink noise signals played from the memory card are compared with the computer-generated signals (Figures 3.6 and 3.7).
Figure 3.6: Comparison of white noise.
40
The input and output signals are compared to observe the output of any signal from the external source. In the designed pure tone generator, the amplitude value can be adjusted by the resistor RA. The frequency value is set by the DS1868 digital potentiometer. The pure tone generator output amplitude should be set to 90 dB. Since the PGA system can control the audio signal with 0.5 dB sensitivity, the calibration can be digitally corrected even if it is distorted at the generator level. The signal outputs according to the resistance values shown in Table 2.1 of Section 2 are as follows (Figures 3.8, 3.9, and 3.10).
Figure 3.8: 500 Hz pure tone FFT.
41
Figure 3.10: 8000 Hz pure tone FFT. 3.3 Thesis Outputs
In the course of this thesis study, a sound control card (Figure 3.11) was produced to help research that will be done in the doctoral dissertation of the faculty of health sciences of the Dokuz Eylul University. The aim of the doctoral dissertation is to compare the findings of auditory evoked cortical potentials (AEP) obtained from the low and high geriatric population with word recognition score (PRS) [16].
Figure 3.11: Sound card and HEARLAB.
The HEARLab® System-Cortical Auditory Evoked Potential Analyser was used. This was followed by auditory evoked cortical potency tests (Figure 3.12). Introducing the headset from the headset is offered at 80dB SPL. The sound control
42
card adds a modulated speech stimulus to the Hearlab system's field and a 75dB SPL volume-limited speech stimulus at the earpiece and the desired intensity.
Figure 3.12: Test environment [16].
In addition, the designed sound control card contributed to another academic research [17]. The HEARLAB evoked potential test system is a device used to obtain auditory evoked potentials, especially for hearing aids or cochlear infants, and for young children to provide information about whether the device is calibrated correctly. The device is capable of delivering speech stimuli produced from the "m", "g" and "t" phonemes at 55, 65, and 75 dB SPL volume with the free-field speaker and recording the resulting cortical potentials with these stimuli. Research needs to make an ear-specific recording, and masking is required. However, this device does not allow speech stimuli to be emitted from the headset and provide mask noises. With the external integration of the device, the stimuli can be delivered at the desired volume from a headset without making any changes to the device. At the input of the second channel of the transition, a sound source, which plays a mask sound recording, is connected and the mask sound is given at the desired sound level. The implemented electronic card is packed as a device (Figures 3.13 and 3.14) with an external user button, which must be located by near the subject.
43
Figure 3.13: Designed audiometer prototype (Front view).
Figure 3.14: Designed audiometer prototype (Rear view).
As a result of these studies, two papers of "The Effect of Signal to Noise Ratio on Cortical Auditory Evoked Potentials in Patients with Presbycusis" and "Designing a New Audiometer Device" were published in 12th Congress of the European
![Figure 1.1: Cross-section of the human ear [3].](https://thumb-eu.123doks.com/thumbv2/9libnet/3711470.24972/24.892.170.658.103.423/figure-cross-section-human-ear.webp)
![Figure 1.2: The middle ear [3]. 1.1.1.3 The inner ear](https://thumb-eu.123doks.com/thumbv2/9libnet/3711470.24972/26.892.226.603.107.441/figure-the-middle-ear-the-inner-ear.webp)
![Figure 1.7: Hughson-Westlake technique threshold selection [8]. For example,](https://thumb-eu.123doks.com/thumbv2/9libnet/3711470.24972/35.892.239.723.104.388/figure-hughson-westlake-technique-threshold-selection-example.webp)
![Figure 1.8: A general block diagram of audiometer[5]. 1.4.1 Comparison of different audiometers](https://thumb-eu.123doks.com/thumbv2/9libnet/3711470.24972/40.892.180.651.370.779/figure-general-block-diagram-audiometer-comparison-different-audiometers.webp)