ECONOMIC OUTLOOK IMPROVED IN NOVEMBER
Zümrüt İmamoğlu* and Barış Soybilgen†Executive Summary
In November, the Industrial Production Index (IPI) increased by 2.9 percent from the previous month. Export volume index and import volume index increased by 2.6 percent and 0.9 percent, respectively. In November, IPI recovered as expected, and offset the fall in October which was caused by the holiday effect. We believe that private consumption decelerated, and private investment stagnated in the last quarter. However, December data will mostly determine the direction of growth in the last quarter.
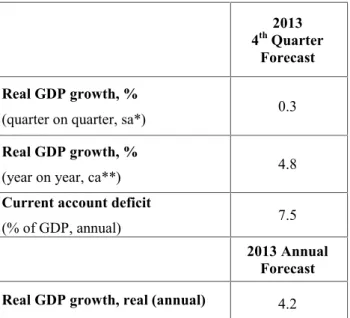
After the recovery in both exports and IPI, Betam revised its growth forecast for the last quarter upward. We increased our quarter on quarter growth forecast for the last quarter from 0.1 percent to 0.3 percent, and the corresponding year on year (YoY) forecast from 4.5 percent to 4.8 percent. We also revised our annual growth forecast for 2013 from 4.1 percent to 4.2 percent. The current account deficit ratio also increased due to TL depreciation. Betam expects the current account deficit to GDP ratio, which was 7.2 percent at the end of third quarter, to increase to 7.5 percent at the end of the year.
* Dr. Zümrüt İmamoğlu, Betam, Research Associate. [email protected]
†Barış Soybilgen, Betam, Research Assistant, [email protected]
Table 1: Betam’s quarterly and annual growth rate forecasts
Source: Betam. *sa: seasonally and calendar day adjusted **ca: calendar day adjusted.
Recovery in November
In November, the increase in IPI offset the fall in October which was caused by the bridge day effect during the holiday. So far, the average IPI is 0,9 percent above that of the third quarter, however, the December IPI data will be crucial for the last quarter. It isn't yet clear how effective newly arisen risks in the second half of December, which originate from FED's policies and internal political uncertainty, will be. Since purchase orders in production are given at least a few months in advance, the economy will be mostly affected in
2013
4thQuarter
Forecast Real GDP growth, %
(quarter on quarter, sa*) 0.3
Real GDP growth, %
(year on year, ca**) 4.8
Current account deficit
(% of GDP, annual) 7.5
2013 Annual Forecast
Real GDP growth, real (annual) 4.2
Economic Outlook and Forecasts:
January 2014
the first quarter of 2014 rather than the last quarter of 2013. On the other hand, power outages triggered by the lower than usual temperatures may reduce production slightly.
We predict that private consumption continued to increase in the last quarter, but it slowed down compared to the third quarter. Decreases we observe in non-durable goods and automobile production are in line with this prediction. Weak outlook in private investment continues. Increases in both investment goods production and imports are small. Net exports may contribute positively again, because exports recovered in November, and increases in imports were limited.
Following the November data release, we revised our growth forecast upward. In October, our quarter on quarter growth forecast was 0.1 percent. We still believe that growth in the last quarter remained low. We increase our quarter on quarter growth forecast to 0.3 percent. Therefore, our annual forecast for 2013 is revised up to 4.2 percent and we expect the year on year growth for the last quarter to be 4.8 percent.
We observe J-curve effect in the current account deficit. Even though we increase our growth forecast, our GDP forecast in USD fell due to increase in exchange rate. Therefore, our current account deficit to GDP ratio forecast increased to 7.5 percent from 7.4 percent.
2014 projections
At the end of December, we witnessed two important developments that can affect economic
growth in 2014. The first one was the FED's tapering decision, the second one was the graft probe that began in December 17th and the political uncertainty environment that followed. FED's decision was not surprising. Even though the exact timing was not known, the tapering was anticipated since May, and it was known that Turkish policy makers have been preparing for an exit strategy for a long time. Markets were prepared for this decision. However, graft probe that began only one day before the FED's decision and the following political uncertainty was not expected. These developments made it harder to measure the magnitude of market reaction to FED decision. But it is clear that Turkey was affected more negatively than other emerging markets. Monetary policy in response was a sharp increase in the policy rate and a return to orthodox policies. We believe that the monetary stance will remain tight all throughout 2014. We also believe that fiscal policy will be tight in order to meet budget targets. Both of these policies will depress the domestic demand. Political uncertainties will reduce consumption and investment expenditure and cause savings to increase. But if low growth rates trigger unemployment or businesses start to suffer due to cost increases stemming from the depreciation in the currency and higher interest rates, fiscal stance might become more accommodative. Still, the main engine of the growth in 2014 will be exports and the current account deficit will fall rapidly. Under these circumstances, it does not seem possible to reach the government's target of 4 percent growth in 2014.
Consumption indicators recovered in November
Due to the bridge days effect, seasonally adjusted indicators were mostly negative in October. As expected, indicators recovered in November. Consumer goods imports increased by 3.3 percent in November from the previous month. In the same period, durable and non-durable goods production increased by 2.3 percent and 3.1 percent. Consumer confidence increased by 2.6 percent in November; it increased by 0.3 percent in December and its upward trend continues.
Weak recovery in Investment
Following the negative outlook in October, investment indicators recovered weakly. In November, investment goods imports, intermediate goods imports and investment goods production increased by 2.5, 0.7 and 1.7 percent, respectively. In the same period, the IPI, passenger car and commercial vehicle production increased by 2.9, 2.5 and 1.4 percent, respectively. However, these increases are not enough to offset the fall in the previous month. In December, capacity utilization rate (CUR) increased by 0.9 percentage points, whereas real sector confidence index decreased by 0.5 percent.
Both exports and imports increased Figure 2 shows monthly changes of seasonally adjusted import and export volume indices. In November, export volume index and import volume index increased from the previous month by 3.1 percent and 3.0 percent, respectively. In the
same period, gold excluded exports and imports increased by 1.6 percent and 0.2 percent, respectively. The higher increase in exports than imports when gold is excluded suggests a positive contribution from net exports to growth in the last quarter.
Gold excluded current account continues to decline
In November, the current account deficit was $3.94 billion. Therefore, 12-month current account deficit fell to $60.8 billion from $60.9 billion. The12-month gold excluded current account deficit was $52 billion in October and it fell to $50.7 billion in November.
In the last couple of years, Turkey's gold trade was connected to trade with Iran due to US embargo. Therefore, it is not correct to link the current account deficit that is caused by gold trade with main economic indicators like growth or exchange rate. To measure domestic demand driven current account deficit, we should exclude gold trade. However, on the financing side of course, whatever goods Turkey imports accounts and should be financed by either higher exports or capital inflows.
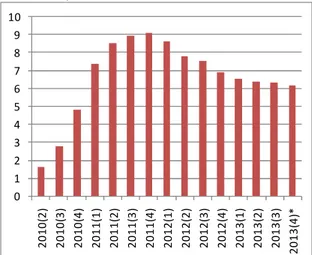
Figure 3 and 4 show gold excluded and gold included current account deficit to GDP ratios. Both ratios declined between December 2011 and March 2013, but only gold excluded current account deficit continued its decline through the rest of 2013. This is in line with the mild growth we observe and the depreciation in the Turkish Lira. Betam expects the current account to GDP
ratio to be 7.5 percent and gold excluded current account to GDP ratio to be 6.2 percent at the end
of the year. We expect the decline in current account deficit to accelerate in 2014.
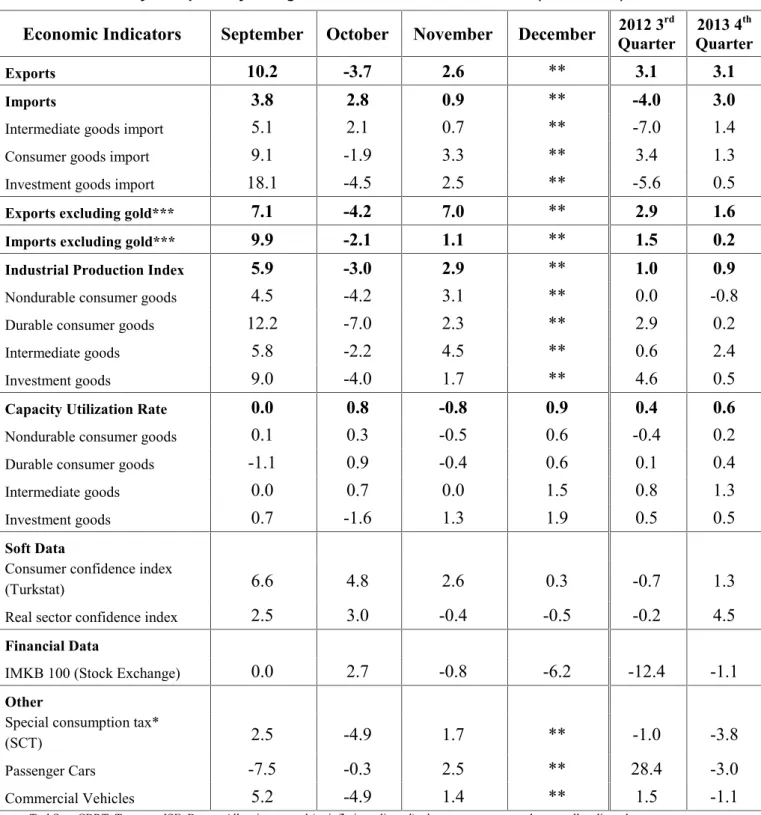
Table 2: Monthly and quarterly changes of Betam’s selected indicators (real and sa)
Economic Indicators
September October
November
December
Quarter2012 3rd Quarter2013 4thExports
10.2
-3.7
2.6
**
3.1
3.1
Imports
3.8
2.8
0.9
**
-4.0
3.0
Intermediate goods import
5.1
2.1
0.7
**
-7.0
1.4
Consumer goods import
9.1
-1.9
3.3
**
3.4
1.3
Investment goods import
18.1
-4.5
2.5
**
-5.6
0.5
Exports excluding gold***
7.1
-4.2
7.0
**
2.9
1.6
Imports excluding gold***
9.9
-2.1
1.1
**
1.5
0.2
Industrial Production Index
5.9
-3.0
2.9
**
1.0
0.9
Nondurable consumer goods
4.5
-4.2
3.1
**
0.0
-0.8
Durable consumer goods
12.2
-7.0
2.3
**
2.9
0.2
Intermediate goods
5.8
-2.2
4.5
**
0.6
2.4
Investment goods
9.0
-4.0
1.7
**
4.6
0.5
Capacity Utilization Rate
0.0
0.8
-0.8
0.9
0.4
0.6
Nondurable consumer goods
0.1
0.3
-0.5
0.6
-0.4
0.2
Durable consumer goods
-1.1
0.9
-0.4
0.6
0.1
0.4
Intermediate goods
0.0
0.7
0.0
1.5
0.8
1.3
Investment goods
0.7
-1.6
1.3
1.9
0.5
0.5
Soft Data
Consumer confidence index
(Turkstat)
6.6
4.8
2.6
0.3
-0.7
1.3
Real sector confidence index
2.5
3.0
-0.4
-0.5
-0.2
4.5
Financial Data
IMKB 100 (Stock Exchange)
0.0
2.7
-0.8
-6.2
-12.4
-1.1
Other
Special consumption tax*
(SCT)
2.5
-4.9
1.7
**
-1.0
-3.8
Passenger Cars
-7.5
-0.3
2.5
**
28.4
-3.0
Commercial Vehicles
5.2
-4.9
1.4
**
1.5
-1.1
Source: TurkStat, CBRT, Treasury, ISE, Betam. All series are real (or inflation adjusted) wherever necessary and seasonally adjusted. *This tax is collected on sales of goods such as gas. fuel oils. alcohol. tobacco products and automobiles.
**Data not yet released.
Figure 1: Capacity utilization rate and industrial production index (sa, left axis for CUR and right axis for IPI)
85 90 95 100 105 110 115 120 125 68 69 70 71 72 73 74 75 76 77 78 Ja n-10 M ay -1 0 Se p-10 Ja n-11 M ay -1 1 Se p-11 Ja n-12 M ay -1 2 Se p-12 Ja n-13 M ay -1 3 Se p-13 CUR IPI
Source: TurkStat, Betam.
Figure 2: Volume indices of exports and imports (sa)
80 90 100 110 120 130 140 Ja n-1 0 M ay -1 0 Se p-1 0 Ja n-1 1 M ay -1 1 Se p-1 1 Ja n-1 2 M ay -1 2 Se p-1 2 Ja n-1 3 M ay -1 3 Se p-1 3 Export Import Source: Turkstat, Betam.
Figure 3: Gold included current account deficit to GDP ratio, 12 months 0 1 2 3 4 5 6 7 8 9 10 11 20 10 (2 ) 20 10 (3 ) 20 10 (4 ) 20 11 (1 ) 20 11 (2 ) 20 11 (3 ) 20 11 (4 ) 20 12 (1 ) 20 12 (2 ) 20 12 (3 ) 20 12 (4 ) 20 13 (1 ) 20 13 (2 ) 20 13 (3 ) 20 13 (4 )*
Source: TurkStat, TCMB, Betam.
Figure 4: Gold excluded current account deficit to GDP ratio, 12 months 0 1 2 3 4 5 6 7 8 9 10 20 10 (2 ) 20 10 (3 ) 20 10 (4 ) 20 11 (1 ) 20 11 (2 ) 20 11 (3 ) 20 11 (4 ) 20 12 (1 ) 20 12 (2 ) 20 12 (3 ) 20 12 (4 ) 20 13 (1 ) 20 13 (2 ) 20 13 (3 ) 20 13 (4 )*
Figure 5: Weighted Average Interest Rates for Turkish Lira Banks' Loans (%) 5 7 9 11 13 15 17 19 21 Ja n-10 M ar -1 0 M ay -1 0 Ju l-1 0 Se p-10 No v-10 Ja n-11 M ar -1 1 M ay -1 1 Ju l-1 1 Se p-11 No v-11 Ja n-12 M ar -1 2 M ay -1 2 Ju l-1 2 Se p-12 No v-12 Ja n-13 M ar -1 3 M ay -1 3 Ju l-1 3 Se p-13 No v-13 Cash Vehicle Housing Commercial Source: CBRT.
Figure 6: YoY increase in IPI in 2012 and 2013 (calendar day adjusted)
-3 -2 -1 0 1 2 3 4 5 6 7 Jan ua ry Fe br ua ry M arc h Ap ril May June July Augu st Se pte m be r O cto be r No ve m be r De ce m be r 2012 2013 . Source: Turkstat.