EMPLOYMENT INCREASE SLOWS DOWN DRASTICALLY
Seyfettin Gürsel*Gökçe Uysaland Ayşenur AcarAbstract
Seasonally adjusted labor market data shows that non-agricultural unemployment rate remained at 12.6 percent in the period of September 2013. Annual increases in labor force have been slowing down due to a base effect. On the other hand, it is striking that the increase in employment is the lowest observed since the global economic crisis. Manufacturing employment has been decreasing for the last four periods, while employment increases in the service sector seems to have stalled.
Increases in both non-agricultural labor force and non-agricultural employment slow down
drastically
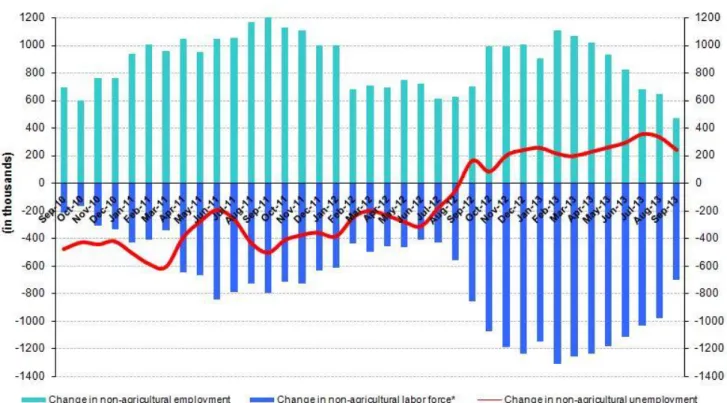
According to the data released by TurkSTAT, non-agricultural labor force increased by 705 thousand (3.3 percent) and non-agricultural employment increased by 468 thousand (2.5 percent) in the period of September 2013 (Figure 1). Consequently, the number of persons unemployed in non-agricultural sectors increased by 237 thousand (9.5 percent). Clearly increases in both non-agricultural labor force and non-agricultural employment have been slowing down. We expect lower annual increases in the upcoming periods as well. On the other hand, slow down in non-agricultural employment is striking. Given that during the past year, the employment increases were well over 600 thousand, and even reached one million on an annual basis, we believe that the abnormal GDP
growth-employment elasticity may have returned to normal.
Figure 1 Year-on-year changes in non-agricultural labor force, employment and unemployment
Source: TurkSTAT,Betam
*Prof. Dr. Seyfettin Gürsel, Betam, Director, [email protected]
Yrd. Doç. Dr. Gökçe Uysal, Betam, Vice Director, [email protected]
Labor Market Outlook:
December 2013
Slow down in non-agricultural employment
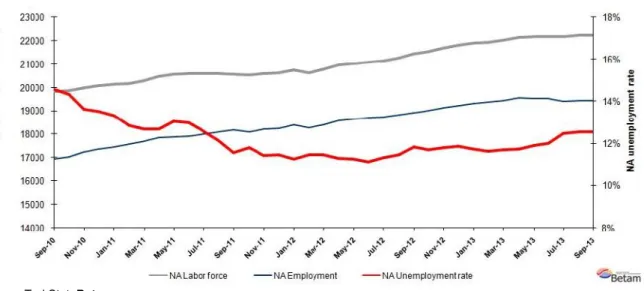
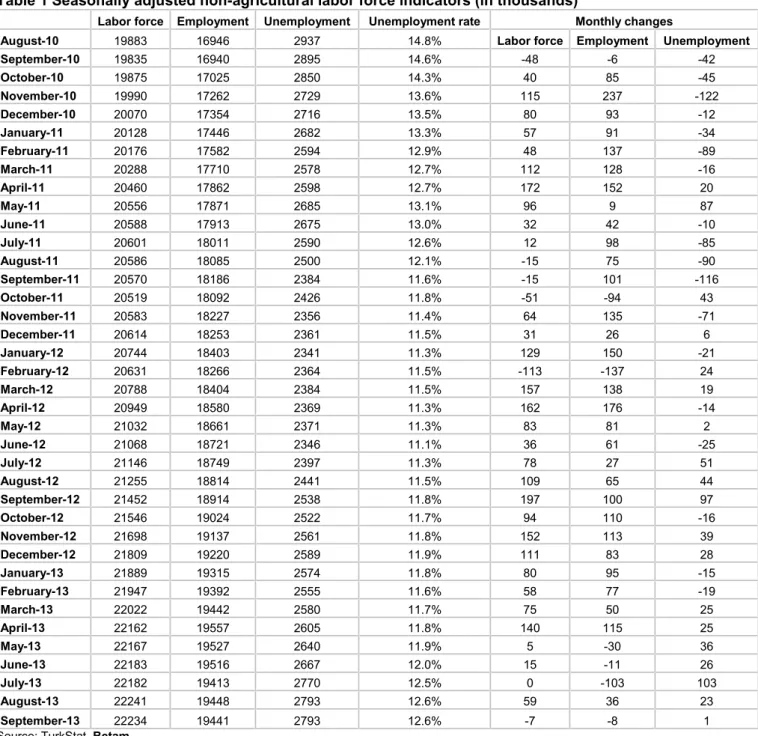
According to seasonally adjusted data, non-agricultural labor force decreased by 7 thousand in the period of September 2013 compared to the period of August 2013 and reached 22 million 234 thousand (Figure 2, Table 1). Non-agricultural employment decreased by 8 thousand and reached 19 million 441 thousand. Hence, the number of persons unemployed in non-agricultural sectors increased by one thousand and non-agricultural unemployment rate remained at 12.6 percent in the period of September 2013. Similarly, we observe that both non-agricultural labor force and non-agricultural employment have stagnated.
Figure 2 Seasonally adjusted non-agricultural labor force, employment and unemployment
Source: TurkStat,Betam
Increases in both female labor force and female employment
Figure 3 provides seasonally adjusted non-agricultural labor force and non-agricultural employment series by gender. Long term trends indicate that female labor force and female employment have increased much more compared to males in the last year. Male employment increased by 229 thousand (1.6 percent), while female employment increased by 256 thousand (5.6 percent) from September 2012 to September 2013. However, female employment increased by 11 thousand, while female labor force decreased by 2 thousand. In the same period, male employment increased 16 thousand, while male labor force increased one thousand.
Figure 3 Seasonally adjusted non-agricultural labor force and non-agricultural employment by gender (thousand)
Source: TurkStat,Betam
According to Kariyer.net data, non-agricultural unemployment will stagnate in the next period
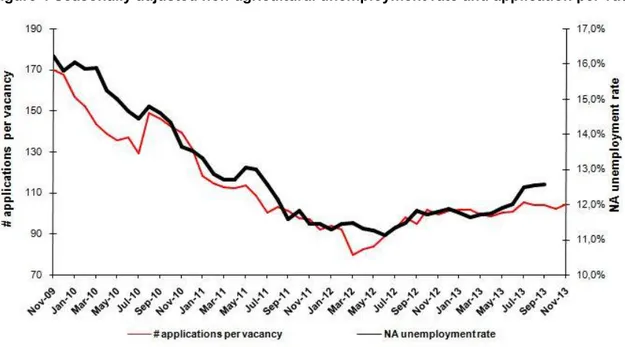
Seasonally adjusted application per vacancy statistics calculated using Kariyer.net1series indicate that non-agricultural unemployment increased in the period of October 2013 and decreased in the period of November 2013. Remember that labor market series pertaining to October are the average of three months: September, October and November. Hence, we expect the non-agricultural unemployment to stagnate in the period of October 2013.
Figure 4 Seasonally adjusted non-agricultural unemployment rate and application per vacancy
Source: Kariyer.net, TurkStat,Betam
1 Betam has been calculating application per vacancy using series released by Kariyer.net for a while. Seasonal and calendar adjustment
procedure is applied to application per vacancy series. A decrease in applications per vacancy may be caused by an increase in vacancies or by a decrease in the number of applications. An increase in vacancies signals economic growth while decreasing number of applications
Employment in manufacturing has been decreasing for the last four periods, and no employment
increases in service sector
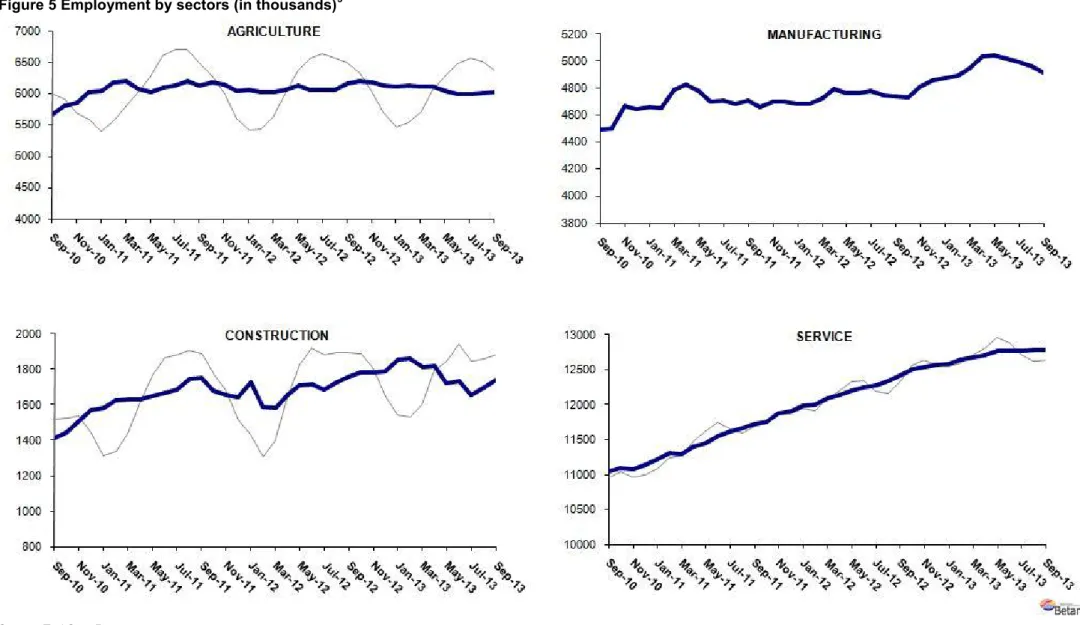
According to the seasonally adjusted labor market series, manufacturing employment has been decreasing for the last four periods (Table 2, Figure 5).2Employment losses in manufacturing are about to 130 thousand. Employment
in the service sector slightly increased (23 thousand) in the period of September 2013. In addition, we observe that increase in service employment is zero in the period of September 2013 compared to the period of August 2013. As for employment in the construction sector, we observe that it has been increasing for the last two periods.
2Employment in each sector is seasonally adjusted separately. Hence the sum of these series may differ from the seasonally adjusted series of
Figure 5 Employment by sectors (in thousands)3
Table 1 Seasonally adjusted non-agricultural labor force indicators (in thousands)
Labor force Employment Unemployment Unemployment rate Monthly changes
August-10 19883 16946 2937 14.8% Labor force Employment Unemployment
September-10 19835 16940 2895 14.6% -48 -6 -42 October-10 19875 17025 2850 14.3% 40 85 -45 November-10 19990 17262 2729 13.6% 115 237 -122 December-10 20070 17354 2716 13.5% 80 93 -12 January-11 20128 17446 2682 13.3% 57 91 -34 February-11 20176 17582 2594 12.9% 48 137 -89 March-11 20288 17710 2578 12.7% 112 128 -16 April-11 20460 17862 2598 12.7% 172 152 20 May-11 20556 17871 2685 13.1% 96 9 87 June-11 20588 17913 2675 13.0% 32 42 -10 July-11 20601 18011 2590 12.6% 12 98 -85 August-11 20586 18085 2500 12.1% -15 75 -90 September-11 20570 18186 2384 11.6% -15 101 -116 October-11 20519 18092 2426 11.8% -51 -94 43 November-11 20583 18227 2356 11.4% 64 135 -71 December-11 20614 18253 2361 11.5% 31 26 6 January-12 20744 18403 2341 11.3% 129 150 -21 February-12 20631 18266 2364 11.5% -113 -137 24 March-12 20788 18404 2384 11.5% 157 138 19 April-12 20949 18580 2369 11.3% 162 176 -14 May-12 21032 18661 2371 11.3% 83 81 2 June-12 21068 18721 2346 11.1% 36 61 -25 July-12 21146 18749 2397 11.3% 78 27 51 August-12 21255 18814 2441 11.5% 109 65 44 September-12 21452 18914 2538 11.8% 197 100 97 October-12 21546 19024 2522 11.7% 94 110 -16 November-12 21698 19137 2561 11.8% 152 113 39 December-12 21809 19220 2589 11.9% 111 83 28 January-13 21889 19315 2574 11.8% 80 95 -15 February-13 21947 19392 2555 11.6% 58 77 -19 March-13 22022 19442 2580 11.7% 75 50 25 April-13 22162 19557 2605 11.8% 140 115 25 May-13 22167 19527 2640 11.9% 5 -30 36 June-13 22183 19516 2667 12.0% 15 -11 26 July-13 22182 19413 2770 12.5% 0 -103 103 August-13 22241 19448 2793 12.6% 59 36 23 September-13 22234 19441 2793 12.6% -7 -8 1
Table 2 Seasonally adjusted employment by sector (in thousands)
Agriculture Manufacturing Construction Service Monthly changes
August-10 5666 4525 1411 11010 Agriculture Manufacturing Construction Service
September-10 5659 4489 1409 11042 -8 -36 -1 32 October-10 5792 4498 1441 11086 133 9 32 44 November-10 5845 4667 1510 11084 53 169 69 -2 December-10 6027 4642 1567 11145 183 -25 57 61 January-11 6032 4656 1580 11209 5 14 14 64 February-11 6177 4652 1626 11304 145 -4 46 95 March-11 6195 4790 1629 11291 18 138 3 -13 April-11 6078 4828 1632 11402 -117 38 3 111 May-11 6030 4777 1651 11443 -48 -51 19 41 June-11 6099 4697 1664 11552 70 -80 13 109 July-11 6122 4710 1683 11618 22 13 19 66 August-11 6195 4682 1745 11658 73 -28 63 40 September-11 6132 4707 1750 11729 -62 25 5 71 October-11 6169 4657 1678 11757 37 -50 -72 28 November-11 6145 4700 1656 11872 -23 43 -22 114 December-11 6044 4701 1643 11909 -101 1 -13 38 January-12 6050 4685 1727 11991 6 -16 84 82 February-12 6031 4684 1587 11995 -19 -1 -140 4 March-12 6023 4721 1584 12099 -8 37 -3 104 April-12 6059 4792 1652 12136 36 71 68 37 May-12 6121 4760 1706 12194 62 -32 54 59 June-12 6063 4761 1716 12245 -58 1 10 50 July-12 6063 4778 1686 12284 0 17 -30 40 August-12 6059 4745 1730 12339 -4 -33 44 55 September-12 6157 4735 1757 12421 97 -10 27 83 October-12 6192 4732 1783 12509 35 -3 26 88 November-12 6176 4814 1780 12543 -16 82 -2 34 December-12 6129 4856 1789 12575 -47 42 9 32 January-13 6107 4870 1853 12592 -23 14 63 18 February-13 6131 4886 1859 12647 25 16 6 55 March-13 6115 4948 1813 12681 -16 62 -45 34 April-13 6103 5030 1816 12711 -12 82 2 30 May-13 6042 5044 1721 12762 -62 14 -95 51 June-13 5987 5015 1735 12766 -54 -29 14 4 July-13 5987 4991 1652 12770 0 -24 -83 3 August-13 6010 4964 1699 12785 23 -27 47 15 September-13 6026 4914 1742 12785 16 -50 42 0