May 15, 2012
June 15, 2012
Labor Market Outlook:
June 2012
NON-AGRICULTURAL EMPLOYMENT STAGNATES
Seyfettin Gürsel
*Gökçe Uysal
∗∗and Ayşenur Acar
∗∗∗Executive Summary
According to the labor market statistics released by Turk-Stat, non-agricultural unemployment rate
decreased from 12.7 percent to 12.1 percent. Seasonally adjusted labor market data shows that
non-agricultural unemployment rate decreased from 11.4 percent to 11.3 percent in the period of March 2012.
Non-agricultural unemployment rate declined slightly following an increase in non-agricultural employment
which was counterbalanced with an increase in non-agricultural labor force. The increase in non-agricultural
employment is mostly driven by a 71 thousand increase in service employment. Increases in manufacturing
and construction employment remains limited.
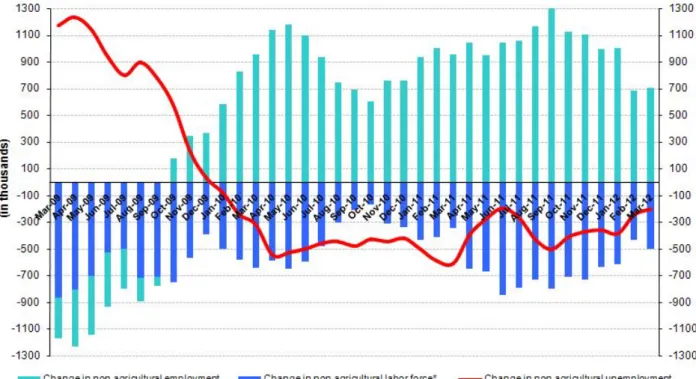
There is a slowdown in the annual increase in non-agricultural employment
According to the labor market statisics released by TurkStat on June 15th, in the period of March 2012
(February – March – April) agricultural labor force only increased by 502 thousand ( 2.5 percent),
non-agricultural employment increased by 704 thousand (4 percent) and the number of unemployed persons in
non-agricultural decreased by 202 thousand to 2 million 506 thousand on a year-on-year basis (Figure 1).
Annual increases in non-agricultural labor force had been over 600 thousand in the past periods. Thanks to
strong annual increases of almost 1 million in non-agricultural employment, non-agricultural unemployment
was decreasing rapidly. Increases in non-agricultural labor force and in non-agricultural employment have
been slowing down since February 2012. Hence, the decline in unemployed has been slowing down as well.
Figure 1 Year-on-year changes in non-agricultural labor force, employment and unemployment
Source: TurkStat, Betam
* Prof. Seyfettin Gürsel, Betam, Director, [email protected]
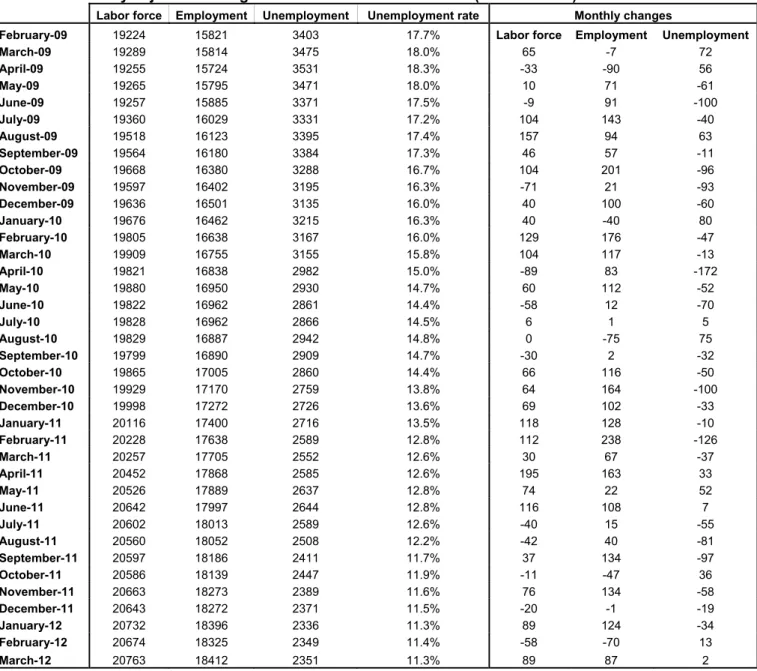
Seasonally adjusted non-agricultural unemployment remained stagnant
According to seasonally adjusted series, non-agricultural labor force increased by 89 thousand to 20 million
763 thousand in the period of March compared to the period of February 2012 (Figure 2, Table 1).
Non-agricultural employment increased by 87 thousand and reached to 18 million 412 thousand. Consequently,
the number of unemployed persons in non-agricultural sectors increased by 2 thousand and seasonally
adjusted non-agricultural unemployment rate decreased by 0.1 percentage point from 11.4 percent to 11.3
percent (Figure 2).
Figure 2 Seasonally adjusted non-agricultural labor force, employment and unemployment
Source: TurkStat, Betam
According to Kariyer.net series non-agricultural employment will increase in the period of
April 2012
In the previous research briefs, we used seasonal and calendar adjusted application per vacancy series
released by Kariyer.net. However, we have been using total vacancy series in this brief due to technical
difficulties as the total application series contains a structural break since April 2012
1.
According to data released by Kariyer.net the vacancy series provided by the firms has a significant increase
in May. In light of this data, we believe that non-agricultural employment will have stronger increase in the
period of April 2012 (March – April – May).
1
Seasonal and calendar adjustment procedure is applied to total vacancy series released by Kariyer.net. Total vacancy series is continuously increasing given that the customers base of Kariyer.net is widening overtime. Therefore we calculate the cycle of the series by subtracting the absolute number from the trend calculated by a Hodrick-Prescott fitler. Since the changes in the number of vacancies are negatively correlated with the changes in unemployment we use the inverse of total vacancy series by multiplying it with -1. Although this vacancy series are not as strong forecasters as the application per vacancy series, it gives an idea for the direction of non-agricultural unemployment.
Figure 3 Seasonally adjusted non-agricultural unemployment rate and total vacancy cycle
Data source: Kariyer.net, TurkStat, Betam
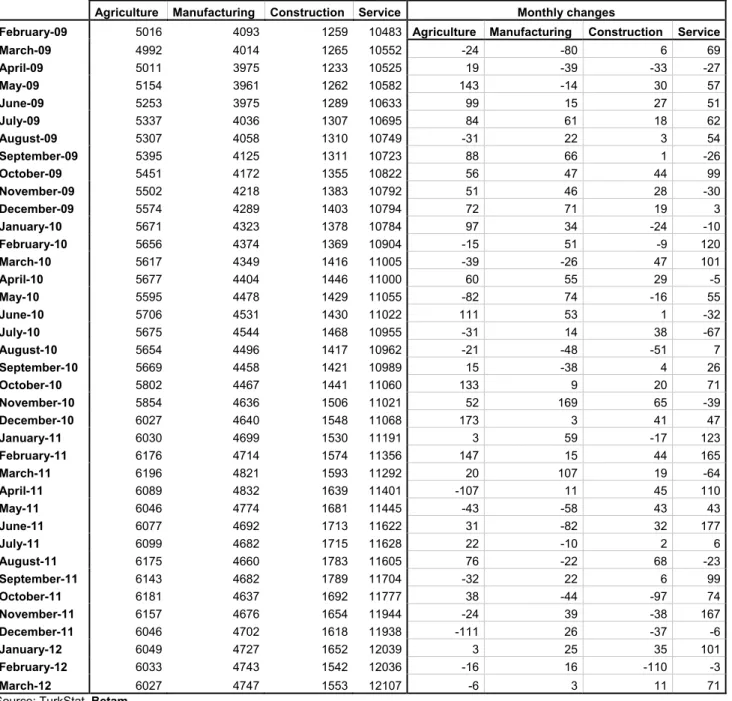
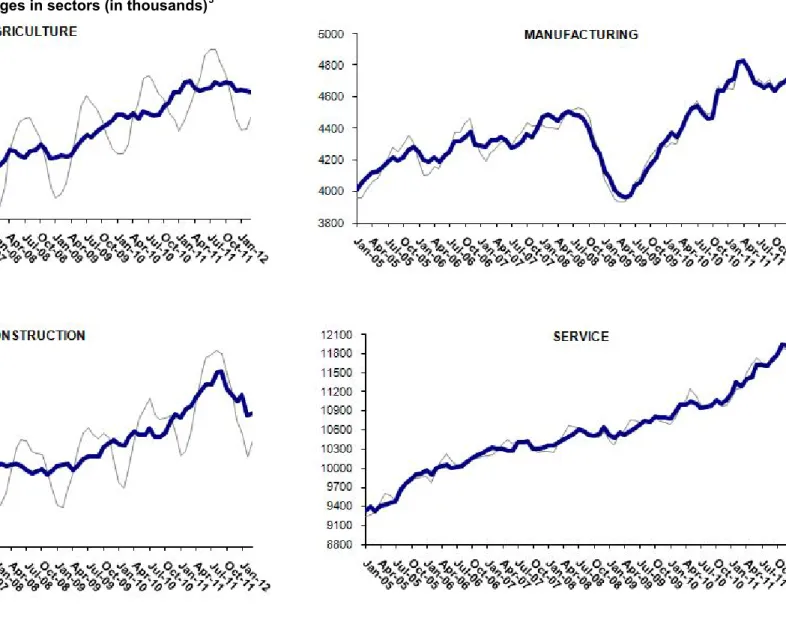
Strong increase in service employment
2According to seasonally adjusted figures, sectoral employment data points to significant employment
increases in services. Employment in this sector increased by 71 thousand in the period of March 2012
compared to February 2012. While construction employment suffered significant losses (110 thousand) in
the period of February, it increased by 11 thousand in the period of March 2012 (Table 2, Figure 4).
Employment in manufacturing increased only by 3 thousand in the period of March. This is consistent with
the decline in manufacturing production index.
Decline in agricultural employment has been continuing. Hence, we believe that increase in agricultural
employment observed in the past 3 years has been coming to an end.
2
Seasonal adjustment procedure is applied to each sector of employment series separately. Hence the sum of these series may differ from the seasonally adjusted series of total employment. The difference stems from the non-linearity of the seasonal adjustment process.
Table 1 Seasonally adjusted non-agricultural labor force indicators (in thousands)
Labor force Employment Unemployment Unemployment rate Monthly changes
February-09 19224 15821 3403 17.7% Labor force Employment Unemployment
March-09 19289 15814 3475 18.0% 65 -7 72 April-09 19255 15724 3531 18.3% -33 -90 56 May-09 19265 15795 3471 18.0% 10 71 -61 June-09 19257 15885 3371 17.5% -9 91 -100 July-09 19360 16029 3331 17.2% 104 143 -40 August-09 19518 16123 3395 17.4% 157 94 63 September-09 19564 16180 3384 17.3% 46 57 -11 October-09 19668 16380 3288 16.7% 104 201 -96 November-09 19597 16402 3195 16.3% -71 21 -93 December-09 19636 16501 3135 16.0% 40 100 -60 January-10 19676 16462 3215 16.3% 40 -40 80 February-10 19805 16638 3167 16.0% 129 176 -47 March-10 19909 16755 3155 15.8% 104 117 -13 April-10 19821 16838 2982 15.0% -89 83 -172 May-10 19880 16950 2930 14.7% 60 112 -52 June-10 19822 16962 2861 14.4% -58 12 -70 July-10 19828 16962 2866 14.5% 6 1 5 August-10 19829 16887 2942 14.8% 0 -75 75 September-10 19799 16890 2909 14.7% -30 2 -32 October-10 19865 17005 2860 14.4% 66 116 -50 November-10 19929 17170 2759 13.8% 64 164 -100 December-10 19998 17272 2726 13.6% 69 102 -33 January-11 20116 17400 2716 13.5% 118 128 -10 February-11 20228 17638 2589 12.8% 112 238 -126 March-11 20257 17705 2552 12.6% 30 67 -37 April-11 20452 17868 2585 12.6% 195 163 33 May-11 20526 17889 2637 12.8% 74 22 52 June-11 20642 17997 2644 12.8% 116 108 7 July-11 20602 18013 2589 12.6% -40 15 -55 August-11 20560 18052 2508 12.2% -42 40 -81 September-11 20597 18186 2411 11.7% 37 134 -97 October-11 20586 18139 2447 11.9% -11 -47 36 November-11 20663 18273 2389 11.6% 76 134 -58 December-11 20643 18272 2371 11.5% -20 -1 -19 January-12 20732 18396 2336 11.3% 89 124 -34 February-12 20674 18325 2349 11.4% -58 -70 13 March-12 20763 18412 2351 11.3% 89 87 2
Table 2 Seasonally adjusted sector of employment (in thousands)
Agriculture Manufacturing Construction Service Monthly changes
February-09 5016 4093 1259 10483 Agriculture Manufacturing Construction Service
March-09 4992 4014 1265 10552 -24 -80 6 69 April-09 5011 3975 1233 10525 19 -39 -33 -27 May-09 5154 3961 1262 10582 143 -14 30 57 June-09 5253 3975 1289 10633 99 15 27 51 July-09 5337 4036 1307 10695 84 61 18 62 August-09 5307 4058 1310 10749 -31 22 3 54 September-09 5395 4125 1311 10723 88 66 1 -26 October-09 5451 4172 1355 10822 56 47 44 99 November-09 5502 4218 1383 10792 51 46 28 -30 December-09 5574 4289 1403 10794 72 71 19 3 January-10 5671 4323 1378 10784 97 34 -24 -10 February-10 5656 4374 1369 10904 -15 51 -9 120 March-10 5617 4349 1416 11005 -39 -26 47 101 April-10 5677 4404 1446 11000 60 55 29 -5 May-10 5595 4478 1429 11055 -82 74 -16 55 June-10 5706 4531 1430 11022 111 53 1 -32 July-10 5675 4544 1468 10955 -31 14 38 -67 August-10 5654 4496 1417 10962 -21 -48 -51 7 September-10 5669 4458 1421 10989 15 -38 4 26 October-10 5802 4467 1441 11060 133 9 20 71 November-10 5854 4636 1506 11021 52 169 65 -39 December-10 6027 4640 1548 11068 173 3 41 47 January-11 6030 4699 1530 11191 3 59 -17 123 February-11 6176 4714 1574 11356 147 15 44 165 March-11 6196 4821 1593 11292 20 107 19 -64 April-11 6089 4832 1639 11401 -107 11 45 110 May-11 6046 4774 1681 11445 -43 -58 43 43 June-11 6077 4692 1713 11622 31 -82 32 177 July-11 6099 4682 1715 11628 22 -10 2 6 August-11 6175 4660 1783 11605 76 -22 68 -23 September-11 6143 4682 1789 11704 -32 22 6 99 October-11 6181 4637 1692 11777 38 -44 -97 74 November-11 6157 4676 1654 11944 -24 39 -38 167 December-11 6046 4702 1618 11938 -111 26 -37 -6 January-12 6049 4727 1652 12039 3 25 35 101 February-12 6033 4743 1542 12036 -16 16 -110 -3 March-12 6027 4747 1553 12107 -6 3 11 71 Source: TurkStat, Betam
Figure 4 Employment changes in sectors (in thousands)
3Source: TurkStat, Betam