Nanofabrication and plasma
polymerization assisted surface
modification of a transducer based on
localized surface plasmon resonance of
gold nanostructure arrays for biosensor
applications
Adil Burak Turhan
Demet Ataman
Yasin Sen
Mehmet Mutlu
Ekmel Özbay
surface modification of a transducer based on
localized surface plasmon resonance of gold
nanostructure arrays for biosensor applications
Adil Burak Turhan,
a,bDemet Ataman,
bYasin Sen,
b,eMehmet Mutlu,
band
Ekmel Özbay
a,c,daBilkent University Nanotechnology Research Center—NANOTAM, Ankara 06800, Turkey
bHacettepe University, Institute for Pure and Applied Sciences, Plasma Aided Bioengineering
and Biotechnology (PABB) Research Group, Nanomedicine and Nanotechnology Division, Ankara 06532, Turkey
cBilkent University, Department of Physics, Ankara 06800, Turkey
dBilkent University, Department of Electrical and Electronics Engineering, Ankara 06800,
Turkey
eAksaray University, Department of Food Technology, Guzelyurt Vocational School,
Aksaray 06100, Turkey
Abstract. The nanofabrication and surface modification of a transducer based on localized surface plasmon resonance (LSPR) of gold nanostructure arrays for biosensing was studied. We used electron beam lithography for the nanopatterning technique, which let us choose LSPR sensor properties by providing immense control over nanostructural geometry. A critical step in the utilization of this transducer is to form a selective biolayer over the gold nano-structures. We applied plasma polymerization and wet chemistry techniques for ethylene-diamine (EDA) modification and glutaraldehyde immobilization as intermediate layers, respectively. The gold nanostructure arrays were primarily modified using EDA in order to activate the surface with amine groups that are cross-linked with later added avidin molecules by the help of glutaraldhyde layer residing in between. The success of plasma polymerization was validated with x-ray photoelectron spectroscopy measurements. As a last step, we intro-duced biotin to the surface (biotin has a high affinity for avidin). We were able to detect the LSPR resonance wavelength shift in the transmission spectra at each step of modification, including the avidin-biotin interaction, which acts as a model for specific molecule detection using LSPR.© 2012 Society of Photo-Optical Instrumentation Engineers (SPIE). [DOI:10.1117/1.JNP .6.061602]
Keywords:localized surface plasmon resonance; electron beam lithography; plasma polymer-ization; transducer; biosensor.
Paper 12042SS received Apr. 17, 2012; revised manuscript received May 31, 2012; accepted for publication Jun. 5, 2012; published online Jul. 31, 2012.
1 Introduction
Localized surface plasmon resonance (LSPR) of metallic nanostructures is a phenomenon that is being intensively researched for biosensor applications.1–5Surface plasmon resonance (SPR) is the elecromagnetic radiation induced coherent oscillation of the surface conduction electrons that is observable in materials with negative real and near-zero imaginary dielectric constant.6 LSPR is a special case in which the interaction occurs between light and structures much smaller than its wavelength, and it leads to a local oscillation around the nano structure (instead of a propagating oscillation that moves along the metal-dielectric interface, as is the case for SPR)
with a certain resonance wavelength.7,8The Mie solution to Maxwell’s equations can be used to describe the scattering of light from such spherical nanoparticles.9,10 Increased scattering and absorption properties of nanostructures for incident light provides high sensitivity to the changes in local dielectric environment, which is observed as shifts in resonance wavelengths, and it can be used as a transducer mechanism for biosensors.
Localized or surface plasmon resonance sensors both depend on the same sensing principle, which is the measurement of adsorbate-molecule-induced minute refractive index changes in the area within the decaying length of the plasmon’s electromagnetic field. Two important factors that have to be taken into account when comparing SPR sensors and LSPR sensors for biosensor applications are their refractive index sensitivities and electromagnetic field decay lengths. In terms of refractive index sensitivity, SPR sensors (∼2 × 10⁶RIU−1) are superior to LSPR sensors (∼2 × 10²RIU−1). However, that does not make LSPR sensors less sensitive than SPR sensors, because LSPR sensors have a shorter tunable electromagnetic decay length (around 5 to 15 nm) compared with SPR sensors (approximately 200 to 300 nm). LSPR sensors require smaller areas (or even a single molecule) for sensing than SPR sensors do. There is no need for temperature control in LSPR sensors, whereas SPR sensors are susceptible to temperature changes because of their high refractive index sensitivity. Unlike SPR sensors, LSPR sensors do not require a cou-pling mechanism like a prism or a grating on the surface. Overall, the LSPR mechanism seems to be suitable for making portable and easy-to-use sensors. Additionally, SPR sensors have been in the commercial market for over 20 years, but LSPR systems are able to offer sensor applications with comparably lower cost.11
There are various ways to fabricate nanostructures for LSPR studies. All of them have their advantages and disadvantages. Chemical synthesis methods enable one to prepare nanostructures inexpensively in large quantities and concentrations without extensive efforts and complex pro-cesses, but it gives quite limited control over the geometrical properties of these structures. The ability to engineer desired nanostructures for LSPR applications is important as the resonance wavelength, the amount of resonance wavelength shift due to the change of the local refractive index, maximum achievable sensitivity, and such other important properties of the LSPR system are related to the materials used, the size and shape of the nanoparticles,12–17and the period of the
structure array.18,19Lithographic techniques provide precise control over those structure details despite being more expensive and more time consuming. In our work, we used the electron beam lithography technique, which is a sophisticated nanoengineering tool and provides a great ability to control parameters such as size, shape, and periodicity.20Although this reported work is our first step through to potential practical applications, this ability of thoroughly engineering the nanostructures will be important for the optimization of this transducer mechanism in actual, specific biosensor applications.
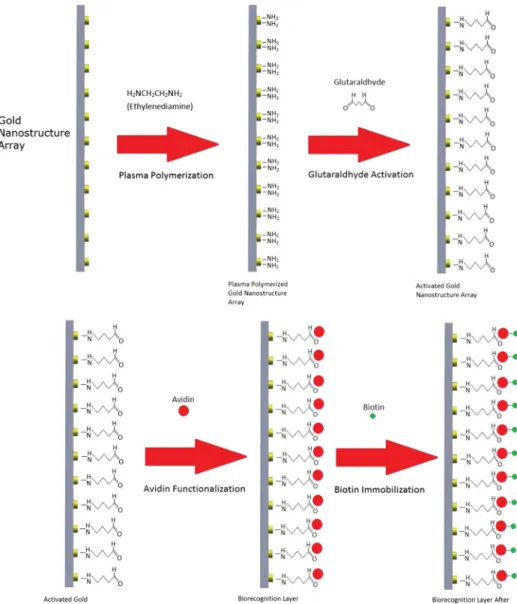
To be able to utilize the LSPR mechanism as a transducer, a selective biological recognition layer needs to be formed over nanostructures depending on the targeted agent. Usually, this requires using intermediate layers such as a cross-linker or some other monolayer to support the recognizer element. In our case, we used the plasma polymerization technique to activate the surface with amine groups using ethylenediamine (EDA) as the precursor. Plasma poly-merization is a method for the formation of polymeric materials under the influence of a gen-erated plasma.21It has became a promising alternative to wet chemistry methods by providing advantages in terms of safety, uniformity, reproducibility, and a wide range of applicable reagent gasses.22,23 EDA acted as a primary layer for glutaraldehyde binding to the surface. Glutaraldehyde having two carboxyl groups at each end of its molecule serves as an amine-reactive homobifunctional cross-linker. In our study, it cross-linked the EDA (having amine groups) to the avidin, which was subsequently added following glutaraldehyde modification. Avidin with its amine groups is capable of binding to the free carboxyl group located at the other end of glutaraldehyde. As a last step, biotin was added and reacted with avidin on the surface via the well-known avidin-biotin interactions. LSPR measurements were taken at each step of modification to observe any wavelength shifts related to the binding of the mentioned molecules.
This work combined nanofabrication and surface modification efforts to develop a LSPR based nano transducer. Plasma polymerization was proposed as a novel approach for surface preparation of such nanostructured transducers and was applied successfully.
2 Materials and Methods
2.1 Materials
Ethylenediamine was obtained from AppliChem (St. Louis, Missouri, USA). Glutaraldehyde (25% v∕v in water) was obtained from MERCK (Hohenbrunn,Germany). The sapphire sub-strates were obtained from Kyocera (Japan). PMMA950K electron beam resist was supplied from Micro Resist Technology GmbH (Berlin, Germany). The stock solution of glutaraldehyde was diluted by tenfold, obtaining a 2.5% v∕v glutaraldehyde solution in water and used in surface activation. Avidin, from egg white and phosphate buffered saline (PBS) solution, at pH 7.4 as a 10X stock solution concentrate were supplied from Sigma (St. Louis, MO). 10X stock solution of PBS was diluted to 1X solution (0.154 M NaCl, pH 7.4) in deionized water. Biotin was supplied from Sigma Aldrich (St. Louis, MO). All aqueous solutions used for the experiments were filtered before use through 0.2 μM K Minisartfi NML filter from Sartorius Stedim Biotech (Aubagne, France). aquaSave was obtained from Mitsubishi Rayon America Inc. (New York, USA).
2.2 Nanofabrication of Gold Nanostructures
Nanostructures were fabricated over sapphire substrates. PMMA 950 K electron beam resist was spin coated on the samples. Resist thickness was approximately 180 nm. Hardbake was done at 180°C for 90 s. A water-soluble conducting polymer, commercially known as aquaSAVE, was also spin-coated at 4000 RPM for 40 s on top of the resist layer to prevent charging during the electron beam exposure. We used the e_LiNE plus system (Raith GmbH, Dortmund, Germany) for the electron beam lithography. Acceleration voltage was 10 kV. A 20-μm aperture was used and the beam current was around 90 pA. Write-field (minimum exposure area without stitching) was 100μm2. Targeted nanostructure diameter and period was 100 and 300 nm, respectively. Dot exposure mode was used and the exposure dose was 0.04 pC for this composition, which was previously specified by dose tests. After the electron beam lithography, aquaSAVE layer was cleaned with DI water. Resist layer was developed by MIBK:IPA (1:3) developer for 40 s and iso-propanol was used as stopper for 30 s. Gold metal coating of 50 nm was done by the electron beam evaporation method, with a Leybold Univex 350 system. A nanostructure array was finally formed after the subsequent lift-off process as periodically positioned gold nanodisks.
2.3 Surface Modification
The gold nanostructure array surface was modified using the following procedure (Fig.1). In the first step, EDA was used as the monomer to incorporate amino groups on the gold nanostructure array surface via plasma polymerization. The EDA modified surfaces will be referred to as Plzp-EDA gold nanostructure surfaces in figures. For this purpose, LF-/-RF-plasma equipment (PICO, Diener Electronics GmbH þ Co, Germany) was used. The plasma polymerization system was described in detail elsewhere.24Monomers containing a–NH2–moiety are generally
preferred for the surface modification by the plasma polymerization technique for further pur-poses. In this study, EDA was chosen for its desirable properties such as low price, high polarity, and low vapor pressure (10 mm Hg at 25°C).
The plasma chamber was a stainless-steel cylindrical tube (150 mm radius, 320 mm length). A 13.6-MHz radio-frequency (RF) generator (power range 0 to 100 W) was used to sustain the plasma in the reactor. The plasma process was generated in the fully enclosed and semi-automatic system. In a typical glow-discharge treatment, gold nanostructure arrays were placed on the ground electrode in the middle of the reactor. The distance between the powered electrode and the top of the substrate surface was 4 cm. At plasma generation, low pressure was created in a recipient by means of a vacuum pump (Trivac, Germany). Power loss was minimized by means of a matching network. Different plasma parameters (discharge power 30 to 60 W and plasma generation times 15 to 30 min) on gold nanostructure arrays were tested for determining the optimum parameters for EDA immobilization on the gold nanostructure surfaces. Plasma power and the exposure time were optimized by measuring the x-ray photoelectron spectra.
The functional groups of EDA on the gold nanostructure surfaces were best characterized by x-ray photoelectron spectroscopy (XPS) when 30-W, 15-min plasma parameters were used. Therefore, these parameters were chosen and used for the further stages of surface modification. At a pressure of 0.2 mbar, the EDA monomer vapor was fed into the chamber for 20 min. Then RF power and the plasma-generation time was adjusted to 30 W and 15 min, respectively; the gold nanostructure array surface was exposed to glow discharge. At the end of the process, the RF generator turned off automatically, and the monomer inlet was closed manually. The plasma system was fed with argon gas for 10 min to quench the potential radicals, which might be formed during plasma. Finally, it was subjected to 0.1-mbar vacuum pressure for 15 min. Argon feeding and vacuum conditions were applied to deactivate remaining free radicals in the plasma atmosphere. Following surface modification by plasma polymerization, a 2.5% v∕v glutaraldehyde solution in water was added to the surface and incubated at 25°C for 4 h. The samples were then rinsed with deionized water for 1 min to remove any non-specific bindings. Avidin was then added to the surface at a concentration of 0.2 mg∕ml and incubated at 25°C for 3 h. The wash step performed after glutaraldehyde modification was repeated. As the last step, 2μM Biotin was added and reacted with avidin on the surface via the well-known avidin-biotin interactions.25,26LSPR measurements were taken at each step of the modification in order to observe any wavelength shifts related to the binding of the mentioned molecules.
2.4 X-Ray Photoelectron Spectroscopy
X-ray photoelectron spectroscopy was used for surface characterization following EDA mod-ification. XPS measurements were performed on a Kα instrument (Thermo Scientific, USA) using a monochromatic Al x-ray source with a spot size of 300μm. XPS spectra (N 1s, C 1s) with a pass energy of 30 eV were acquired for EDA modified samples using different plasma parameters (discharge power 30 to 60 W and plasma generation times 15 to 30 min). The total acquisition time and number of scans for each measurement were 90.5 s and 10 s, respectively.
2.5 LSPR Measurements
Transmission measurements were taken by using unpolarized white light from a xenon source with a fiber coupled vis-NIR spectrometer (Ocean Optics USB4000), multimode fibers, objec-tives to collimate and focus the light and other optomechanical components, such as a sample holder and positioning stages.27
3 Results and Discussion
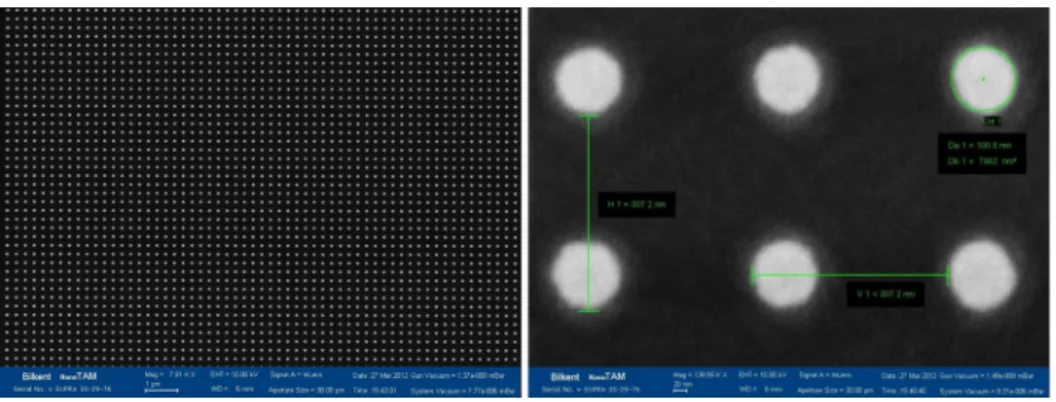
Gold nanostructure arrays were successfully fabricated over sapphire substrates by employing electron beam lithography and electron beam evaporation. After the inspection of nanofabricated samples with scanning electron microscopy (SEM), plasma polymerization and wet chemistry techniques were applied successfully in order to functionalize gold nanostructure surfaces. Plasma polymerization was used to modify the surface with EDA and surface characterization was performed using XPS as the analysis tool. Resonance signals arising from the localized surface plasmons that were formed in the metal-dielectric interface over the nanostructures as a result of the excitation by a white light were observed in the transmission spectra.
3.1 Scanning Electron Microscopy Inspection
SEM inspections showed that the desired geometry, nanostructure size, and period values were satisfied (Fig.2). The samples were also characterized optically by measuring their resonance wavelength values with transmission spectroscopy. As the material used was gold, we have obtained a resonance frequency in the visible spectrum, which was around 690 nm (Fig. 3).
3.2 XPS Measurements
XPS is a commonly used technique for surface characterization. In this study, this technique was used for the characterization of Plzp-EDA gold nanostructure arrays, where different plasma parameters were used for immobilizing EDA, which were 60 W for 15 min, 60 W for 30 min, 30 W for 15 min, and 30 W for 30 min. The surface characterization results for each case were compared for determining the optimum parameters for EDA immobilization on the gold nano-structure surfaces. The C 1s and N 1s spectra for each four cases of EDA modification are shown
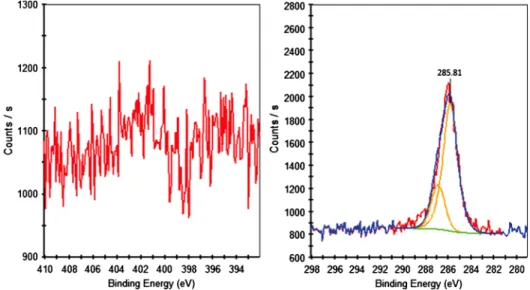
in Figs.3 to7. The expected carbon and nitrogen chemical species of EDA in C 1s and N 1s spectra are C-H, C-N and N-C, C-N, N-H, respectively. Since carbon species can originate from any source of contamination, N 1s spectra were taken as well for complementary results for C 1s spectra. The results of XPS were evaluated based on the references given elsewhere (www .lasurface.com). For 60 W, 15 min EDA modification, the N1s spectrum was shown to be noisy, and, therefore, complementary results for C1s could not be obtained (Fig. 4). For all the other parameters tested for surface modification, N 1s peak binding energy was observed 400.7 to 401.1 eV, thereby indicating the presence of C-N species on the surface, although there was a slight shift (∼1 eV) in the peak binding energy of this species for 30 W 15 min EDA modification (Table 1, Figs. 3, 5 and 6). This could be due to a small amount of charging of the surfaces when this parameter is used. C 1s peak binding energy of C-N species is observed at either 285.7 eV28or 288.1 eV.29Our results showed that the C1s spectrum indicated the pre-sence of C-N species on the EDA modified surfaces for all the tested parameters with a slight shift in the binding energy (0.2 to 0.9 eV) (Table1, Figs.3,5and6). Therefore, the presence of C-N functional groups was confirmed by both C 1s and N 1s spectra. The percentage of each chemical species in C 1s and N 1s spectra are shown in Table2. For all the tested parameters, the
Fig. 3 C1s and N 1s spectra of Plzp-EDA modified gold nanostructure surfaces by using plasma parameters of 30 W, 15 min.
Fig. 4 C1s and N 1s spectra of Plzp-EDA modified gold nanostructure surfaces by using plasma parameters of 60 W, 15 min.
percentage of the C-N species in C 1s spectra was calculated as 77 to 85%. Bare gold nano-structure surface had 10.5% of C-N species, which could be resulting from environmental car-bon. Yet the comparison between the modified surfaces and bare gold nanostructure surface shows that the modified surfaces have a substantial amount of C-N species compared with bare gold nanostructure surface, clearly indicating the presence of C-N species due to surface functionalization. As for the N 1s spectra, C-N chemical species subsists as a single peak (100%) for all the tested parameters except for the 60 W 15 min EDA modification (Fig.4, Table2). As expected, no N 1s spectrum could be obtained for bare gold nanostructure surface, indicating that no nitrogen chemical species existed for the unmodified surface (Fig.7). This result provided further evidence that the peak observed 400.7 to 401.1 eV in the N1s spectra of the modified surfaces, was representing the C-N species.
The EDA surface modification by plasma polymerization was repeated using the plasma parameters 60 W 30 min, 30 W 15 min. In each case of modification, it was worked in parallels in order to obtain reproducible results. The best spectra obtained from each parallel are displayed in Figs.8and9. The percentage of each chemical species in the C 1s and N 1s spectra are shown
Fig. 5 C1s and N 1s spectra of Plzp-EDA modified gold nanostructure surfaces by using plasma parameters of 60 W, 30 min.
Fig. 6 C1s and N 1s spectra of Plzp-EDA modified gold nanostructure surfaces by using plasma parameters of 30 W, 30 min.
in Table3. For one of the 60 W 30 min EDA modifications, the percentage of the C-N chemical species observed in the C 1s spectra was calculated as 71.6%. Although the amount of C-N species was 13% lower compared with the previous results, the amount of this chemical species was still substantial compared to a bare gold nanostructure surface. The N1s spectrum was shown to be noisy, and, therefore, complementary results for C1s could not be obtained (data not shown). For the other sample modified with the same plasma parameters (60 W
Fig. 7 C1s and N 1s spectra of Plzp-EDA modified bare gold nanostructure surfaces.
Table 1 Presence of carbon and nitrogen species in C 1s and N 1s spectra of EDA modification using different plasma parameters.
Plasma parameters
C1s N1s
C-H (285 eV) C-N (285.8 eV, 288.1 eV) C-N (400.7 eV, 401.1 eV) N-H (400.2 eV)
60 W, 15 min — 285.81 ND (noisy) ND (noisy)
60 W, 30 min — 286.04 400.98 ND (noisy)
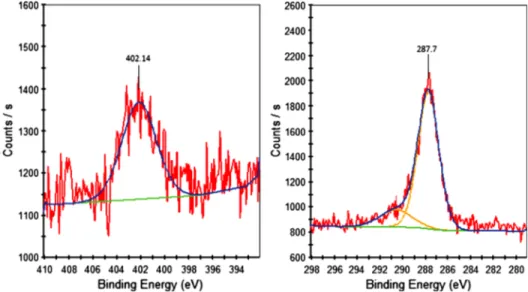
30 W, 15 min — 287.70 402.14
30 W, 30 min — 286.70 401.69
Table 2 Percentage of carbon and nitrogen species in C 1s and N 1s spectra of EDA modification using different plasma parameters.
Percentage
C1s N1s
C-H C-N C-N N-H
60 W, 15 min — 77.3 ND (noisy) ND (noisy)
60 W, 30 min — 84.8 100 ND (noisy)
30 W, 15 min — 84.0 100 ND (noisy)
30 W, 30 min — 84.2 100 ND (noisy)
Fig. 8 C1s and N 1s spectra of Plzp-EDA modified gold nanostructure surfaces by using plasma parameters of 60 W, 30 min.
Fig. 9 C1s and N 1s spectra of Plzp-EDA modified gold nanostructure surfaces by using plasma parameters of 30 W, 15 min.
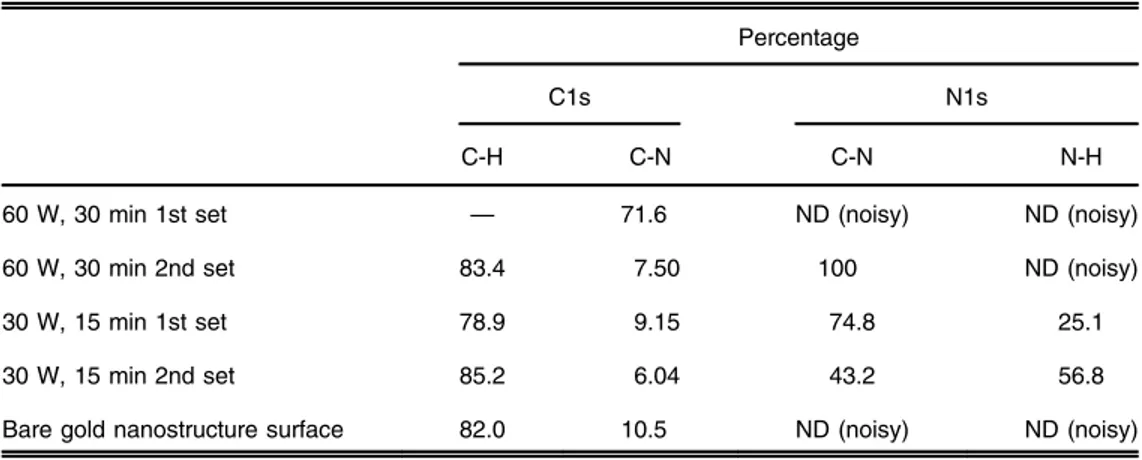
Table 3 Percentage of carbon and nitrogen species in the C 1s and N 1s spectra of EDA modification using 60 W, 30 min and 30 W, 15 min plasma parameters.
Percentage
C1s N1s
C-H C-N C-N N-H
60 W, 30 min 1st set — 71.6 ND (noisy) ND (noisy)
60 W, 30 min 2nd set 83.4 7.50 100 ND (noisy)
30 W, 15 min 1st set 78.9 9.15 74.8 25.1
30 W, 15 min 2nd set 85.2 6.04 43.2 56.8
30 min), although the percentage of C-N species was low in C 1s spectrum (7.5%), C-N species observed in N 1s spectrum existed as a single peak and, therefore, supported the existence of this chemical species (Fig.8, Table3). The results for the 30-W 15-min parallels were more coherent, compared with 60-W 30-min parallels. The C 1s spectrum of both of the samples modified using the 30-W 15-min plasma parameters, showed the existence of the C-N species. Even though the percentage of the C-N species in C 1s spectra was low in both samples (9.15%, 6.04%), the C-N species in N 1s spectrum was calculated as 74.8 and 43.2%, respectively, and supported the existence of the C-N species (Table3). Once again, when the N 1s spectrum of the modified surfaces was compared with a bare gold nanostructure surface, no nitrogen chemical species existed for the unmodified surface. In addition to the C-N species, the N-H species in N 1s spectra was observed (Fig.9, Table3). Although the peak binding energy for the N-H chemical species (399.2 eV), and C-N chemical species (400.2 eV) are close to each other, and the peak binding energies may overlap; these peaks relating to these chemical species can be observed as two separate peaks. This case was shown by a group study, where the polysulfone membranes were modified using n-butylamine and allyamine polymers.30Since the N-H species also existed in both of the EDA modified samples using 30 W 15 min, these plasma parameters were chosen for EDA modification by plasma polymerization before chemical activation by glutaraldehyde. The presence of the N-H species is especially important for binding to the carboxyl group of glutaraldehyde, which was used for further chemical modification.
The existence of amine groups on the surface were validated by these XPS measurements that proved the success of plasma polymerization in the surface modification process. Afterward, glutaraldehyde and the following modification steps mentioned in the Sec. 2
were performed.
3.3 LSPR Response to Surface Modification
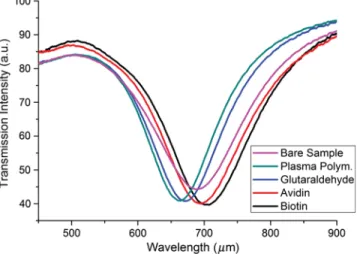
We took the transmission spectrum measurements for every modification step and a shift in the resonance wavelength due to the chemical binding induced changes in the dielectric properties of the nanostructure arrays’ surrounding medium have been repeatedly detected, which proves the usability of this transducer as a biosensing platform. Spectral response was a red-shift as expected, except for the initial plasma polymerization step, for which we have seen a blue-shift. We believe this to be due to the slight etching of nanodisks during the plasma process, which may lead to the reshaping of the nanodisks and a minute changes in their thicknesses. Figure10
shows the transmission measurements of a nanostructure array with a nanodisk radius of 100 nm, a period of 300 nm, and a gold thickness of 50 nm. Resonance wavelength shift was 26 nm after plasma polymerization, 9 nm after glutaraldehyde functionalization, 24 nm after avidin functionalization, and 12 nm after biotin binding.
Fig. 10 Transmission spectra of gold nanostructure array after each step of surface modification and biotin recognition.
4 Conclusions
Combining LSPR phenomenon as a transducer mechanism together with plasma-polymerization-assisted surface modification for biosensor applications were successfully demonstrated in this study. The plasma polymerization process was optimized, tested, and analyzed with XPS mea-surements. We were able to detect the LSPR resonance wavelength shift resulting from each successive surface functionalization step, which proved the applicability of this system as a biosensor.
Sensitivity measurements require testing the transducer to be immersed in ambients with known refractive indexes. Our transmission setup is not mature enough yet for such a measure-ment. Future work will be focused on detailed characterization and optimization of this trans-ducer. It will include integrating a flow cell to our transmission setup to determine sensitivity, figure of merit and detection limit values. This will also give us the ability to make real time sensing for various materials.
Acknowledgments
This work is supported by the projects DPT-HAMIT, ESF-EPIGRAT, EU-N4E, NATO-SET-181, and TUBITAK under Project Nos., 107A004, 107A012, 109E301. One of the authors (E.O.) also acknowledges partial support from the Turkish Academy of Sciences. All of the authors have made significant contributions to this study. Mr. Adil Burak Turhan worked on nanofabrication and performed optical measurements. Mr. Yasin Sen, Ms. Demet Ataman, and Mr. Adil Burak Turhan did the plasma polymerization process. Ms. Demet Ataman worked on wet chemistry, made XPS measurements and evaluated results. Mr. Adil Burak Turhan and Ms. Demet Ataman wrote the manuscript. Study was supervised and directed by Professor Mehmet Mutlu and Professor Ekmel Özbay.
References
1. C. R. Yonzon et al.,“A comparative analysis of localized and propagating surface plasmon resonance sensors: the binding of concanavalin a to a monosaccharide functionalized self-assembled monolayer,” J. Am. Chem. Soc. 126(39), 12669–12676 (2004),http://dx.doi.org/ 10.1021/ja047118q.
2. A. J. Haes et al.,“A localized surface plasmon resonance biosensor: first steps toward an assay for Alzheimer's disease,” Nano Lett. 4(6), 1029–1034 (2004), http://dx.doi.org/10 .1021/nl049670j.
3. A. J. Haes et al., “Detection of a biomarker for Alzheimer's disease from synthetic and clinical samples using a nanoscale optical biosensor,” J. Am. Chem. Soc. 127(7), 2264–2271 (2005),http://dx.doi.org/10.1021/ja044087q.
4. M. P. Kreuzer et al., “Quantitative detection of doping substances by a localised surface plasmon sensor,” Biosens. Bioelectron. 21(7), 1345–1349 (2006), http://dx.doi.org/10 .1016/j.bios.2005.04.019.
5. M. Vestergaard et al.,“Detection of Alzheimer’s tau protein using localised surface plasmon resonance-based immunochip,” Talanta 74(4), 1038–1042 (2008), http://dx.doi.org/10 .1016/j.talanta.2007.06.009.
6. E. Ozbay, “Plasmonics: merging photonics and electronics at nanoscale dimensions,” Science 311(5758), 189–93 (2006),http://dx.doi.org/10.1126/science.1114849.
7. K. A. Willets and R. P. Van Duyne,“Localized surface plasmon resonance spectroscopy and sensing,” Ann. Re. Phys. Chem. 58, 267–297 (2007), http://dx.doi.org/10.1146/annurev .physchem.58.032806.104607.
8. J. N. Anker et al.,“Biosensing with plasmonic nanosensors,” Nat. Mater. 7(6), 442–453 (2008),http://dx.doi.org/10.1038/nmat2162.
9. C. F. Bohren and D. R. Huffman, Absorption and scattering of light from small particles, Wiley, New York (1983).
10. V. M. Kreibig U, Cluster Materials, Springer, Berlin Heidelberg, New York, p. 532 (1995).
11. A. J. Haes and R. P. Van Duyne, “A unified view of propagating and localized surface plasmon resonance biosensors,” Anal. Bioanal. Chem. 379(7–8), 920–930 (2004),http:// dx.doi.org/10.1007/s00216-004-2708-9.
12. J. N. Anker et al.,“Biosensing with plasmonic nanosensors,” Nat. Mater. 7(6), 442–453 (2008),http://dx.doi.org/10.1038/nmat2162.
13. A. D. McFarland and R. P. Van Duyne,“Single silver nanoparticles as real-time optical sensors with zeptomole sensitivity,” Nano Lett. 3(8), 1057–1062 (2003), http://dx.doi .org/10.1021/nl034372s.
14. L. J. Sherry et al.,“Localized surface plasmon resonance spectroscopy of single silver nano-cubes,” Nano Lett. 5(10), 2034–2038 (2005), http://dx.doi.org/10.1021/nl0515753. 15. T. R. Jensen, C. L. Haynes, and R. P. Van Duyne,“Nanosphere lithography: tunable
loca-lized surface plasmon resonance spectra of silver nanoparticles,” J. Phys. Chem. B 104(45), 10549–10556 (2000), http://dx.doi.org/10.1021/jp002435e.
16. J. J. Mock et al.,“Shape effects in plasmon resonance of individual colloidal silver nano-particles,” J. Chem. Phys. 116(15), 6755–6760 (2002),http://dx.doi.org/10.1063/1.1462610. 17. J. J. Mock and S. Schultz,“Local refractive index dependence of plasmon resonance spectra from individual nanoparticles,” Nano Lett. 3(4), 485–491 (2003),http://dx.doi.org/10.1021/ nl0340475.
18. W. Rechberger et al., “Optical properties of two interacting gold nanoparticles,” Optics Commun. 220(1–3), 137–141 (2003),http://dx.doi.org/10.1016/S0030-4018(03)01357-9. 19. K. H. Su et al.,“Interparticle coupling effects on plasmon resonances of nanogold particles,”
Nano Lett. 3(8), 1087–1090 (2003),http://dx.doi.org/10.1021/nl034197f.
20. G. Barbillon et al.,“Electron beam lithography designed chemical nanosensors based on localized surface plasmon resonance,” Surf. Sci. 601, 5057–5061 (2007),http://dx.doi.org/ 10.1016/j.susc.2007.09.005.
21. M. T. van Os,“Surface modification by plasma polymerization: film deposition, tailoring of surface properties and biocompatibility,” Ph.D. Thesis, Universiteit Twente (2000). 22. H. A. Gülec and M. Mutlu,“Modification of food contacting surfaces by plasma
polymer-isation technique. Part I: determination of hydrophilicity, hydrophobicity and surface free energy by contact angle method,” J. Food Engin. 75(2), 187–195 (2006),http://dx.doi.org/ 10.1016/j.jfoodeng.2005.04.007.
23. Y. Sen and M. Mutlu,“Plasma processing of materials for biotechnological applications,” Curr. Opin. Biotechnol. 22, 63 (2011),http://dx.doi.org/10.1016/j.copbio.2011.05.178. 24. Y.Şen, H. A. Güleç, and M. Mutlu, “Modification of food-contacting surfaces by plasma
polymerization technique: reducing the biofouling of microorganisms on stainless steel sur-face,” Food Bioprocess Technol. 5, 166–175 (2012),http://dx.doi.org/10.1007/s11947-009 -0248-1.
25. K. E. Nelson et al.,“Surface characterization of mixed self-assembled monolayers designed for streptavidin immobilization,” Langmuir 17(9), 2807–2816 (2001),http://dx.doi.org/10 .1021/la001111e.
26. D. E. Hyre et al., “Cooperative hydrogen bond interactions in the streptavidin-biotin system,” Protein Sci. 15 (3), 459–467 (2006),http://dx.doi.org/10.1110/ps.051970306. 27. N. A. Cinel, S. Butun, and E. Ozbay,“Electron beam lithography designed silver nano-disks
used as label free nano-biosensors based on localized surface plasmon resonance,” Opt. Express 20(3), 2587–2597 (2012),http://dx.doi.org/10.1364/OE.20.002587.
28. S. Delpeux et al., “Fullerene core star-like polymers-1. Preparation from fullerenes and monoazidopolyehers,” Eur. Polym. J. 34(7), 905–915 (1998), http://dx.doi.org/10.1016/ S0014-3057(97)00225-5.
29. G. Lempérière et al.,“Characterisation of TiN coatings and of TiN/Si interface by x-ray photoelectron spectroscopy and Auger electron spectroscopy,” Appl. Surf. Sci. 68(4), 595–603 (1993), http://dx.doi.org/10.1016/0169-4332(93)90241-3.
30. I. Gancarz et al.,“Modification of polysulfone membranes 5. Effect of n-butylamine and allylamine plasma,” Euro. Poly. J. 38, 1937–1946 (2002),http://dx.doi.org/10.1016/S0014 -3057(02)00093-9.