y-\ ' ' Г
A SOCIAL ACCOUNTING MATRIX MULTIPLIER ANALYSIS OF THE EFFECTS OF AGRICULTURAL SUPPORT POLICIES: THE CASE OF US
A Thesis
Submitted to the Department of Economics and the Institute o f Economics and Social Sciences o f
Bilkent University
In Partial Fulfillment o f the Requirements for the Degree o f
MASTER OF ARTS IN ECONOMICS
by
Ela Tin September 1997
н о
•TSé
і а э ?Copyright by Ela Tin
I certify that I have read this thesis and in my opinion it is fully adequate in scope and
in quality as a thesis for the degree o f Master o f Arts in Economies.
Assistant Professor Dr. Serdar Sayan
I certify that I have read this thesis and in my opinion it is fully adequate in seope and in quality as a thesis for the degree o f M aster o f Arts in Economics.
Assistant Professor Dr. Kivileim Metin
I certify that I have read this thesis and in my opinion it is fully adequate in scope and
in quality as a thesis for the degree o f Master o f Arts in Economics.
Assistant Professor Dr. Bahri Yılmaz
ABSTRACT
A SOCIAL ACCOUNTING MATRIX MULTIPLIER ANALYSIS OF THE EFFECTS OF AGRICULTURAL POLICIES: THE CASE OF US
ELA TIN MA in Economics
Supervisor: Assistant Professor Dr. Serdar Sayan September 1997
This study investigates the economywide effects o f agricultural support policies in the US, with special reference to changes required by the Uruguay Round Agreement on Agriculture. For this purpose, the relevant multipliers are derived using a Social Accounting Matrix (SAMs) framework that is known to be capable o f describing certain structural features o f an economy by capturing the interactions between various micro and macro accounts. Following a discussion on their theoretical derivation and decomposition, SAM multipliers are computed at two different levels o f aggregation, and are used to investigate the effects o f a switch to decoupled support to US farming on the US economy.
Key W ords: Social Accounting Matrix (SAM), SAM Multipliers, Support Policies, Uruguay Round.
Ö Z E T
TARIMSAL DESTEK POLİTİKALARININ ETKİLERİNİN
SOSYAL HESAPLAR MATRİSİ ÇARPANLARI İLE ANALİZİ: A.B.D.’DEKİ DURUM ÜZERİNE BİR ÇALIŞMA
ELA TİN
Yüksek Lisans Tezi, iktisat Bölümü
Tez D anışm anı: Yardımcı Doçent Dr. Serdar Sayan Eylül 1997
Bu çalışma, Uruguay Round Anlaşması çerçevesinde değişikliğe uğrayan tarımsal destek politikalarının tüm ekonomi üzerindeki etkilerini araştırmaktadır. Bu amaçla, ekonominin belli başlı yapısal özelliklerini açıklayan ve çeşitli mikro ve makro hesaplar arasındaki etkileşimleri gösteren Sosyal Hesaplar Matris çarpanlan (SHM) kullanılmaktadır. SHM çarpanlarının, teorik çıkarımını ve ayrıştırılmalarmı takiben. Amerikan tarımında, üretim kararlarını etkilemeyen destek politikalarına geçişin ekonomi üzerindeki etkileri bu çarpanlar kullanılarak İncelenmektedir.
A n a h tar Kelim eler: Sosyal Hesaplar Matrisi (SHM), SHM Çarpanları, Destek Politikaları, Uruguay Round.
To Tomris Erbaş She knows why...
A cknow ledgm ents
I would like to express my gratitude, first and foremost, to Assistant Professor Dr.
Serdar Sayan for providing me with the necessary background I needed to complete this study and the invaluable support and supervision he provided during the entire course o f this study. I also would like to thank Professor Gazi Özhan o f Ankara University for his detailed, comments on an earlier draft o f Chapter 3, and for the papers he brought to my attention. Drs. Kıvılcım Metin and Bahri Yılmaz provided comments which I benefited a great deal.
It would have been really difficult for me to submit this thesis on time without editing and typing support o f Eda Tin, my sister, and the technical assistance o f Ali Şafak. The help they offered is gratefully acknowledged.
Finally, I am grateful to my parents for the understanding, patience and moral support they provided on a continuous basis during the time I wrote this thesis.
TABLE OF CONTENTS
ACKNOW LEDGEM ENTS... vi
LIST OF T A B L E S... viii
C H A PT E R ... p a g e 1. INTRODUCTION... 1
2. A BRIEF SURVEY OF SAM LITERATURE... 5
3. DERIVATION OF SAM M ULTIPLIERS... 12
Introduction... 12
Computation o f SAM M ultipliers... 13
Decomposition o f SAM M ultipliers... 19
4. A SAM MULTIPLIER ANALYSIS FOR AGRICULTURAL SUPPORT POLICIES IN THE U S ... 25
Computation o f SAM Multipliers for the US Econom y... 25
Multipliers from an Aggregated SAM for the U S ... 25
Multipliers from a Disaggregated SAM for the U S ... 28
The Simulation Experim ent... 31
5. CONCLUSIONS... 48
LIST OF REFERENCES... 52
LIST OF TABLES
TABLE PAGE
1. A Macroeconomic Social Accounting M atrix ... 14
2. The Column Normalized S A M ... 16
3. Accounting Balance E quations... 17
4. US SAM 1986 ... 26
5. Aggregated SAM Multipliers for the U S ... 27
6. Transfer M ultipliers... 27
7. Open-Loop M ultipliers... 28
8. Closed-Loop M ultipliers... 28
9. A Disaggregated Social Accounting Matrix for the US, 1986 ... 29
10. 1986 Disaggregated SAM Multipliers for the U S ... 32
11. Transfer Multipliers o f the Disaggregated SAM for the US, 1986 ... 33
12. Open-Loop Multipliers o f the Disaggregated SAM for the US, 1986 ... 34
13. Closed-Loop Multipliers o f the Disaggregated SAM for the US, 1986... 35
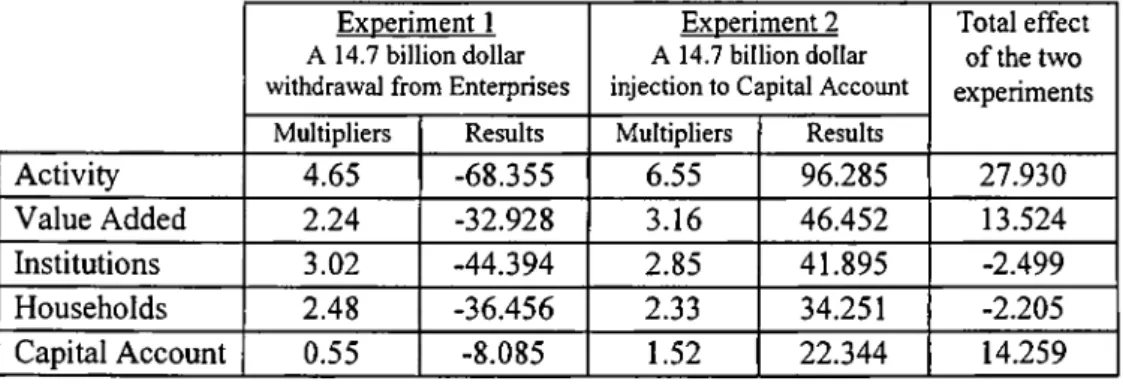
14. Experiments 1 and 2 with Aggregated SAM M ultipliers... 38
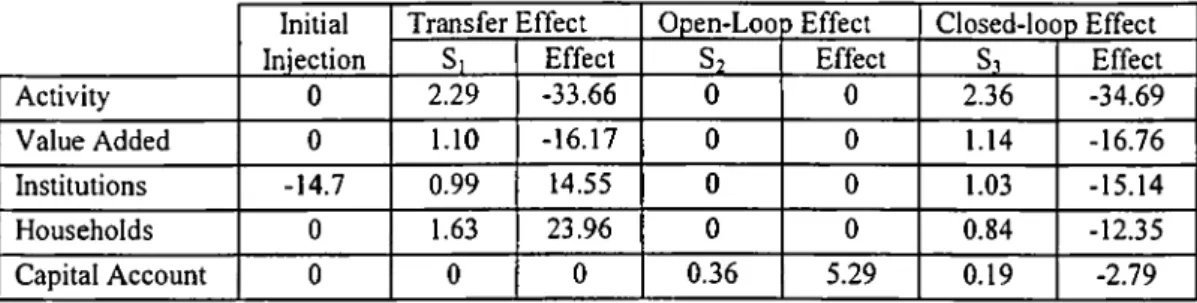
15. Experiment 1 with Additively Decomposed Aggregate SAM Multipliers 39 16. Experiment 2 with Additively Decomposed Aggregate SAM Multipliers 39 17. Experiments 1 and 2 with Disaggregated SAM M ultipliers... 40
18. Experiment 1 with Additively Decomposed Disaggregated SAM M ultipliers... 43
19. Experiment 2 with Additively Decomposed Disaggregated SAM M ultipliers... 44
C H A P T E R 1 Introduction
The effects of agricultural support policies can be investigated within different
analytical frameworks. The partial equilibrium framework is useful for an analysis of these effects at a disaggregated (even at the commodity) level.' As it isolates the sector in question from the rest of the economy, however, partial equilibrium analysis fails to capture the effects spreading from the supported sector to the others. Nor could it be used to analyze the effects of support spending on macro balances. A widely used alternative for the analysis of economywide effects of agricultural support is provided by Computable General Equilibrium (CGE) framework.^ CGE models are capable of describing the impact of agricultural support policies not only on the sector receiving support but also on other sectors and on major macro
balances. The multipliers derived from Social Accounting Matrices (SAMs) could also be used for this purpose, and despite certain disadvantages they have over CGE models, SAM multipliers are considerably easier to obtain. These multipliers are
capable, in particular, of describing certain structural features of an economy and can show the interactions between various micro and macro accounts in the economy. They totally lack the power, however, of revealing the effects of support policy-
induced changes in relative prices, as they, by construction, are unable to address these effects. It is, in fact, this inability of SAMs that led to the decline in the
' For a survey, see Gardner (1992). ^ See Hertel (1997) for a survey.
popularity of SAM modeling in agricultural liberalization literature. SAM multipliers could not capture the effects of changing relative prices on sectoral resource allocation and non-linear substitution possibilities between the factors of production
(Hertel, 1986) and SAM based multiplier analyses were replaced by CGE analyses in a relatively short period of time. Even though the advances in computing technology
made CGE models increasingly popular tools of agricultural policy analysis, many CGE studies on economywide effects of agricultural support in developed countries concluded that the relative price effects resulting even from a complete liberalization of agriculture would be relatively small due to the small GDP and employment shares of agricultural sectors in these countries (e.g., Kilkenny and Robinson, 1990; Kilkenny, 1993). In the light of this evidence, one would expect the deviation between results from CGE and SAM multiplier analyses of agricultural liberalization to be relatively small for developed countries as compared to developing countries where agriculture has a sizable share in GDP and employment, and a larger impact on overall relative price structure. Post-Uruguay Round developments concerning the changing nature of support policies are likely to reduce this deviation even further.
The signing of Uruguay Round Agreement on Agriculture brought about a change in the nature of conventional support policies that have previously been employed by
the countries signing the Agreement. The Agreement requires the elimination of price distorting supports and a general reduction of protection in agriculture. The levels of Aggregate Measures of Support (AMS) need to be reduced gradually,
relative to 1986-1988 averages set as the benchmark levels. Although it represented the first major step for a multilateral liberalization of agriculture, the Agreement
started a new tendency among countries towards a replacement of distortionary subsidies with decoupled payments as some decoupled payments satisfying certain criteria are exempt from AMS reduction requirements (Tangermann, 1996; Sayan,
1996).
Coupled with the conclusion that liberalization of developed country agricultures is
likely to cause only moderate changes in domestic relative price structures, the Uruguay Round-inspired switch to decoupled payments makes SAM multiplier analysis an attractive tool for the analysis of the effects of support spending once again. Given the considerable ease of implementation as compared to CGE models, SAM multipliers could efficiently be employed despite their major shortcoming of overlooking the effects of relative price changes.
The purpose of this thesis is to carry out a SAM multiplier analysis of the effects of decoupled support to US farming which may later be used to check the validity of
this idea by comparing the results to those from previously conducted CGE studies on the economywide effects of support to US agriculture. The plan of the thesis is as follows. Chapter 2 surveys the SAM literature. Theoretical derivation and
decomposition of SAM multipliers within a simple macro SAM structure are described in Chapter 3. The decomposition aims to provide detailed results for an inspection of SAM multiplier effects. Next, these theoretical results are used to
compute the aggregate and disaggregate SAM multipliers of the US economy in Chapter 4. Chapter 4 also discusses the relevance of results from policy experiments with both aggregated and disaggregated SAMs in the context of Uruguay Round
decisions. Finally, Chapter 5 summarizes the results and concludes the study with a general discussion of findings.
C H A P T E R 2
A Brief Survey of SAM Literature
A SAM is a square matrix which shows the flows o f expenditures and receipts among selected accounts of an economy in such a way to combine and reconcile input-output (10) and national income (N1) accounts for a given period. In addition to
being an accounting framework explicitly showing the linkages between sectoral 10 accounts and macroeonomic N1 aggregates, it has the potential to serve as a data
base, a tool for checking the consistency of CGE solutions, and as a modeling framework for linear multiplier analyses of the effects of exogenous shocks.
The idea of combining Input-Output and National Income accounts within the framework of a Social Accounting Matrix (SAM) was first suggested by Stone
(Stone, 1986).^
Following Stone’s original work, social accounting matrices have been widely used both as an accounting framework and a modeling tool for linear multiplier analyses in developing and developed countries alike. In addition to SAM applications that are reviewed in Pyatt and Round (1985), the SAM analysis of Pakistani agricultural
sector by Havinga (1987), and the work of Ozhan De Santis and (1995) using the
1990 SAM of Turkey can be cited as examples to SAM applications in developing country settings.'*
SAMs and multiplier analyses based on SAMs have been popular in developed
country set-ups including the US. Reinert and Roland-Holst (1992) construct a detailed SAM for the US which is composed of data on interindustry flows, value added, imports, and final demand for 487 production sectors using 1988 as a base year. This paper also describes the techniques for gathering updating data used in the construction of large-scale SAMs. Hanson and Robinson (1991) discuss the matching between a SAM and national income accounts for thé US, emphasizing the relations between policy issues, models and data. Noting the recent change in the nature of policy issues that are of interest to economists and the changing structure of models used to address these issues, the authors point to the need for flexible accounting frameworks that would serve to the needs of modelers, and praise SAMs as an appropriate framework for support policy modeling.
The list of topics studied using SAMs also includes economic growth (Pyatt and Round, 1985; Robinson, 1989), income distribution (Adelman and Robinson, 1978; Pyatt and Roe, 1977), fiscal policy analysis (Whalley and St. Hillaire, 1983 and
1987), and interactions between macroeconomic policy and structural adjustment (Robinson and Roland-Holst, 1988). Resently, Roland-Holst and Sancho (1995) used the SAM approach to aneilyze price formation and cost transmission mechanisms in
economies with institutional rigidities.
In addition, SAMs have been used as consistency checks and for calibration of parameters in CGE models which are used to investigate the effects of exogenous
shocks given through changes in tax policy, energy policy, environmental regulations as well as for an evaluation of the outcomes of trade and agricultural policy
liberalization. Comprehensive surveys of SAM-based CGE applications in these areas can be found in Robinson (1989), Shoven and Whalley (1984), Bergman (1988), and Hertel (1997). The role of SAMs in CGE modeling is best described in Derviş, de Meló and Robinson (1982), and Robinson, Kilkenny and Hanson (1990). Examples of the use of SAM-based CGE models for the analysis of agricultural policy issues can be found in OECD (1989-90), Robinson and Kilkenny (1990), Kilkenny (1993), Sayan (1996), and Güzel and Furtan (1996).
In fact, the analysis of the econom}wide effects of agricultural liberalization in developed countries could be argued to have steuted with SAM multiplier exercises such as the 1986 article by Adelman and Robinson where the authors used a SAM to examine the effects of various policies on US agriculture. Adelman and Robinson derived SAM multipliers to illustrate the changes in demand and institutional income caused by changes in government expenditures and exports. After decomposing these
multipliers to show the contribution of input-output and net SAM linkages in US economy, they concluded that the linkages from agriculture to the rest of the economy were substantially large, whereas the linkages from the rest of the economy
to agriculture were small. They mainly concentrated on trade and transfer experiments such as an increase in agricultural or manufacturing exports, an increase
in agricultural value added and an increase in household incomes, and pointed out the need for repeating such exercises using the CGE framework.^
Other than these empirical applications, a branch of SAM modeling literature focused on the derivation of SAM multipliers and their properties. In a 1988 paper,
Robinson and Roland-Holst compared SAM multipliers to marginal multipliers that are derived from a CGE model using the Jacobian matrix of partial derivatives at a given equilibrium. Following a comparison of analytical results from SAM and marginal CGE multipliers, Robinson and Roland-Holst (1988) illustrated the SAM- multiplier decomposition using a small CGE model of the US.
The SAM multiplier decomposition was also studied by Pyatt and Round (1979) using the multiplicative decomposition, and by Stone (1978) who used the additive form. Although both these forms are valid and of equal value. Stone’s additive decomposition is preferred in many studies as it is considered to provide a more descriptive way of presenting the results.
Defoumy and Thorbecke (1984) also worked on the decomposition of SAM multipliers through a technique introduced Crama, Defoumey and Gazon (1984). According to Defoumey and Thorbecke, SAM is a comprehensive data framework by which the transmission of the effects of shocks through the whole network can be
investigated. Based on this reasoning, they applied a stmctural path analysis within the SAM framework. Compared to the decomposition treatment in Stone (1978) and
^ Critical reviews of Adelman and Robinson (1986) can be found in Johnson (1986) and Hertel (1986).
Pyatt and Round (1979), their technique is a more detailed way to decompose multipliers.
The recent studies that use the SAM framework mostly concentrate on SAM multiplier decomposition to address the policy issues of interest. Among the studies
that can be cited as examples are Thorbecke and Jung (1996), Vogel (1994), Hasson (1994), Holst and Shiells (1993), Roland-Holst (1990),and Morrisson and Thorbecke (1990). Of these, Thorbecke and Jung (1996) is a study on a multiplier decomposition method focusing on poverty alleviation: The mechanisms and linkages by which a production sector contributes to poverty alleviation within a socioeconomic system represented by a SAM are shown by the decomposition of the multipliers. The multipliers are decomposed into two multiplicative components which incorporate the direct and indirect effects of sectoral output growth on poverty alleviation and the use of the technique is illustrated by an application to the case of Indonesia. Vogel (1994) investigates whether an agricultural-demand-led industrialization strategy is suitable by using forward and backward multipliers of the agricultural sectors. The decomposition o f the multipliers show the indirect contribution coming from households’ demand to agricultural production linkages. He concludes that the strength of these linkages make agricultural-demand-led industrialization a viable policy alternative for countries at low levels of development. Hassan (1994) analyzes the effects of the structural adjustment policies
of the 1980s in Sudan on growth and income distribution within a SAM framework. He claims that these policies were not neutral towards the productive sectors of the economy, but instead were biased towards agricultural sectors employing modem
irrigation techniques (largely capital-intensive and highly import-dependent industries). His SAM multiplier analysis indicates that these sectors have the weakest growth linkages in the economy and the smallest impact on household income
whereas traditional agriculture provides the strongest linkages and have the largest impact on every household income group.
In their study of social accounts and the structure of North American economy, Holst and Shiells (1993) construct a SAM for North America by integrating three macroeconomic SAMs into a single one, and after disaggregating this SAM into many sectors, they concentrate on the structure of North American receipts, payments and the regional decomposition of multipliers. Roland-Holst (1990) investigates the role of income-expenditure linkages in interindustry analysis. Using a SAM of the US and matrix decomposition methods, he shows that the multiplier estimates which omit such linkages are not reliable measures of the effects of exogenous shocks upon industrial output and income. This paper also uses a decomposition method to study relative income determination between sectors, that is, how the composition o f national product changes in response to exogenous
shocks.
Morrisson and Thorbecke (1990) offer a thorough definition of agricultural surplus based on a SAM framework. In order to estimate the magnitude of agricultural surplus and its agricultural and non-agricultural components, they use a SAM for
Indonesia.
Adelman, Taylor and Vogel (1987) use SAM multipliers to analyze the economic stmcture of a migrant-sending mral economy. They constmct the 1982 SAM for a major migrant-sending village in Central Mexico. Then, they use the multiplier
matrix to conduct policy experiments to observe the changes in production, value added, income and investment flows of the village. Their results emphasize the crucial role of internal and international migration in the village economy, as well as the importance o f anti-poverty policies directly targeted towards the landless.
C H A PT E R 3
Derivation of SAM Multipliers
3.1. Introduction
The level of aggregation used in the analysis of economywide flows of goods and services varies depending upon the nature of the problem at hand. Different problems
require different analytical frameworks and different data bases that contain records on economywide transactions. These records are kept by following certain conventions that vary across accounting frameworks. Two of the mostly widely used frameworks are the input-output (10) and national income (N1) accounting frameworks. When the analytical focus is on the transactions between sectors and the sectoral composition of supply and demand, lO accounts are what must be used. When the balance among macroeconomic aggregates needs to be analysed, on the other hand, the appropriate accounting framework is that of national income (or National Income and Product Accounts, NIPA, as they are called in the US). Due to the differing levels of aggregation chosen to address different issues, 10 and N1 accounts can not immediately be reconciled: N1 accounts net out intermediate input
transactions between sectors as well as the sectoral composition of demand, whereas lO accounts, with their relatively heavier micro focus, overlook certain relations among components of national income that are fundamental to macroeconomic
analysis. The SAM framework combining elements of both 10 and N1 accounting stands out as a viable alternative for a reconciliation of microeconomic 10 data with
the macroeconomic data on various N1 aggregates (Robinson and Roland-Holst,
1988).
In addition to its role as a pure accounting framework serving as a bridge between lO
and N1 accounting, the SAM setting may serve as a background for SAM-based linear multiplier models as well as CGE models of Walrasian tradition (Hertel, 1990). As modeling tools for linear multiplier analyses, SAMs are similar to traditional 10 models as developed by Leontief (1936) and Keynesian models of macroeconomic literature in that they, too, may be used for an investigation of the
effects of various exogenous shocks on key economic variables. In fact, the linear multipliers calculated from SAMs can be used to measure the effects of such shocks on a wider range of economic variables than each of 10 and Keynesian models.
This chapter describes the basics of SAMs and the derivation of SAM multipliers. Following this description, the computation of SAM multipliers are illustrated in Chapter 4 with reference to a SAM which presents a snap shot of the US economy in 1986, the base year for the simulation experiment carried out in this thesis.
3.2. Computation of SAM Multipliers
In a SAM, the rows show receipts and columns show expenditures by various
accounts that represent different types of transactions. For each account, total receipts must equal total expenditures. Hence, the SAM must be a square matrix
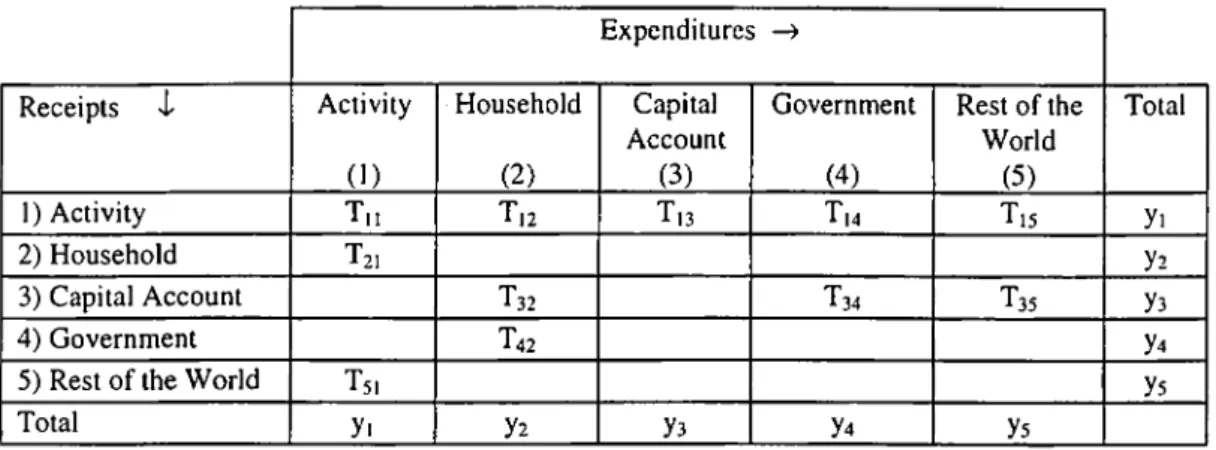
whose row and column sums are in balance. Table 1 below shows the basic structure of a sample SAM with five accounts.
Table 1. A Macroeconomic Social Accounting Matrix^ Expenditures -> Receipts i Activity (1) Household (2) Capital Account (3) Government (4) Rest of the World (5) Total 1) Activity T,i 112 yi 2) Household yi 3) Capital Account T32 134 135 y3 4) Government U2 y4
5) Rest of the World ys
Total yi y2 y3 y4 ys
In the aggregated macro SAM in Table 1, the first row elements show the receipts by
the activity account which receives i) the payments by producers who buy intermediate inputs, hire factor services to produce commodities, and generate value added in the process (Tn); ii) the (representative) household’s consumption spending (T12); iii) the investment spending by investors (T13); iv) the government spending (T14), and v) the payments by the Rest of the World (ROW) for home country’s
exports (T15). T21 in the second row is household income. In the third row, T32 is household savings, T34İS government savings, and T35 is the balance of trade (current account). T42 in the fourth row represents taxes paid by the households to the government and finally, T51 in the fifth row stands for imports.
There is a matching between SAM and N1 accounts and a SAM is called either GNP- based or GDP-based depending upon its structure. The macro aggregated SAM in Table 1 is GNP-based because the net factor income from abroad is not presented as
a separate entry (Hanson and Robinson, 1991). It is incorporated into the input- output table as a sector called ‘rest of the world industry’ (Adelman and Robinson, 1986). If net factor income from abroad is included as a separate entry, the resulting
' For a more detailed discussion, see Robinson and Roland-Holst (1988).
SAM is called a GDP-based SAM in which trade balance is defined in terms of
goods and non-factor services. In a GNP-based SAM, trade balance is defined as the current account balance including trade in factor services (Hanson and Robinson,
1991).
Given a GNP-based SAM, the value of current GNP (at market prices) can be calculated from the information contained within the accounts of a SAM and would be equal to total value added at factor cost plus indirect taxes and tariffs paid to the
government by the producers and importers. In the macro aggregated SAM above, however, indirect taxes and tariff payments do not show up as separate entries as they are included elsewhere. Likewise, there is no separate account for the value added showing the payments of the producers to the factor services they hire to produce commodities. So, this payment is directly transmitted to the households who own the factors of production, as total factor income. Therefore, the payments from the activity account to the households (T21) gives the GNP at factor cost in this SAM
structure.
In addition to the information it gives about N1 aggregates, the SAM in Table 1 can be used for a multiplier analysis much like the Keynesian models. For this purpose, the square SAM of pa5m ents and receipts must be converted into a coefficient matrix
by dividing each column entry by the corresponding column sum. For such a coefficient matrix, the column sums will be unity as shown in Table 2.
Tal)lc 2. riic C'olumn Nomi.iliscJ SAM \cln llv lio u sc h (» l(l ( \ i p i l a l A cco iJiU (învcrnmcni Rcsl ol lhc World I’olal AclIM lN 'I n/>i T:,/v, Tm/>. H< ■u'cî'.''Itl 1.7'.: r . / \ . Tr/>; I *
S ince the resulting coefficient m atrix will be singular (with an uiulclm cil m vcise). m u ltip liers can not be calculated w ithout idcnlilying e\())»,em>us accnim is. So. form ing a SA M -based m ultiplier model reciuircs designating accounts either as e x o g e n o u s or endogenous depending on the policy issues to be addiessed. In most cases, the capital account, along with the governm ent aiul the ROW accounts are taken as exogenous w hereas sectoral production, lactor returns and household incom es arc taken as endogenous. A nother com m on practice is to lake ca|>ital acco u n t as endogenous so as to capture the role ol llte savings-invesim eni lialance m the d eterm ination o f national incom e, and to retain the exogeneity ol the g.oveinment
and the R O W accounts.
If the activity, household and capital accounts in T able 1 are treated as endo.r.emnis ac co u n ts and the governntent and the ROW accounts are kept exogenous, the re.sulting relation betw een accounts can he presented throug.h the accounting balance
eq u a tio n s in T able 3.
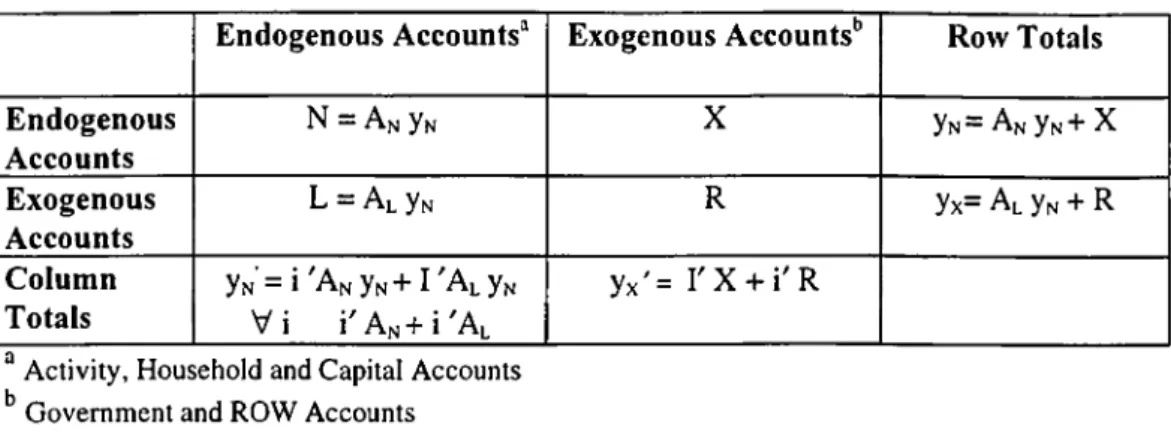
Table 3. Accounting Balance Equations’ E n d o g e n o u s A c c o u n t s “ E x o g e n o u s A ccounts^’ R o w T o ta ls E n d o g e n o u s A c c o u n t s N = A n Yn X Yn= An Yn+ X E x o g e n o u s A c c o u n t s L = A l Yn R Yx= AlYn + R C o lu m n T o ta ls Yn = i An Yn+ I Al Yn V i i An + i Al Y x ' = r x + i ' R
Activity, Household and Capital Accounts ^ Government and ROW Accounts
In Table 3, the transactions between endogenous accounts are represented by matrix N where Yn is a column vector of endogenous incomes, and An is the matrix of average propensities to consume which is computed from a column normalised SAM. Given that An is of the form.
An —
Tii/Yi T12/ Y2 T 13/ Y3
T21/Y 1 0 0
0 T32/ Y2 0
N = An Yn would represent the northwestern block of SAM multiplier matrix in Table 2. The leakages from exogenous into endogenous accounts are represented by the rectangular matrix L which is equal to the product of the matrix of average propensities to leak, Al, and the column vector of endogenous incomes, Yn. As such, L corresponds to the southwestern block of the matrix in Table 2. Here, leakages are imports and the government’s tax revenue for which no linkage is directly modeled.
They are excluded from the SAM multiplier analysis. The matrix X represents the column accounts of the government and rest of the world and is composed of government expenditure T^, exports T15, government savings T34, and trade (current
’ In Table 2, ‘ i' ’ represents the row vectors of the identity matrix ( i= 1,2,...)
account) balance T 3 5 . An exogenous injeetion into the system can be given from either component of X. Finally, R is the matrix of SAM transactions between
exogenous accounts which, in the case of SAM in Table 1, is a null matrix.
It follows from accounting balance equations in Table 3 that the expenditure total of the endogenous accounts in Table 1 is equal to column sums of N and L matrices
(Eqn. 1) as the column sum of each column in An and Al is equal to one (Eqn. 2):
yw'= i ' An yw + i ^Al yN (1)
V i i' An + i ' Al = 1
where i' represents the row vectors of the identity matrix.
(
2
)The column and row sums of exogenous accounts are also equal as shown by the following equalities:
y x '= i' X + i' R = y x = Al yN + Ri (3)
ALyN-X'i = (R -R ')i (4)
which states mathematically that, in aggregate, the injections into the system must be equal to leakages.
From the relation between matrices N and X (yN = N + X ), we can write:
yN = ANyN + X (5)
implying that
yN = (I-AN)-‘ X (6)
provided that (I-An) ' exists. This inverse represents the accounting multiplier matrix, M, and it is the channel which relates an injection in X to the endogenous incomes vector yN.
3.2.2. Decomposition of SAM Multipliers
The An matrix of average propensities to consume can be decomposed additively into two matrices of the same size as An, depending on the policy issues to be addressed. That is.
An = Ai + A2 =
a.i a,2 0 0 0 ai3
azi 0 0 + 0 0 0
0 0 0 0 as2 0
where a„ = T„/ yi, a,2 = T^/ yi, aji = T21/ yi, a,3 = T13/ yг, and aj2 = T32/ yi, in terms of Table 1.
Here, the elements of matrix Ai capture the interactions between factor and product markets, and those in A i capture the financial flows in an economy which channel savings into demand for investment goods. With this additive decomposition, equation (5) can be rewritten as :
yN = ( An - A i ) yN + Ai yN + X (7) ( I - A , ) y N = ( A N - A i ) y N + X (8) yN= (I - A i )-' ( An- A , ) yN + (I - Ai )''X (9) yN = A*yN+ ( I - A i ) - ' X (10) where A* = (I - Ai )'*( An - A i ) 19
Multiplying both sides of equation (10) with A* from the left hand side gives: A* y N= A’2yN + A * ( I - A , )-'X (11)
Now substituting the relevant expression for A* yn from equation (10) into equation (11) gives:
yN - (I - A, )-‘X = A*' yN + A* (I - A, )-'X (12) (I-A*2)yN = (I + A * ) ( I - A , ) - ' X (13) yN = ( I - A* 2 ) - ' ( I + A * ) ( I - A , ) - ' X (14)
Premultiplying both sides of equation (10) with A*^ and substituting the value of A*^ yN into (11) and going through the same steps in (12) to (14), one gets:
yN = (I - A*')-' (I + A* + A*' ) (I - Ai )-‘X (15) After further substitutions the general result becomes:
yN = (I - A*’')·' (I + A* + A*^ + ...+ A*^'^·'^) (I - A, )'*X (16)
provided that (I - A**')’* exists. Equation (16) implies that there are three components of the multiplier effect that a shock to X will transmit to yN:
M3 = (I - A * Y , M2= (I + A > .*2 ..+ (k-lK and Mi = (I - A i )
Some elements of matrices M i, M2, and M3 must be equal to one so as to show the one-to-one effects, or to zero so as to represent the complete absence of any effects (in more detailed cases there exists a block o f zeros as a column or row vector, and
identity vectors). For our choice of Ai, this condition is fulfilled when k is equal to two. When k takes values greater than or equal to three, the elements of these matrices which must be equal to 1 decrease and those that must be equal to zero increase in value.
When k is taken to be 2, equation (16) implies that the SAM multipliers can be decomposed into three components as:
M, = ( I - Ai )■'
M2 = ( I + A*) => M = M3 M2M, (17)
M3 = ( I - A * ^ ) · '
such that yn = M3 M2 MiX = MX implying that dyN = MdX, where dyN shows the change in Yn following a shock given to X in the form of dX.
The matrices M i, M2, and M3 given by
mil mi2 0 “ 1 0 mi3 “ 1 m i2 0 “
Ml = ni2i 1TI22 0 M2 = 0 1 ni23 M3 = 0 ITI22 0
0 0 I 0 m23 1 0 0 m23
_ _ _
can be shown in terms of the elements of matrix An as
M, =
M2 =
[l-(aii+ai2 [I"(aii+ai2a2i)] *)] * (1-an) ' ai2[l-a2i(l-an) * 312]' 0 ^2i[l“(aii+ai2a2i)]' [l-a2i(l-an) ' 812] ' 0
0 0 1
1 0 [l'(^ii + 3i2 821) ] 'ai3 0 1 a2i[l-(an + 3|2 821)] 'ai3
0 832 1
M3 =
1 [l'(8 ii + 8)2 821)] 'ai3 a32[ l-a2i[l-(a ii + a^ 821)] 'ai3 832]
0 [l-a2i[l-(aii + 8i2 821)] *813 832] ' 0 0 [ l - 832821 [l-(a ii + 8|2 821)] *813] 0 0 -lo 1-1 21
So far, all these multiplier and decomposition computations are done under the assumption that SAM multipliers exist and they can legitimately be called
multipliers. The existence of M guarantees the existence of Mi and the existence of M2 follows from the properties of A*. Finally, M3 will exist due to the existence of
M, Ml and M2 which are all finite matrices.®
As a result of the decomposition of the multiplier matrix M, the effects of a shock are transmitted to the accounts through three channels Mi, M2 and M3. The first
multiplier matrix, M |, captures the effects o f direct transfers. The first and second elements of the diagonal of Mi, in particular, capture the multiplier effects resulting from direct transfers between activities and households. When a shock is given to the activity account for example, the direct transfer effect is equal to the change in interindustry demand plus the change coming from household consumption demand caused by the shock given to that activity account. The third diagonal element is equal to one because there are no direct transfers from capital account to other accounts (activity and households). An injection to capital account is only transmitted to itself in a one-to-one manner.
The matrix M2 is called the open-loop multiplier matrix. It is called that since it
captures unidirectional effects from one account to another. An injection to household income, for example, will be transmitted to activity and capital accounts but not back to the household accounts, i.e., the loop will not be closed. For this
* To be able to call Mi, M2 and M3 multiplier matrices, each element of these matrices should be
greater than or equal to the corresponding elements of an identity matrix. For a formal proof of existence for M, Mi, M2, M3, see Pyatt and Round (1979).
reason, the second diagonal element in M2 is equal to one (by the same reasoning,
first and third diagonal elements are also equal to one). Of the off-diagonal elements of M2 matrix, mi3 shows the effect on activity account of an injection given to capital account which is transmitted to activity but not back to capital account.
M3 is the closed-loop multiplier matrix which takes into account the within-block
effects that arise from an injection and its passage from a block through the open- loop and back to the block again (Pyatt and Round, 1979). Because of the form of A |, multiplier matrix M3 gives the closed-loop multipliers acting through the
savings-investment balance. An injection to capital account first goes to activity account. In the activity account, it makes a circuit (induces a change in interindustry demand) and at the same time, goes to the household income and changes household income and consumption behavior. These changes sum up to a change in household income. Later, these changes are transmitted to households saving behaviour affecting, in turn, the investment behaviour. This closed-loop shows us the path through which an injection to capital account affects the capital account.
While the multiplicative decomposition of the SAM multipliers presents the path of transmission in an economy, the net multiplier effects of exogenous injections can be better visualised with the additive decomposition.^ Additive components of M are computed using the multiplicative components. The equality of these two forms of
decompositions and how additive decomposition components are calculated from M |, M2, and M3 are discussed below. For this purpose, consider equation 18
Suggested by Stone (1978).
M = M3M2M 1 = I + (M, - 1) + (M2 - I)M, + (M3 - I)M2M, = I + S, + S, + S 3 (18)
where the additive components of M are :
i) Initial injection: I,
ii) Transfer multiplier effects: S| = ( Mi - 1 ),
iii) Open-loop or cross-multiplier effects: S2 = ( M2 - 1 ) Mi, and iv) Circular or closed-loop multiplier effects: S3 = ( M3 - 1 ) M2 Mi.
C H A P T E R 4
A SAM Multiplier Analysis for Agricultural Support Policies in the US
4.1. Computation of SAM Multipliers for the US Economy
In this chapter, the SAM multipliers and their decomposition are studied for the US economy using a SAM for 1986, the first year of the base period chosen for the implementation of Uruguay Round Agreement decisions. The SAM data behind the model used for the computation of SAM multipliers here have been obtained from the GAMS program files for a 30 sector version of the USDA/ERS CGE Model by Robinson, Kilkenny and Hanson (1990). In the first section, the multiplier computations are discussed with reference to an aggregated SAM, and in the following section a disaggregated SAM is used.
4.1.1. Multipliers from an Aggregated SAM for the US
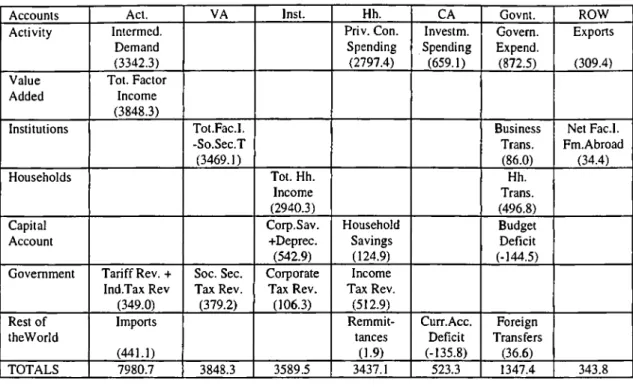
The aggregated SAM for the US economy constructed using 1986 as the base year is composed of seven accounts: activity, value added, institutions, households, capital account, government and the rest of the world (ROW). The transactions between
these accounts as expenditure and receipt entries are presented in Table 4.
Table 4. US SAM 1986 (Billions of Current Dollars).
Accounts Act. VA Inst. Hh. CA Govnt. ROW
Activity Intcrmcd. Demand (3342.3) Priv. Con. Spending (2797.4) Investm. Spending (659.1) Govern. Expend. (872.5) Exports (309.4) Value Added Tot. Factor Income (3848.3) Institutions Tot.Fac.I. -So.Sec.T (3469.1) Business Trans. (
86
.0
) Net Fac.l. Fm.Abroad (34,4) Households Tot. Hh. Income (2940.3) Hh. Trans. (496.8) Capital Account Corp.Sav. +Deprec. (542.9) Household Savings (124.9) Budget Deficit (-144.5) Government Tariff Rev. +Ind.Tax Rev (349.0) Soc. Sec. Tax Rev. (379.2) Corporate Tax Rev. (106.3) Income Tax Rev. (512.9) Rest of theWorld Imports (441.1) Remmit-tances (F9) Curr.Acc. Deficit (-135.8) Foreign Transfers (36.6) TOTALS 7980.7 3848.3 3589.5 3437.1 523.3 1347.4 343.8
Due to the nature of the policy issue to be addressed in the following section, the capital account is treated as endogenous just like the activity, value added, institution, and household accounts, whereas the government and the ROW accounts are kept exogenous. In developing the model to be used for the computation of SAM multipliers, the column normalized matrix An, and additively decomposed Ai and Aa matrices are presented below. This decomposition enables a separation of savings and investment accounts of the economy from the other transactions.
An = “ a 0 0
c
1 “ “ A 0 0c o“
“ 0 0 0 0 1 “ V 0 0 0 0v
0 0 0 0 0 0 0 0 0 0 F 0 0 0 A ,= 0 F 0 0 0 Aa = 0 0 0 0 0 0 0 Y 0 0 0 0 Y 0 0 0 0 0 0 0 0 0 Si Sh 0 0 0 0 0 0 0 0 Sı Sh0 26In ihc malriccs above. Л stan.lv
I<’f inicnn.lljstis .;r;5..,r, J { r,,. ,
c o n s u m p tio n d em an d ; V for v .l..^ n ·
' ' '••Iwc .ul.lcd p ,.s l„ c c d in (p rim ar)') fa c to rs o f p roduction; I· for t..t.,| f,
Y for total h o u se h o ld in com e; .S, and .S„ for
iclor income net o f s .v t.il vr. -.:r:!·. I . u f ·., in vtiliilinn.il (c o ij4 .:,jlD лгь!
...s,a,... ... . arc с о т р и , cd u sin g eq u a tio n ( 6 , a„,l ,l,c ,ем ,1 к , , ,
are g iv e n in T a b le 5. T h e se m ultipliers tim es ,|,e shuslc , t „ n , ... .. e n u ,
( a c tiv it y , v a lu e ad d ed , in stitu tion s, h u u seh old s and eap n .d , „ „ e s t h e . I,.„„.es
in th e r e c e ip ts o f e a c h e n d o g e n o u s account in the .SA.M.
T a b i c 5 . A g g r e g a te d S A M M u ltip liers for the U S
Endogenous Accounts Act. VA Inst.
Hh. СЛ Activity 5.20 4.19 4.65 4.47 (i * > 5 " Value Added 2.51 3.02 2.24 2.16 3 16 Institutions 2.26 2.72 3.02 1.94 2 8 5 ^ Households 1.85 2.23 2.48 2.59 2з:Г" Capital Account 0.41 0.49 0.55 0.39 1 52“ '
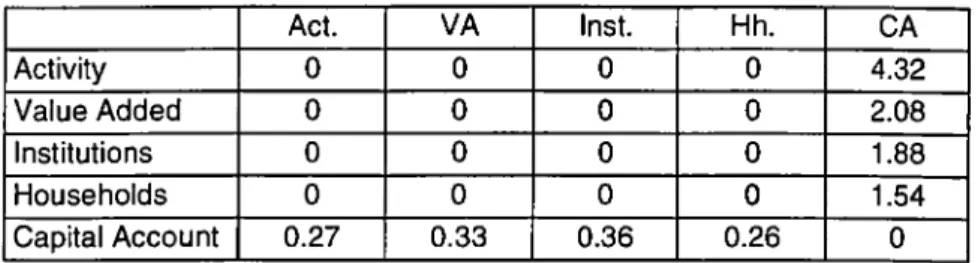
T h e rc.sults from the a d d itiv e d eco m p o sitio n o f the S A M n u iltip licts into S |. S... S ,
(E q n . 18) arc p resen ted in T a b les 6 . 7. and 8. res|K ctiv ely . riic use o f these tables
w ill b e e x p la in e d in the sec tio n w h ere the exp erim en ts are desctilH-d.
T a b i c 6 . T ra n sfer M u ltip lier s S | = (M | - 1)
Act. VA Inst. Hh. CA Activity 2.43 2.06 2.29 2.79 0 Value Added 1.65 0.99 1.1 1.35 6 Institutions 1.49 1.8 0.99 1.21 0 Households 1.22 1.47 1.63 0.99 0 1 Capital Account 0 0 0 0 0 27
Table 7. Open-Loop Multipliers St = (M2 - I)M| Act. VA Inst. Hh. CA Activity 0 0 0 0 4.32 Value Added 0 0 0 0 2.08 Institutions 0 0 0 0 1.88 Households 0 0 0 0 1.54 Capital Account 0.27 0.33 0.36 0.26 0
Table 8. Closed-Loop Multipliers S3 = (M3 - I)M2Mi
Act. VA Inst. Hh. CA Activity 1.77 2.13 2.36 1.68 2.23 Value Added 0.85 1.03 1.14 0.81 1.07 Institutions 0.77 0.93 1.03 0.73 0.97 Households 0.63 0.76 0.84 0.6 0.79 Capital Account 0.14 0.17 0.19 0.13 0.52
4.1.2. M ultipliers from a D isaggregated SAM fo r the US
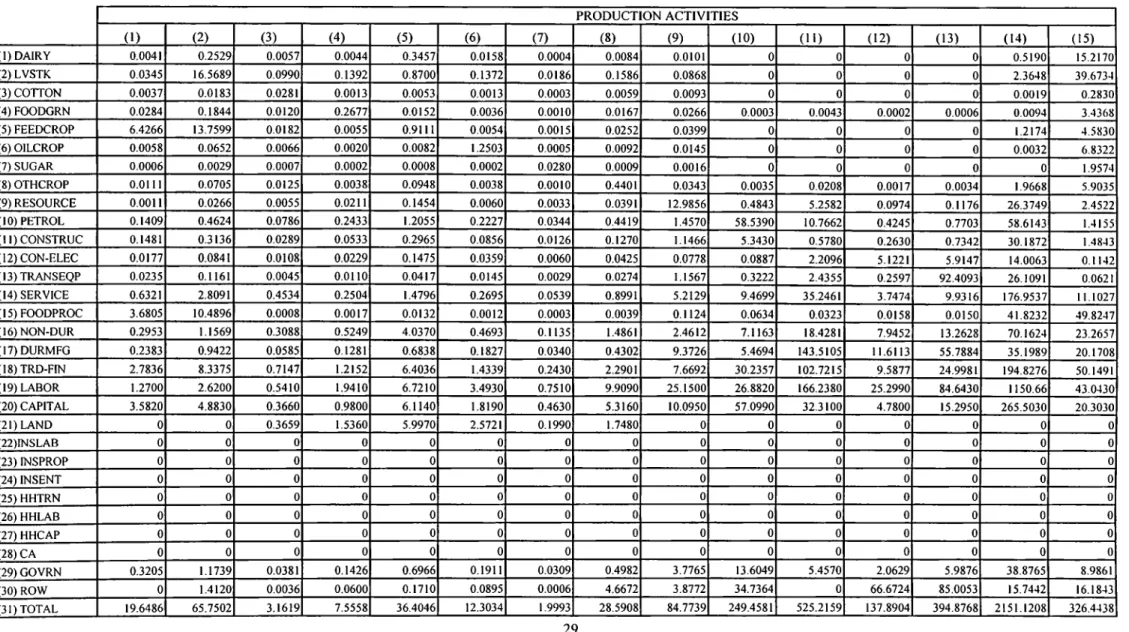
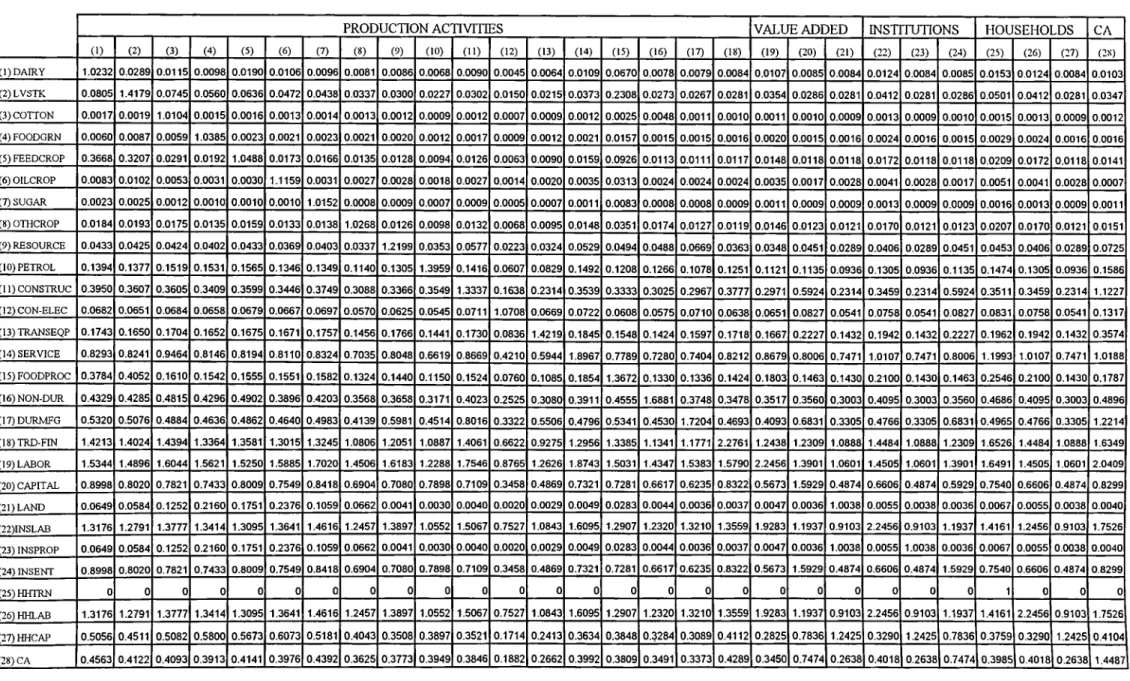
In analyzing the effects of a policy change, it is more convenient to use a disagregated SAM including many activities, different types of households and institutions as well as different types of factors of production. The usage of a disaggregated SAM will increase the information content and facilitate the interpretation of the results from a policy change by helping identify the groups of
actors who are affected the most, and the gainers and the losers in the economy. The disaggregated SAM for the US has 28 accounts (Table 9). The first 18 of these correspond to the activity account in the aggregated SAM in Table 4. They represent 18-sectors which can be grouped as agricultural, non-agricultural and others. The
second group is the disaggregation of value added account into factors of production: labor, capital and land. Next comes the institutions made up of labor, enterprises and proprietors. Households are also disaggregated into three types. First of these is
Table 9. A Disaggregated Social Accounting Matrix for the US (Billions of 1986 Dollars) PRODUCTION A C T IV IT IE S (1) (2) (3) (4) (5) (6) (7) (8) (9) (10) (11) (12) (13) (14) (15) (1) DAIRY 0.0041 0.2529 0.0057 0.0044 0.3457 0.0158 0.0004 0.0084 0.0101 0 0 0 0 0.5190 15.2170 (2) LVSTK 0.0345 16.5689 0.0990 0.1392 0.8700 0.1372 0.0186 0.1586 0.0868 0 0 0 0 2.3648 39.6734 (3) COTTON 0.0037 0.0183 0.0281 0.0013 0.0053 0.0013 0.0003 0.0059 0.0093 0 0 0 0 0.0019 0.2830 (4) FOODGRN 0.0284 0.1844 0.0120 0.2677 0.0152 0.0036 0.0010 0.0167 0.0266 0.0003 0.0043 0.0002 0.0006 0.0094 3.4368 (5) FEEDCROP 6.4266 13.7599 0.0182 0.0055 0.9111 0.0054 0.0015 0.0252 0.0399 0 0 0 0 1.2174 4.5830 (6) OILCROP 0.0058 0.0652 0.0066 0.0020 0.0082 1.2503 0.0005 0.0092 0.0145 0 0 0 0 0.0032 6.8322 (7) SUGAR 0.0006 0.0029 0.0007 0.0002 0.0008 0.0002 0.0280 0.0009 0.0016 0 0 0 0 0 1.9574 (8) OTHCROP 0.0111 0.0705 0.0125 0.0038 0.0948 0.0038 0.0010 0.4401 0.0343 0.0035 0.0208 0.0017 0.0034 1.9668 5.9035 (9) RESOURCE 0.0011 0.0266 0.0055 0.0211 0.1454 0.0060 0.0033 0.0391 12.9856 0.4843 5.2582 0.0974 0.1176 26.3749 2.4522 (10) PETROL 0.1409 0.4624 0.0786 0.2433 1.2055 0.2227 0.0344 0.4419 1.4570 58.5390 10.7662 0.4245 0.7703 58.6143 1.4155 (ll)CONSTRUC 0.1481 0.3136 0.0289 0.0533 0.2965 0.0856 0.0126 0.1270 1.1466 5.3430 0.5780 0.2630 0.7342 30.1872 1.4843 (12) CON-ELEC 0.0177 0.0841 0.0108 0.0229 0.1475 0.0359 0.0060 0.0425 0.0778 0.0887 2.2096 5.1221 5.9147 14.0063 0.1142 (13)TRANSEQP 0.0235 0.1161 0.0045 0.0110 0.0417 0.0145 0.0029 0.0274 1.1567 0.3222 2.4355 0.2597 92.4093 26.1091 0.0621 (14) SERVICE 0.6321 2.8091 0.4534 0.2504 1.4796 0.2695 0.0539 0.8991 5.2129 9.4699 35.2461 3.7474 9.9316 176.9537 11.1027 (15) FOODPROC 3.6805 10.4896 0.0008 0.0017 0.0132 0.0012 0.0003 0.0039 0.1124 0.0634 0.0323 0.0158 0.0150 41.8232 49.8247 (16) NON-DUR 0.2953 1.1569 0.3088 0.5249 4.0370 0.4693 0.1135 1.4861 2.4612 7.1163 18.4281 7.9452 13.2628 70.1624 23.2657 (17) DURMFG 0.2383 0.9422 0.0585 0.1281 0.6838 0.1827 0.0340 0.4302 9.3726 5.4694 143.5105 11.6113 55.7884 35.1989 20.1708 (18) TRD-FIN 2.7836 8.3375 0.7147 1.2152 6.4036 1.4339 0.2430 2.2901 7.6692 30.2357 102.7215 9.5877 24.9981 194.8276 50.1491 (19) LABOR 1.2700 2.6200 0.5410 1.9410 6.7210 3.4930 0.7510 9.9090 25.1500 26.8820 166.2380 25.2990 84.6430 1150.66 43.0430 (20) CAPITAL 3.5820 4.8830 0.3660 0.9800 6.1140 1.8190 0.4630 5.3160 10.0950 57.0990 32.3100 4.7800 15.2950 265.5030 20.3030 (21) LAND 0 0 0.3659 1.5360 5.9970 2.5721 0.1990 1.7480 0 0 0 0 0 0 0 (22)INSLAB 0 0 0 0 0 0 0 0 0 0 0 0 0 0 0 (23) INSPROP 0 0 0 0 0 0 0 0 0 0 0 0 0 0 0 (24) INSENT 0 0 0 0 0 0 0 0 0 0 0 0 0 0 0 (25) HHTRN 0 0 0 0 0 0 0 0 0 0 0 0 0 0 0 (26) HHLAB 0 0 0 0 0 0 0 0 0 0 0 0 0 0 0 (27) HHCAP 0 0 0 0 0 0 0 0 0 0 0 0 0 0 0 (28) CA 0 0 0 0 0 0 0 0 0 0 0 0 0 0 0 (29) GOVRN 0.3205 1.1739 0.0381 0.1426 0.6966 0.1911 0.0309 0.4982 3.7765 13.6049 5.4570 2.0629 5.9876 38.8765 8.9861 (30) ROW 0 1.4120 0.0036 0.0600 0.1710 0.0895 0.0006 4.6672 3.8772 34.7364 0 66.6724 85.0053 15.7442 16.1843 (31) TOTAL 19.6486 65.7502 3.1619 7.5558 36.4046 12.3034 1.9993 28.5908 84.7739 249.4581 525.2159 137.8904 394.8768 2151.1208 326.4438 29
Continued
PRODUCTION ACTIVITIES VALUE ADDED INSTITUTIONS HOUSEHOLDS CA GOVRN. ROW rOTAL
(16) (17) (18) (19) (20) (21) (22) (23) (24) (25) (26) (27) (28) (29) (30) (31) (1) DAIRY 0.0018 0.0006 0.0144 0 0 0 0 0 0 0.6801 2.0432 0.3089 -0.1207 0.3362 0 19.6480 (2) LVSTK 0.3849 0.1583 0.1074 0 0 0 0 0 0 0.9717 3.1302 0.4844 -0.2545 0.1482 0.4686 65.7502 (3) COTTON 2.0477 0.0027 0.0111 0 0 0 0 0 0 0.0020 0.0076 0.0016 -0.1308 0.1198 0.7408 3.1609 (4) FOODGRN 0.0078 0.0059 0.0455 0 0 0 0 0 0 0.0030 0.0133 0.0028 -0.1986 0.9358 2.7335 7.5563 (5) FEEDCROP 0.0754 0.0026 0.0479 0 0 0 0 0 0 0.0974 0.5643 0.1274 -0.2139 5.7764 2.9330 36.4040 (6) OILCROP 0.0093 0.0009 0.0175 0 0 0 0 0 0 0.0159 0.0663 0.0138 -1.1639 0.6416 4.5063 12.3055 (7) SUGAR 0.0011 0.0115 0.0021 0 0 0 0 0 0 0.0010 0.0038 0.0008 -0.0133 0 0 2.0002 (8) OTHCROP 3.4570 0.8792 0.1071 0 0 0 0 0 0 2.7095 9.0420 1.7185 -0.3825 0.7981 1.6980 28.5986 (9) RESOURCE 7.1943 20.0863 0.0462 0 0 0 0 0 0 0.2588 0.9089 0.1962 1.0619 0.6176 6.3855 84.7741 (10) PETROL 13.3181 5.3597 34.3923 0 0 0 0 0 0 6.1444 27.4859 4.6299 0.6755 7.3498 15.2899 249.4619 (ll)CONSTRUC 3.2786 5.6261 43.1434 0 0 0 0 0 0 0 0 0 383.1824 49.1407 0.0430 525.2159 (12) CON-ELEC 1.6130 10.6980 2.7238 0 0 0 0 0 0 8.3214 33.4659 6.8889 22.5647 9.5647 14.1330 137.8745 (13)TRANSEQP 0.6602 9.3897 14.4239 0 0 0 0 0 0 10.0552 65.3299 16.0091 61.88901 45.7631 48.3542 394.8705 (14) SERVICE 37.2813 38.2387 187.7997 0 0 0 0 0 0 186.4004 657.3984 137.6768 10.2843 604.0632 33.4795 2151.1337 (15) FOODPROC 2.6306 0.2499 0.5327 0 0 0 0 0 0 39.8399 138.9273 22.5012 0.4430 5.3415 9.8963 326.4405 (16)NON-DUR 211.3694 42.1818 53.5379 0 0 0 0 0 0 36.2982 140.0616 29.8110 4.5447 29.5536 34.5284 732.9198 (17) DURMFG 27.1937 224.5020 17.1582 0 0 0 0 0 0 8.0328 38.9385 9.0262 160.3996 53.4479 82.1070 904.6257 (18)TRD-FIN 79.0885 109.3137 387.6254 0 0 0 0 0 0 196.9683 776.2325 177.6272 16.8345 58.5840 52.1349 2298.0196 (19) LABOR 159.6560 260.0010 715.2920 0 0 0 0 0 0 0 0 0 0 0 0 2684.1070 (20) CAPITAL 74.9390 61.5530 586.3760 0 0 0 0 0 0 0 0 0 0 0 0 1151.7760 (21) LAND 0 0 0 0 0 0 0 0 0 0 0 0 0 0 0 12.4180 (22)INSLAB 0 0 0 2304.9000 0 0 0 0 0 0 0 0 0 0 0 2304.9000 (23) INSPROP 0 0 0 0 0 12.4180 0 0 0 0 0 0 0 0 0 12.4180 (24) INSENT 0 0 0 0 1151.7760 0 0 0 0 0 0 0 0 86.0000 34.4000 1272.1760 (25) HHTRN 0 0 0 0 0 0 0 0 0 0 0 0 0 496.8000 0 496.8000 (26) HHLAB 0 0 0 0 0 0 2304.9070 0 0 0 0 0 0 0 0 2304.9070 (27) HHCAP 0 0 0 0 0 0 0 12.4180 622.9750 0 0 0 0 0 0 635.3930 (28) CA 0 0 0 0 0 0 0 0 542.9000 0 120.8693 4.1114 0 -144.5000 0 523.3807 (29) GOVRN 16.2853 13.5256 237.3462 379.2000 0 0 0 0 106.3000 0 290.418282 222.3560 0 0 0 1347.2747 (30) ROW 92.4189 102.8781 17.2432 0 0 0 0 0 0 0 0 1.9000 -135.8000 36.6000 0 343.8641 (31) TOTAL 732.9118 904.6653 2297.9936 2684.1000 1151.7760 12.4180 2304.9070 12.4180 1272.1750 496.8000 2304.9070 635.3922 523.6548 1347.0837 343.8320 30
transfer recipients whose income comes solely from the transfers by the government. The households in this group are assumed not to make any savings and they are not supposed to pay any taxes. Wage earners and rentiers are those who receive their income from institutions in the form of factor payments, i.e., wage earnings, property
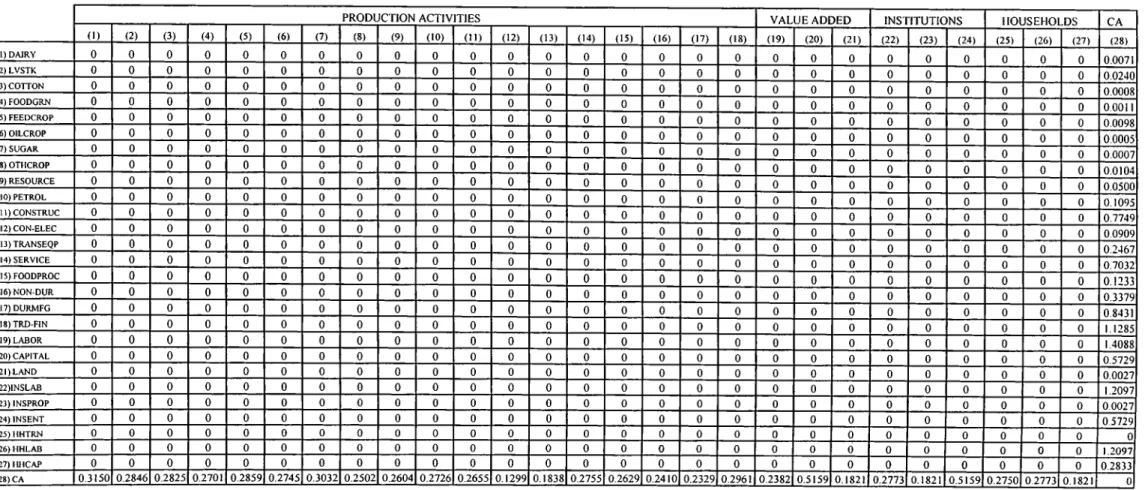
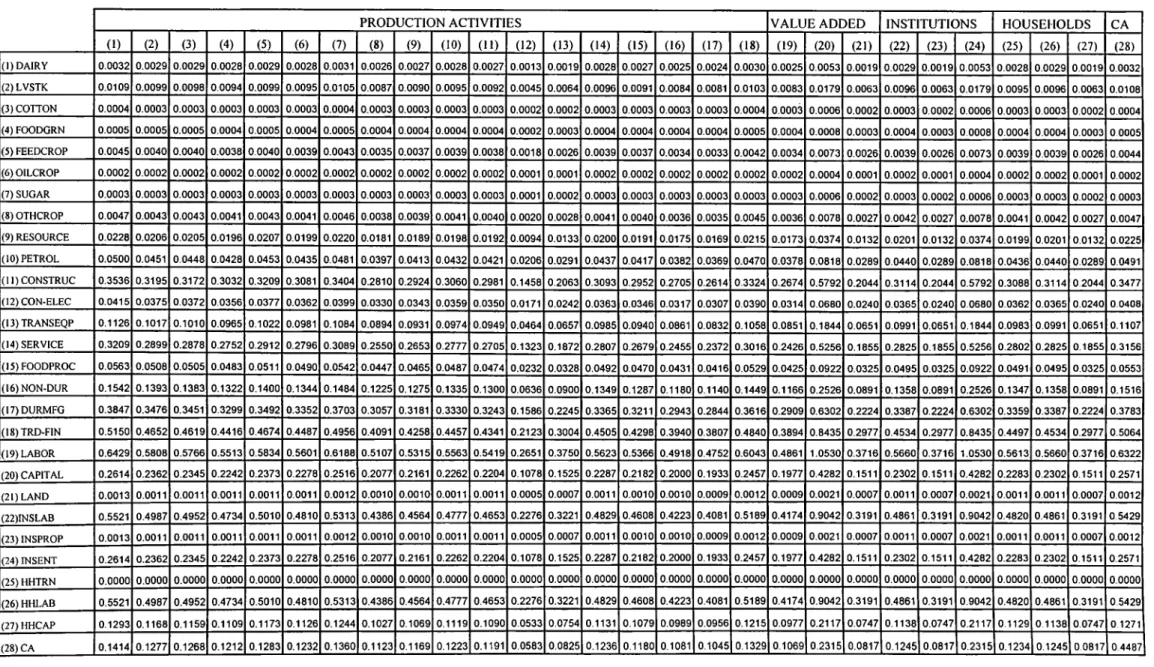
and rental income and dividends. Following these are the capital account, and the government and the rest o f the world accounts. The computation of SAM multipliers and their additive decomposition is done as described in the previous section and
their values are given in Tables 10 through 13.
4.2. The Simulation Experiment
The Uruguay Round (UR) Agreement on Agriculture defined new borders to agricultural support policies of the members o f GATT/WTO. Differently than the pre-UR GATT Agreements that excluded agriculture as a whole, the UR ended with a majority decision that requires the countries to reduce the levels of support and protection given to agriculture gradually. In order to determine the rate at which the protection and support to agriculture will be reduced, a reference was needed. For this purpose, 1986-1988 period was chosen as the base period and the countries were required to reduce their domestic support relative to the respective levels o f Aggregate Measures o f Support (AMS) estimated for this period. Some policies, however, were kept outside the AMS reduction commitments. These are called
“Green Box” policies and they are presumed not to distort production and trade patterns. The policies that would be included under Green Box must satisfy a number o f criteria. The most contentious category o f Green Box measures is the direct payments to producers. Not to be included in the AMS calculations, direct payments
Table 1 0. 1986 Disaggregated Social Accounting Matrix Multipliers for the US
PRODUCTION ACTIVITIES VALUE ADDED INSTITUTIONS HOUSEHOLDS CA
0 ) (2) (3) (4) (5) (6) (7) (8) (9) (10) (11) (12) (13) (14) (15) (16) (17) (18) (19) (20) (21) (22) (23) (24) (25) (26) (27) (2S) (1) DAIRY 1.0232 0.0289 0.0115 0.0098 0.0190 0.0106 0.0096 0.0081 0.0086 0.0068 0.0090 0.0045 0.0064 0.0109 0.0670 0.0078 0.0079 0.0084 0.0107 0.0085 0.0084 0.0124 0.0084 0.0085 0.0153 0.0124 0.0084 0.0103 (2) LVSTK 0.0805 1.4179 0.0745 0.0560 0.0636 0.0472 0.0438 0.0337 0.0300 0.0227 0.0302 0.0150 0.0215 0.0373 0.2308 0.0273 0.0267 0.0281 0.0354 0.0286 0.0281 0.0412 0.0281 0.0286 0.0501 0.0412 0.0281 0.0347 (3) COTTON 0.0017 0.0019 1.0104 0.0015 0.0016 0.0013 0.0014 0.0013 0.0012 0.0009 0.0012 0.0007 0.0009 0.0012 0.0025 0.0048 0.0011 0.0010 0.0011 0.0010 0.0009 0.0013 0.0009 0.0010 0.0015 0.0013 0.0009 0.0012 (4) FOODGRN 0.0060 0.0087 0.0059 1.0385 0.0023 0.0021 0.0023 0.0021 0.0020 0.0012 0.0017 0.0009 0.0012 0.0021 0.0157 0.0015 0.0015 0.0016 0.0020 0.0015 0.0016 0.0024 0.0016 0.0015 0.0029 0.0024 0.0016 0.0016 (5) FEEDCROP 0.3668 0.3207 0.0291 0.0192 1.0488 0.0173 0.0166 0.0135 0.0128 0.0094 0.0126 0.0063 0.0090 0.0159 0.0926 0.0113 0.0111 0.0117 0.0148 0.0118 0.0118 0.0172 0.0118 0.0118 0.0209 0.0172 0.0118 0.0141 (6) OILCROP 0.0083 0.0102 0.0053 0.0031 0.0030 1.1159 0.0031 0.0027 0.0028 0.0018 0.0027 0.0014 0.0020 0.0035 0.0313 0.0024 0.0024 0.0024 0.0035 0.0017 0.0028 0.0041 0.0028 0.0017 0.0051 0.0041 0.0028 0.0007 (7) SUGAR 0.0023 0.0025 0.0012 0.0010 0.0010 0.0010 1.0152 0.0008 0.0009 0.0007 0.0009 0.0005 0.0007 0.0011 0.0083 0.0008 0.0008 0.0009 0.0011 0.0009 0.0009 0.0013 0.0009 0.0009 0.0016 0.0013 0.0009 0.0011 (8) OTHCROP 0.0184 0.0193 0.0175 0.0135 0.0159 0.0133 0.0138 1.0268 0.0126 0.0098 0.0132 0.0068 0.0095 0.0148 0.0351 0.0174 0.0127 0.0119 0.0146 0.0123 0.0121 0.0170 0.0121 0.0123 0.0207 0.0170 0.0121 0.0151 (9) RESOURCE 0.0433 0.0425 0.0424 0.0402 0.0433 0.0369 0.0403 0.0337 1.2199 0.0353 0.0577 0.0223 0.0324 0.0529 0.0494 0.0488 0.0669 0.0363 0.0348 0.0451 0.0289 0.0406 0.0289 0.0451 0.0453 0.0406 0.0289 0.0725 (10) PETROL 0.1394 0.1377 0.1519 0.1531 0.1565 0.1346 0.1349 0.1140 0.1305 1.3959 0.1416 0.0607 0.0829 0.1492 0.1208 0.1266 0.1078 0.1251 0.1121 0.1135 0.0936 0.1305 0.0936 0.1135 0.1474 0.1305 0.0936 0.1586 (ll)CONSTRUC 0.3950 0.3607 0.3605 0.3409 0.3599 0.3446 0.3749 0.3088 0.3366 0.3549 1.3337 0.1638 0.2314 0.3539 0.3333 0.3025 0.2967 0.3777 0.2971 0.5924 0.2314 0.3459 0.2314 0.5924 0.3511 0.3459 0.2314 1.1227 (12) CON-ELEC 0.0682 0.0651 0.0684 0.0658 0.0679 0.0667 0.0697 0.0570 0.0625 0.0545 0.0711 1.0708 0.0669 0.0722 0.0608 0.0575 0.0710 0.0638 0.0651 0.0827 0.0541 0.0758 0.0541 0.0827 0.0831 0.0758 0.0541 0.1317 (13) TRANSEQP 0.1743 0.1650 0.1704 0.1652 0.1675 0.1671 0.1757 0.1456 0.1766 0.1441 0.1730 0.0836 1.4219 0.1845 0.1548 0.1424 0.1597 0.1718 0.1667 0.2227 0.1432 0.1942 0.1432 0.2227 0.1962 0.1942 0.1432 0.3574 (14) SERVICE 0.8293 0.8241 0.9464 0.8146 0.8194 0.8110 0.8324 0.7035 0.8048 0.6619 0.8669 0.4210 0.5944 1.8967 0.7789 0.7280 0.7404 0.8212 0.8679 0.8006 0.7471 1.0107 0.7471 0.8006 1.1993 1.0107 0.7471 1.0188 (15)FOODPROC 0.3784 0.4052 0.1610 0.1542 0.1555 0.1551 0.1582 0.1324 0.1440 0.1150 0.1524 0.0760 0.1085 0.1854 1.3672 0.1330 0.1336 0.1424 0.1803 0.1463 0.1430 0.2100 0.1430 0.1463 0.2546 0.2100 0.1430 0.1787 (16) NON-DUR 0.4329 0.4285 0.4815 0.4296 0.4902 0.3896 0.4203 0.3568 0.3658 0.3171 0.4023 0.2525 0.3080 0.3911 0.4555 1.6881 0.3748 0.3478 0.3517 0.3560 0.3003 0.4095 0.3003 0.3560 0.4686 0.4095 0.3003 0.4896 (17) DURMFG 0.5320 0.5076 0.4884 0.4636 0.4862 0.4640 0.4983 0.4139 0.5981 0.4514 0.8016 0.3322 0.5506 0.4796 0.5341 0.4530 1.7204 0.4693 0.4093 0.6831 0.3305 0.4766 0.3305 0.6831 0.4965 0.4766 0.3305 1.2214 (18)TRD-FIN 1.4213 1.4024 1.4394 1.3364 1.3581 1.3015 1.3245 1.0806 1.2051 1.0887 1.4061 0.6622 0.9275 1.2956 1.3385 1.1341 1.1771 2.2761 1.2438 1.2309 1.0888 1.4484 1.0888 1.2309 1.6526 1.4484 1.0888 1.6349 (19) LABOR 1.5344 1.4896 1.6044 1.5621 1.5250 1.5885 1.7020 1.4506 1.6183 1.2288 1.7546 0.8765 1.2626 1.8743 1.5031 1.4347 1.5383 1.5790 2.2456 1.3901 1.0601 1.4505 1.0601 1.3901 1.6491 1.4505 1.0601 2.0409 (20) CAPITAL 0.8998 0.8020 0.7821 0.7433 0.8009 0.7549 0.8418 0.6904 0.7080 0.7898 0.7109 0.3458 0.4869 0.7321 0.7281 0.6617 0.6235 0.8322 0.5673 1.5929 0.4874 0.6606 0.4874 0.5929 0.7540 0.6606 0.4874 0.8299 (21) LAND 0.0649 0.0584 0.1252 0.2160 0.1751 0.2376 0.1059 0.0662 0.0041 0.0030 0.0040 0.0020 0.0029 0.0049 0.0283 0.0044 0.0036 0.0037 0.0047 0.0036 1.0038 0.0055 0.0038 0.0036 0.0067 0.0055 0.0038 0.0040 (22)INSLAB 1.3176 1.2791 1.3777 1.3414 1.3095 1.3641 1.4616 1.2457 1.3897 1.0552 1.5067 0.7527 1.0843 1.6095 1.2907 1.2320 1.3210 1.3559 1.9283 1.1937 0.9103 2.2456 0.9103 1.1937 1.4161 1.2456 0.9103 1.7526 (23) INSPROP 0.0649 0.0584 0.1252 0.2160 0.1751 0.2376 0.1059 0.0662 0.0041 0.0030 0.0040 0.0020 0.0029 0.0049 0.0283 0.0044 0.0036 0.0037 0.0047 0.0036 1.0038 0.0055 1.0038 0.0036 0.0067 0.0055 0.0038 0.0040 (24) INSENT 0.8998 0.8020 0.7821 0.7433 0.8009 0.7549 0.8418 0.6904 0.7080 0.7898 0.7109 0.3458 0.4869 0.7321 0.7281 0.6617 0.6235 0.8322 0.5673 1.5929 0.4874 0.6606 0.4874 1.5929 0.7540 0.6606 0.4874 0.8299 (25)HHTRN 0 0 0 0 0 0 0 0 0 0 0 0 0 0 0 0 0 0 0 0 0 0 0 0 1 0 0 0 (26) HHLAB 1.3176 1.2791 1.3777 1.3414 1.3095 1.3641 1.4616 1.2457 1.3897 1.0552 1.5067 0.7527 1.0843 1.6095 1.2907 1.2320 1.3210 1.3559 1.9283 1.1937 0.9103 2.2456 0.9103 1.1937 1.4161 2.2456 0.9103 1.7526 (27) HHCAP 0.5056 0.4511 0.5082 0.5800 0.5673 0.6073 0.5181 0.4043 0.3508 0.3897 0.3521 0.1714 0.2413 0.3634 0.3848 0.3284 0.3089 0.4112 0.2825 0.7836 1.2425 0.3290 1.2425 0.7836 0.3759 0.3290 1.2425 0.4104 (28) CA 0.4563 0.4122 0.4093 0.3913 0.4141 0.3976 0.4392 0.3625 0.3773 0.3949 0.3846 0.1882 0.2662 0.3992 0.3809 0.3491 0.3373 0.4289 0.3450 0.7474 0.2638 0.4018 0.2638 0.7474 0.3985 0.4018 0.2638 1.4487