i
EXCITON HARVESTING SYSTEMS OF
NANOCRYSTALS
A THESIS
SUBMITTED TO THE DEPARTMENT OF PHYSICS
AND THE GRADUATE SCHOOL OF ENGINEERING AND SCIENCE OF BILKENT UNIVERSITY
IN PARTIAL FULFILMENT OF THE REQUIREMENTS FOR THE DEGREE OF
DOCTOR OF PHILOSOPHY
By
Evren Mutlugün
December 2011
ii
I certify that I have read this thesis and that in my opinion it is fully adequate, in scope and in quality, as a thesis for the degree of Doctor of Philosophy.
Assoc. Prof. Dr. Hilmi Volkan Demir (Supervisor)
I certify that I have read this thesis and that in my opinion it is fully adequate, in scope and in quality, as a thesis for the degree of Doctor of Philosophy.
Prof. Dr. Bilal Tanatar
I certify that I have read this thesis and that in my opinion it is fully adequate, in scope and in quality, as a thesis for the degree of Doctor of Philosophy.
iii
I certify that I have read this thesis and that in my opinion it is fully adequate, in scope and in quality, as a thesis for the degree of Doctor of Philosophy.
Prof. Dr. Ayhan Altıntaş
I certify that I have read this thesis and that in my opinion it is fully adequate, in scope and in quality, as a thesis for the degree of Doctor of Philosophy.
Prof. Dr. Raşit Turan
Approved for the Graduate School of Engineering and Science:
Prof. Dr. Levent Onural
iv
ABSTRACT
EXCITON HARVESTING SYSTEMS OF
NANOCRYSTALS
Evren Mutlugün Ph.D. in Physics
Supervisor: Assoc. Prof. Dr. Hilmi Volkan Demir
December 2011
Semiconductor nanocrystals, also known as colloidal quantum dots, have gained substantial scientific interest for innovative light harvesting applications including those in biolabeling. Organic dyes and fluorescent proteins are widely used in biotargeting and live cell imaging, but their intrinsic optical properties, such as narrow excitation windows, limit their potential for advanced applications, e.g., spectral multiplexing. Compared to these organic fluorophores, favorable properties of the quantum dots including high photoluminescence quantum yields together with tunable emission peaks and narrow spectral emission widths, high extinction coefficients, and broad absorption bands enable us to discover and innovate light harvesting composites. In such systems, however, the scientific challenge is to achieve high levels of energy transfer from one species to the other, with additional features of versatility and tunability.
To address these problems, as a conceptual advancement, this thesis proposes and demonstrates a new class of versatile light harvesting systems of semiconductor nanocrystals mediated by excitonic interactions based on Förster-type nonradiative energy transfer. In this thesis, we synthesized near-unity efficiency colloidal quantum dots with as-synthesized photoluminescence quantum yields of >95%. As proof-of-concept demonstrations, we studied and achieved highly efficient exciton harvesting systems of quantum dots bound to fluorescent proteins, where the excitons are zipped from the dots to the proteins in the composite. This led to many folds of light harvesting (tunable up to 15
v
times) in the case of the green fluorescent protein. Using organic dye molecules electrostatically interacting with quantum dots, we showed high levels of exciton migration from the dots to the molecules (up to 94%). Furthermore, we demonstrated stand-alone, flexible membranes of nanocrystals in unprecedentedly large areas (> 50 cm × 50 cm), which paves the way for high-end, large-scale applications. In the thesis, we also developed exciton-exciton coupling models to support the experimental results. This thesis opens up new possibilities for exciton-harvesting in biolabeling and optoelectronics.
Keywords: Semiconductor nanocrystals, nonradiative energy transfer, excitons, light harvesting.
vi
ÖZET
NANOKRİSTALLİ EKSİTON HASATI SİSTEMLERİ
Evren MutlugünFizik Bölümü Doktora
Tez Yöneticisi: Doç. Dr. Hilmi Volkan Demir Aralık 2011
Kolloidal kuantum noktacıkları olarak da bilinen yarı iletken nanokristaller, biyo-etiketlemenin de içerisinde olduğu yenilikçi ışık hasatı sistemleri için oldukça büyük bilimsel ilgi kazanmıştır. Organik boyalar ve floresan proteinler, biyo-hedef ve canlı hücre görüntüleme için sıklıkla kullanılsa da, sahip oldukları esas optik özellikleri, dar uyarım penceresi gibi, onların ileri uygulamalar için kullanımlarını, örn. spektral çoklama, sınırlamaktadır. Organik ışıyıcılarla karşılaştırıldığında kuantum noktacıklarının sahip olduğu yüksek fotolüminesans verimliliği, ayarlanabilir ışıma dalga boyları, dar ışıma tayfları, yüksek soğurma katsayıları ve geniş soğurma tayfları gibi üstün özellikleri yenilikçi ışık hasatı kompozitlerini keşfetmemizi sağlamaktadır. Bu sistemlerde ise bilimsel zorluk, bir türden diğerine, ayarlanabilir ve farklı şekillerde uygulanabilir özellikleriyle yüksek verimli enerji transferi elde etmektir.
Bu tez, bu sorunları karşılamak için kavramsal bir ilerleme olarak, Förster tipi ışınımsal olmayan enerji transferi temelli eksitonik etkileşime dayanan, yeni sınıf farklı şekillerde uygulanabilir yarı iletken nanokristalli ışık hasatı sistemlerini önerip göstermektedir. Bu tezde biz, sentezlendiği hali ile fotolüminesans kuantum verimlilikleri %95’ten daha yüksek kolloidal kuantum noktacıklarını verimlilikleri tama yakın şekilde sentezledik. Kavramsal ispat olarak, kompozit yapı içerisinde eksitonların kuantum noktacıklardan flöresan proteinlere gönderildiği, yüksek verimlilikte eksiton hasatı elde ettiğimiz proteinlere bağlı noktacıkları sistemlerini çalışıp elde ettik. Bu çalışmalar yeşil flöresan protein için çok yüksek kat (15 kata kadar ayarlanabilir) ışık hasatını sağlamıştır. Organik boya moleküllerini kuantum noktacıkları ile elektrostatik olarak etkileştirerek, noktacıklardan moleküllere yüksek verimlilikle (%94’e kadar) eksiton transferini gerçekleştirdik. Bununla birlikte üst düzey büyük
vii
alanlı uygulamalara yol açan, daha önce hiç benzeri görülmemiş, büyük alanlı (50 cm × 50 cm’den büyük), tek başına ayakta durabilen, esnek nanokristal membranlarını gösterdik. Bu tezde ayrıca deneysel sonuçlarımızı desteklemesi için eksiton-eksiton çiftlemesi esasına dayanan modelleme yaptık. Bu tez biyoeiketleme ve optoelektronikte eksiton hasatı için yeni olasılıklar açmaktadır.
Anahtar kelimeler: Yarı iletken nanokristaller, ışınımsal olmayan enerji transferi,eksitonlar, ışık hasatı.
viii
Acknowledgements
It has been a long time since people started contributing this PhD thesis in different aspects. It is not easy to possibly include all of them on this page, but I will try my best...
First I would like to acknowledge my advisor Assoc. Prof. Hilmi Volkan Demir. He had been more than a Ph.D. advisor to me. I had the opportunity to share almost 7 years of professional experience with him. Not only learning from him about scientific content, but I had the chance of getting more than one could get from his advisor. Apart from all, he taught me to be professional in a scientific environment. I will never forget his kind attitude, friendship, guidance, encouragement, and his optimistic way of handling things. I am thankful to him to provide me and my colleaugues with a truly scientific environment by all means.
Also my special thanks go to Prof. Bilal Tanatar, Assoc. Prof. Ceyhun Bulutay, Prof. Raşit Turan, and Prof. Ayhan Altıntaş for being on my jury and for their kind support and help throughout my Ph.D. at Bilkent.
Now comes my friends. Without your friendship and support, this thesis would not have been possible. Whatever I write here for your friendship and personality, that would not really be enough. I learned a lot from you and I am really proud to have such a selection of very nice people to be my best friends. I would like to acknowledge my closest friends Sedat Nizamoğlu, Rohat Melik, Tuncay Özel, Özge Özel, and Emre Sarı, my officemates at the Advanced Reseach Lab. I cannot forget the happy times we had there. I would also very much like to acknolwledge Talha Erdem, Burak Güzeltürk, İbrahim Murat Soğancı, Can Uran, Cüneyt Eroğlu, Yusuf Keleştemur, Kıvanç Güngör, Ahmet Fatih Cihan, Shahab Akhavan, Yasemin Coşk un, Sayım Gökyar, Veli Tayfun
ix
Kılıç, Aydan Yeltik, Ozan Yerli, and Togay Amirahmadov for their wonderful friendship and collaboration.
Also very importantly, among the management and technical team and the post doctoral researchers of the group: Dr. Nihan Kosku Perkgoz, Ozgun Akyuz, and Emre Unal; and Dr. Urartu Özgür Şafak Şeker, Dr. Ludwig Pedro Hernandez Martinez, and Dr. Vijay Kumar Sharma. I am really very thankful to you all for great friendship and support to help me carry out my Ph.D. work.
To the present and former members of the Devices and Sensors Demir Group: I am thankful to you all!
Also, I am thankful to Prof. Salim Çıracı, faculty members, graduate students and the technical support staff at UNAM for their kind attitude, support and help to carry out my experimental Ph.D. work. Also, I would like to acknowledge Physics Department and Advanced Rearch Lab faculty, graduate students, and staff for their support and friendship.
I am thankful to Assoc. Prof. Mehmet Şahin, and Dr. Murat Taş for their support and friendship. I would like to further acknowledge our collaborators in Germany. I am thankful to Prof. Alexander Eychmuller, Dr. Nikolai Gaponik, Dr. Stephen Hickey, Dr. Vladimir Lesnyak, Dr. Subhendu Panda, Dr. Zoran Popovic and the entire group there.
Besides, I would like to acknowledge TÜBİTAK BİDEB 2211 PhD. Scholarship.
My special thanks is for my family. I am sure they are the ones whom deserve the most of my acknowledgement. I am thankful for their support in all means. My family and my family-in-law, I love you all. My wife Sumeyye. I would not have been able to get to this stage without you being in my life. You have been
x
more than everything for me. And my son, Yusuf Kerem. You were the one to show me how fruitful the life is. I love you so much. I dedicate this thesis to my wife and my son.
xi
Table of Contents
1. INTRODUCTION ... 1 2. SEMICONDUCTOR NANOCRYSTALS ... 9 2.1BACKGROUND INFORMATION ... 9 2.2SYNTHESIS OF II-VIQDS ... 15 2.2.1 Synthesis of core QDs ... 152.2.1.1 Aqueous CdTe QD synthesis ... 15
2.2.1.2 Organic CdSe QD synthesis ... 18
2.2.2 Synthesis of core/shell QDs ... 20
2.2.2.1 CdSe/CdS core/shell QDs ... 21
2.3SYNTHESIS OF III-VQD SYNTHESIS ... 24
2.3.1 InP/ZnS QD synthesis ... 24
3. NONRADIATIVE ENERGY TRANSFER ... 28
3.1EXCITATION AND DE-EXCITATION PATHS ... 28
3.2FÖRSTER TYPE NONRADIATIVE ENERGY TRANSFER MECHANISM ... 29
4. EXPERIMENTAL METHODS ... 33
4.1PHOTOLUMINESCENCE SPECTROSCOPY AND PHOTOLUMINESCENCE EXCITATION SPECTROSCOPY ... 33
4.2ABSORPTION SPECTROSCOPY ... 34
4.3QUANTUM EFFICIENCY MEASUREMENT ... 34
4.4TIME RESOLVED PHOTOLUMINESCENCE SPECTROSCOPY ... 36
4.5TRANSMISSION ELECTRON MICROSCOPY ... 37
4.6OTHERS ... 37
5. EXCITON HARVESTING OF NANOCRYSTAL QUANTUM DOTS FOR GREEN FLUORESCENT PROTEINS ... 40
5.1INTRODUCTION ... 40
5.2RESULTS AND DISCUSSION ... 41
5.3SUMMARY ... 60
6. EXCITONIC ENERGY TRANSFER FROM CHARGED QUANTUM DOTS TO ORGANIC DYE MOLECULES ... 61
6.1INTRODUCTION ... 61
6.2RESULTS AND DISCUSSION ... 63
6.3SUMMARY ... 70
7. EXCITONIC ENERGY TRANSFER FROM WATER SOLUBLE QUANTUM DOTS TO ORGANIC DYE MOLECULES ... 71
7.1INTRODUCTION ... 71
7.2RESULTS AND DISCUSSION ... 74
7.3SUMMARY ... 90
8. EXCITONIC INTERACTIONS IN VERY LARGE-AREA FREE-STANDING MEMBRANES OF COLLOIDAL InP/ZnS QUANTUM DOTS ... 91
8.1INTRODUCTION ... 91
8.2RESULTS AND DISCUSSION ... 94
xii
9. CONCLUSIONS ... 117 APPENDIX……….144 Derivation of FRET based dipole-dipole interaction……….……….144
xiii
List of Figures
Figure 2.1.1 E-k diagram for bulk semiconductor crystal and semiconductor nanocrystal. ... 10 Figure 2.1.2 Synthesis set-up in fumehood together (with an inset of the
synthesis reaction flask (top right) at the Demir Lab. ... 12 Figure 2.1.3 Glove box (nitrogen filled), used for storage and preparation of the
chemicals used in the synthesis at the Demir Lab. ... 13 Figure 2.1.4 Absorption spectra of different sized CdTe QDs at room
temperature. ... 14 Figure 2.1.5 Normalized photoluminescence spectra of different sized CdTe
QDs at room temperature. ... 14 Figure 2.2.1.1.1 Absorption spectra of aqueous CdTe QDs at room temperature
with the alequots taken during the growth of these QDs. ... 16 Figure 2.2.1.1.2 Normalized photoluminescence (PL) spectra of the
as-synthesized aqueous CdTe QDs at room temperature. ... 17 Figure 2.2.1.1.3 Quantum yields of different sized CdTe QDs at room
temperature………..17
Figure 2.2.1.2.1 Photoluminescence and absorption of organic CdSe QDs at room temperature (Reproduced with permission after [77].) ... 19 Figure 2.2.1.2.2 TEM image of organic CdSe QDs. The scale bar is 5 nm. ... 20 Figure 2.2.2.1.1 High resolution TEM image of the CdSe/CdS QDs. The scale
bar is 5 nm. ... 22 Figure 2.2.2.1.2 Emission and absorption spectra of the core CdSe and core/shell
CdSe/CdS QDs at room temperature with an increasing number of shell monolayers (ML). The quantum efficiency values are given on each individual graph. ... 23 Figure 2.2.2.1.3 Picture of our highly efficient CdSe/CdS QDs under UV light.
xiv
Figure 2.3.1.1 Absorption profile of one pot synthesis of InP/ZnS core/shell QDs at room temperature along with a picture of the dots under UV-illumination. ... 25 Figure 2.3.1.2 Emission profile of one pot synthesis of InP/ZnS core /shell QDs
at room temperature. ... 25 Figure 2.3.1.3 Absorption spectra of two step synthesis of InP/ZnS core/shell
QDs at room temperature, along with a picture of the dots under UV illumination. ... 27 Figure 2.3.1.4 Emission spectra of two step synthesis of InP/ZnS core/shell QDs at room temperature. ... 27 Figure 3.1.1 Diagram showing the possible excitation and de-excitation paths
within quantum dot pairs. ………29 Figure 3.2.1 Fluo Time 200 Time Resolved Spectroscopy set-up at the Demir
Lab. ……….31
Figure 3.2.2 Dependence of the FRET efficiency on r/R0.. ……….32
Figure 4.3.1 Emission and absorption spectra of the Rhodamine 6G used for the quantum efficiency measurements and the QDs. Black arrow represents the intersection point of the absorption spectra for both species, which is used as the excitation wavelength. ... 35 Figure 5.2.1 Donor ZnCdSe QDs emission and acceptor GFP absorption spectra
at room temperature……….………....41 Figure 5.2.2 High resolution TEM image of the ZnCdSe QDs……….. 42 Figure 5.2.3 Adsorption isotherms of GFP on QD modified surface of QCM
sensor……….. 44 Figure 5.2.4 Single Langmuir adsorption model fit to the adsorption data of
his-tagged GFP on surface bound QD. The red line represents the fit as the black dots denote the data points……… 45 Figure 5.2.5 Mass change monitored in TGA and the derivative of mass change as a function of temperature for the nanocomposite. ……….46 Figure 5.2.6 Comparison of the temperature derivative mass change data for QD
xv
new peaks suggest the formation of new composite material... 47 Figure 5.2.7 PLE intensity ratio of the bare QDs at its emission wavelength of
422 nm compared to the bare GFP at its emission wavelength of 508 nm at room temperature. The insets show the individual PLE intensities of the GFP and the QD alone……….48 Figure 5.2.8 Change in photoluminescence of the donor-acceptor QD-GFP
system with changing A/D concentration ratio (excitation at 315 nm) at room temperature ………49 Figure 5.2.9 Control experiments for the photoluminescence of acceptor GFP
only with the same acceptor concentration, corresponding to the A/D concentration ratio (excitation at 315 nm) at room temperature ………..……….. 49 Figure 5.2.10 Enhancement of the GFP photoluminescence using QDs when
excited with 315 nm monochromatic light at room temperature ……….. 50 Figure 5.2.11 Time resolved photoluminescence decays of the donor changing
with A/D at room temperature …………..………..51 Figure 5.2.12 Donor lifetimes, extracted from time resolved photoluminescence decays, and theoretically predicted, as a function of A/D at room temperature ………..………... 52 Figure 5.2.13 Time resolved photoluminescence decays of the acceptor
changing with A/D at room temperature
………...……….. 53 Figure 5.2.14 Acceptor lifetimes, extracted from time resolved
photoluminescence decays, as a function of A/D at room temperature ………...……….. 53 Figure 5.2.15 Theoretical and experimental FRET efficiencies extracted from
lifetime measurements at room temperature ………..……… 54 Figure 5.2.16 Schematic representation for the energy transfer from QD to GFP (no drawn to scale). Picture shows a QD surrounded by a GFP molecule. “d” represents the average separation distance between the QD and the GFP over which energy transfer takes place. Inset: Dimensions for the GFP molecule ………. 56
xvi
Figure 5.2.17 Room temperature photoluminescence decays of the GFP only, GFP after FRET, and GFP after FRET with controlled enzyme (activated) addition……… 58 Figure 5.2.18 Lifetime modifications of the GFP only, GFP after FRET, and
GFP after FRET with enzyme (activated) addition………. 58 Figure 5.2.19 Lifetime modifications of the GFP only, GFP after FRET, and
GFP after FRET with enzyme (unactivated) addition………. 59 Figure 5.2.20 Room temperature photoluminescence decays of the GFP only,
GFP after FRET, and GFP after FRET with enzyme (unactivated) addition. ... 59 Figure 6.2.1 Room-temperature time-resolved photoluminescence (TRPL) of
amine-functionalized CdSe/ZnS nanocrystal donors (AF/NC-Ds) together with RhB acceptors (RhB-As) (a) at the donor emission wavelength (at 541 nm) and (b) TRPL of non-functionalized CdSe/ZnS nanocrystal donors (NF/NC-Ds) together with RhB acceptors (RhB-As) at 541 nm. Room-temperature steady-state photoluminescence (SSPL) of (c) AF/NC-Ds + RhB-As and (d) NF/NC-Ds + RhB-As. All of the TRPL and SSPL measurements are presented as parameterized with respect to the varied concentration ratios of A/D. (e) FRET efficiency levels (extracted from TRPL) and (f) enhancement factor of acceptor emission with respect to the case of acceptors alone (with no donors), both as a function of A/D ratios. ... 66 Figure 7.2.2 Room temperature absorbance spectra of the two differently sized
aqueous CdTe nanocrystal QDs (emitting at 552 and 525 nm) together with that of the Rhodamine B dye molecules. (b) Normalized room temperature photoluminescence spectra of our aqueous CdTe QDs (donors) selectively chosen to emit at the peak wavelengths of 525 and 552 nm, along with the emission and absorption spectra of the Rhodamine B molecules (acceptors). The donors emitting at 552 nm provide a better spectral match to the electronic structure of these acceptors. ... 75 Figure 7.2.3 SSPL spectra taken at room temperature by adding controlled
amounts of dye acceptors into the aqueous donor solution using CdTe QDs emitting at the peak wavelength of (a) 552 nm and (b) 525 nm. The legends show the corresponding A/D concentration ratios (A/D=1.8–152.8). (Note that these PL intensity levels are measured using the same arbitrary units and that they are presented using the scales as indicated on their plots, for clear visibility.)... 78 Figure 7.2.4 TRPL measurements of donor molecules taken at room temperature
xvii
solution, using CdTe QDs emitting at the peak wavelength of (a) 552 nm and (b) 525 nm, all shown together with their corresponding numerical fits, and along with a comparative analysis of the donor photoluminescence decay lifetimes both for 552 and 525 nm emitting dots as a function of A/D concentration ratio (c). In the last plot, the red (black) dotted baseline represents the lifetime of only donors of 552 nm (525 nm) emitting dots, without any acceptors in the mixture. ... 80 Figure 7.2.5 TRPL measurements of acceptor molecules at room temperature
while varying the A/D concentration ratio, shown along with their numerical fits using (a) 552 nm and (b) 525 nm emitting QDs and comparative analysis of the acceptor photoluminescence decay lifetimes for emission (c) at 581 nm (acceptor peak with a weak donor tail) and (d) at 605 nm (strong acceptor tail with no donor tail) as a function of A/D concentration ratios. In both plots (c) and (d), the dashed baseline represents the lifetime of only acceptors without any donors. ... 83 Figure 7.2.6 Comparison of (a) FRET efficiencies and (b) enhancement of the
acceptor emission at room temperature, using 552 nm and 525 nm emitting CdTe QD donors, as a function of the A/D concentration ratio. ... 89 Figure 8.2.1. Chemical structure of the myristic acid (left) and PMMA (right). 94 Figure 8.2.2 Contact-angle measurement of the free standing InP/ZnS film
showing the hydrophobic property with contact angles of ~890 (for left and right). ... 95 Figure 8.2.3 Photograph of the 50 cm × 50 cm PMMA-InP/ZnS QD membrane
under room light (left) and UV illumination (right). ... 95 Figure 8.2.4 XPS spectra of InP/ZnS QD only, PMMA only, and the composite
membrane for elemental carbon analysis. ... 97 Figure 8.2.5 XPS spectra of the InP/ZnS QD-PMMA membrane. ... 99 Figure 8.2.6 Stress-strain measurement of a 35 μm thick InP/ZnS QD-PMMA
film... 100 Figure 8.2.7 Normalized room temperature photoluminescence (solid line) and
absorption (dashed line) spectra of the donor and acceptor InP/ZnS QDs. Transmission electron microscopy (TEM) image of the donor/acceptor QDs (inset). ... 101 Figure 8.2.8 Time resolved photoluminescence (TRPL) spectra of the donor QD
without the acceptor (top) and the donor QD with the acceptor (bottom), measured at the donor emission wavelength of 490 nm, as a function of
xviii
decreasing sample temperature (inset). The exponential fits of the observed decays for the donor (with and without acceptor) are also given... 102 Figure 8.2.9 Temperature dependent photoluminescence intensity of the donor
(top) and acceptor (bottom) QDs, extracted from the time-resolved photoluminescence measurement. The photoluminescence intensity is extracted from the set-up using the same time interval for the photon counts. ... 104 Figure 8.2.10 Theoretical (red circles) and experimental (black squares) FRET
efficiencies as a function of temperature. ... 105 Figure 8.2.11 Donor energy transfer rate calculated using the experimentally
measured lifetime values as a function of temperature. ... 105 Figure 8.2.12 (A) TRPL spectra of the acceptor without the donor (at 590 nm);
(inset) the acceptor lifetimes (with and without the donor). (B) TRPL of the acceptor with the donor (at 590 nm). (C) TRPL of the acceptor (without the donor) (at 640 nm, far from the donor emission tail), (inset) the acceptor lifetimes (with and without the donor). (D) TRPL of the acceptor (with the donor) (at 640 nm). All curves and data are given parametrized with respect to or as a function of the temperature and the lifetimes are fit with triple exponentials. ... 107 Figure 8.2.13 (a) Donor-Acceptor (D-A) schematic for a single donor (D) and
acceptor (A). (b) Energy diagram for the D-A pair energy transfer process. Blue dashed lines represent the absorption process of the QD (donor/acceptor). Blue solid lines show fast relaxation process. Red dashed lines illustrate light emission process (relaxation from the lowest excited state to the ground state). Black solid lines represent the energy transfer from the donor to the acceptor. Horizontal black dashed line shows the Coulomb interaction between the donor and acceptor. ... 112 Figure 8.2.14 Steady-state room temperature photoluminescence spectra of the
donor only, acceptor only and hybrid film. Steady-state room temperature photoluminescence spectra of the donor only, acceptor only and hybrid film of the same when the hybrid emission is fit to the donor and acceptor emissions as Gaussian curves (inset). ... 114 Figure 8.2.15 Emission spectra of the color-conversion white LED (WLED)
xix
List of Tables
Table 6.2.1 List of quantum yields, Förster radii, average decay lifetimes and their χ2
error limits at the donor emission wavelength, and FRET efficiencies, all for different concentration ratios of A/D when using amine- and non-functionalized CdSe/ZnS nanocrystal donors. ... 67 Table 7.2.1 TRPL measurement analysis of the 525 nm emitting donors at 525
nm varying the A/D concentration ratio. ... 84 Table 7.2.2 TRPL measurement analysis of the 525 nm emitting donors at 581
nm varying the A/D concentration ratio. ... 84 Table 7.2.3 TRPL measurement analysis of the 525 nm emitting donors at 605
nm varying the A/D concentration ratio. ... 85 Table 7.2.4. TRPL measurement analysis of the 552 nm emitting donors at 552
nm varying the A/D concentration ratio. ... 85 Table 7.2.5 TRPL measurement analysis of the 552 nm emitting donors at 581
nm varying the A/D concentration ratio ... 86 Table 7.2.6 TRPL measurement analysis of the 552 nm emitting donors at 605
nm varying the A/D concentration ratio. ... 86 Table 7.2.7. TRPL measurement analysis of the 581 nm emitting acceptors at
581 and 605 nm varying the A/D concentration ratio. ... 87 Table 8.2.1 Experimental and theoretical changes in the lifetime of the acceptor
alone and in the hybrid film with the donor. ... 108 Table 8.2.2 Experimental and theoretical changes in the lifetime of the donor
alone and in the hybrid film with the acceptor, along with the FRET
xx
1
Chapter 1
Introduction
Efficient light harvesting for biolabeling has been one of the scientific challenges to date. The detection of molecules, tissue imaging, and cell tracking require better imaging, higher resolving power, and more efficient use of the incident light to overcome the existing limitations. The fluorophore organic dyes and fluorescent proteins are among the early examples of the fluorescent tags used widely in related research for the detection of targeted cells and bio-labeling [1,2,3].
The wide-scale use of the organic dyes and fluorescent proteins have opened many possibilities. Control of the chemical structure and modifications of the functional groups make these fluorophores good candidates for superior bio-detection and tagging systems because of their biocompatibility [4,5]. However, these fluorophores exhibit a characteristic optical absorption and emission spectra which cannot be tailored easily. The organic dyes and fluorescent proteins possess narrow absorption windows and they cannot be excited beyond their characteristic spectral excitation ranges. Also, their absorption and emission spectra overlap significantly. As a result, the absorption suppresses the emission, limiting their performances and the possible use for high-end applications [6,7,8
Starting in 80s, there was a breakthrough in the science of colloidal particles with the invention of nanocrystal quantum dots (QDs) [
].
9], the tiny bulbs which are superior to the existing fluorophores, since they have size dependent emission characteristics, an order of magnitude higher extinction coefficients
2
and brightness, and broader excitation windows, as compared to the other members of the fluorophores [10,11]. With the introduction of this new member to the fluorophores family, the QDs have gained substantial interest in the last few decades for many prospective applications, i.e., from solar cells and light emitting diodes [12,13], to in-vivo bio-imaging and photodynamic therapy applications [14,15]. Beginning with 90s, the method of hot injecting precursors during colloidal QD synthesis [16,17] allowed for highly monodisperse and high quantum yield particles. Owing to their outstanding optical characteristics, the nanocrystal QDs have been considered as an alternative to overcome the dominant use of organic dyes and fluorescent proteins.
From the applications point of view, because of their size tunable superior properties, semiconductor nanocrystals have been used in optoelectronics and biorelated applications. Solar cells, detectors, and light emitting diodes are among the well known examples for the use of the QDs in optoelectronics. In solar cells, QDs have opened the new path for the 3rd generation solar cells. QDs offer the potential to overcome the thermodynamic limiting efficiency of the solar cells with multi-exciton generation [18
In their work Huynh et. al. demonstrated the solar cells composed of CdSe nanorods in P3HT polymer blends with external quantum efficiencies of 59% [
].
19]. In their work, Luther et al., demonstrated the solar cells using PbSe QDs with overall efficiency of 2.1% under AM 1.5G solar radiation, reaching external quantum efficiency levels of 55-65% in the visible [20]. Recently, the Sargent Group have demonstrated colloidal QD solar cells using PbS nanocrystals together with TiO2 nanoparticles doped by Zr, with 5.6%
efficiency, improving the charge spearation [21]. In QD sensitized solar cells, QDs come into play as the sensitizers instead of the dyes used in dye sensitized solar cells. They are expected to boost the Si solar cells at reduced costs. Lee et al. demonstrated the use of CdSe QDs with efficiencies larger than 1% when used with TiO2 [22]. Using the wider gap ZnS overcoating CdSe cores, Toyoda
3
et al. demonstrated efficiency levels of >2% [23]. Recently, Zhang et al. studied the structural properties of the photoelectrode and reported the highest QD sensitized solar cell efficiency of 4.79% [24].
The first reports demonstrating LEDs made from colloidal QDs had relatively poor efficiencies [25,26]. In 2002, electroluminescence has been shown in monolayers of the core/shell QDs sandwiched between the electron and hole transport layers by Coe et al. [27]. This study is one of the first reports to open the way for the QD-LED research later followed by other reports aiming for higher performance [28,29]. Different than these previous reports that present such QD-LEDs, our group have demonstrated tunable photometric performance of white color-conversion LEDs, (WLED) based on the quantum dots used as luminophores [30]. Recently, research efforts using QDs within the display applications have emerged owing to the advances in the mature synthesis of these QDs together with their successful LED demonstrations [31,32
One of the major steps for the QDs to be used in biorelated applications is their biocompatibility. Since water is the natural media for the living things, the solubility of QDs is a crucial step for using them as an active component in
].
In bioapplications, the use of QDs have evolved during the past few last years due to the need for a better imaging contrast, enabling long live cell imaging, stability and multicolor labeling. Due to the intrinsic drawbacks of using organic fluorophores, semiconductor nanocrystals have been an alternative in biorelated targeting, sensing, and imaging applications. As compared with the organic fluorophores, semiconductor nanocrystal QDs offer size dependent emission characteristics, narrow and symmetric emission spectra preventing crosstalk in multicolor labeling, higher quantum yield and broad absorption spectra, providing increased imaging frequency in multicolor labeling and one order of magnitude higher photostability, making them a good candidate for long term live cell imaging.
4
living organisms. The ligands attached to the QDs determine the solubility of the QDs in various media. Therefore, unless synthesized in water, the QDs need to be dissolved in water before being utilized in bioapplications. The solubility in water is achieved by ligand exchange [33]. By using the ligand exchage, the QDs are able to be dissolved in water but it comes at the cost of decreased quantum yields, which has been a major issue to address in the ligand chemistry for inorganic quantum dots. One of the other crucial factors is the functionalization of the QDs to provide the biocompatibility. Surface capping methods and functionalizations using different biofunctional mechanisms have been employed specific to various applications [34,35].
Due to the fact that the QDs have order an of magnitude higher lifetime than the organic dyes, they have been employed to reduce the naturaly occuring autofluorescence of the cells, which is comparable with the lifetime of the organic dyes. This enables the enhancement of the image contrast by the use of the QDs [36]. The QDs broad absorption spectra makes multicolor labeling possible for in vivo applications, where different biomarkers are tagged by using different QDs [37,38]. Imaging by the use of the QDs have found a wide area of interest in the imaging of the cancer cells. For example, a polypeptide-quantum dot hybrid assembly have been utilized for the detection of cancer cells recently [39]. In another study, the detection of human prostate cancer using QDs encapsulated in a triblock polymer has been demonstrated by Nie Group [40].
Immunoglobin G and streptavidin linked quantum dots have been used for labeling the breast cancer in the work of Wu etal. [41]. Besides, QDs have been employed as selective species to probe the targeted cells [42]. They have been utilized for live tracking the biomolecular transportation by Dahan et al. Not only for the biolabeling and cell imaging, QDs have been employed but also as drug delivery agents [43].
5
One of the key problems in the application of QDs in living cells is their possible toxitocity. The toxitocity of the QDs depends on many factors. The physical properties of the QDs as well as their surface functionalization play an important role for the mechanisms governing the toxicity. One of the major problems in the toxicity is the generation of the reactive oxygen species during the excitation of the QDs. Ipe et al. showed that the formation of the reactive oxygen species has been reduced by overcoating QDs with a shell material [44].
Apart from the systems of QD-bioconjugate complexes, the QDs have also been used together with organic dyes and fluorophores. This is because of the narrow emission bandwidth of the QDs, well separated from their absorption spectra. The nonradiative energy transfer mechanism employing both the QDs and the fluorophores has served as a nanoruler for the purpose of probing the changes in the conformational structure of the molecule. Using the energy transfer mechanism between the QDs and fluorophores, it is possible to track the molecular distance, which has been one of the major overarching goals of the QD-fluorophore systems [45
Medintz et al., discuss the design of biosensors for the detection of the maltose based on the FRET mechanism utilizing QDs [
]. Thus far, FRET has also been used as a powerful tool for the determination of the biomolecular activity and the determination of the intermolecular species within the moleculas, as well as the conformational changes. The dipole-dipole interaction among the longer exction lifetime donor and the shorter lifetime acceptor species facilitate the FRET mechanism, which has been further detailed in the coming chapters. Till date FRET has been used in various quantum dot-organic dye and fluorescent pairs for various goals, except for light harvesting, which is the topic of this thesis. Some of the previous examples will be outlined in here.
46]. In another study, the same group have employed the QDs as acceptor molecules together with the dye labeled proteins and reported that they have not observed FRET between these
6
pairs implying that the exciton lifetimes play a critical role in the FRET based systems [47].
Monitoring the hybridization of the QD-dye pairs by the FRET mechanism and labeling the functionalized DNA sequence have been studied by the Banin Group [48]. Within our group, the enzymatic control of the FRET among the bilayers of QD-peptide complexes have been demonstrated [49]. Samia et al. discussed the photodynamic therapy using the QDs triggering the photodynamic therapy agent facilitated by FRET [15]. The use of CdTe QDs for the detection of cancer markers with the FRET based biosensing mechanism has been demonstrated in the work of Liu et al. [50]. Another example application has been reported by the Nocera Group, demonstrating the energy transfer from CdSe/ZnS QDs to pH sensitive dye molecules as to be employed as a pH sensor [51]. The Mattousi Group have employed the QDs together with dye molecules to study the FRET based multiplexing, namely using single excitation source to excite different molecules simultaneously [52]. The work of Bagalkot et al. is a good example of the FRET mediated cancer imaging and drug delivery systems [53]. QDs have been employed further as both donor and acceptor species in cascaded energy transfer studies for detection of bioactivity in the work of the Rogach Group [54]. Our group has also studied FRET among the bilayers of CdTe QDs for tuning the color chromacity [55
In the scope of this thesis work, different than the previous works of our group and the others, we propose and demonstrate a versatile, tunable class of light harvesting composites containing the QD-organic dye and QD-fluorescent protein complexes mediated by the nonradiative energy transfer to overcome the limitations of the organic dye molecules and fluorescent proteins. Here, the nonradiative energy transfer between the organic dye pairs and QD-fluorescent proteins has been studied in detail. The light harvesting resulting
]. In addition to all above, other examples of the QDs-organic dye FRET studies reported in the previous literature have been explained in relevance to the presented thesis work in the related chapters.
7
from the energy transfer, together with a detailed study of the time resolved kinetics, has been implemented for the first time. In addition, the large-area membranes of flexible, stand-alone QD-polymer composites have also been demonstrated. Following the Introduction in Chapter 1, the organization of the rest of this thesis is given as follows:
Chapter 2 presents the background information of the nanocrystals, their optical properties and the synthesis studies of different sized CdSe, CdSe/CdS, CdTe, and InP/ZnS QDs.
Chapter 3 is devoted to the discussion of the de-excitation paths of quantum dots including the energy diagram, and introduction of the Förster-type nonradiative energy transfer, along with the theoretical derivation showing the r-6 dependence of the energy transfer given in the Appendix.
Chapter 4 explains the experimental methods used in the context of the thesis.
Chapter 5 presents the demonstration of enhancement in the emission of the green fluorescent proteins attached to the QDs. The theoretical model of the resulting nonradiative energy transfer is also explained in the context of this chapter.
Chapter 6 demonstrates the use of positively charged CdSe/ZnS core/shell QDs for the energy transfer to organic dye molecules, emphasizing the charge effect to mediate the interaction among the particles with the highest reported FRET efficiency levels.
Chapter 7 describes the light harvesting of dye molecules mediated by FRET in solution by using different sized water based CdTe QDs.
8
Chapter 8 presents the energy transfer among different sized Cd-free QDs as well as the study of the temperature dependent emission kinetics. The demonstration of the large-area membranes of the QD-polymer composites and their use for white light generation with a performance level beyond the state-of-the art is also included in this chapter.
Chapter 9 concludes this dissertation, summarizing the achievements of this thesis work along with a future outlook.
9
Chapter 2
Semiconductor Nanocrystals
2.1 Background information
Semiconductor nanocrystals, also known as the colloidal quantum dots (QDs), are particles consisting of 100-1000 atoms in the form of a crystal structure. The band gap engineering, made possible by choosing the right size of the nanocrystals, make them a great candidate for a wide range of possible applications. The three-dimensional quantum confinement results in the pronounced characteristics on these optical properties. Unlike the continuum energy states in bulk semiconductors, when the size of the crystal decreases, as in the case of nanocrystals, the energy levels start to get discrete. The phenomenon of strong quantum confinement arises, when the particle size is typically close to the exciton Bohr radius of the material. Depending on the size of the nanocrystal, greater or smaller than the exciton Bohr radius, the confinement of the nanocrystals is regarded as weak, intermediate or strong [56].
10
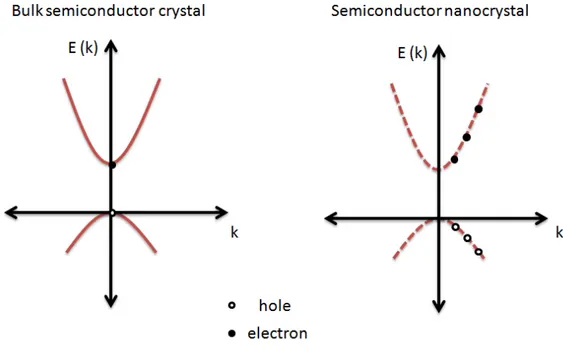
Figure 2.1.1 E-k diagram for bulk semiconductor crystal and semiconductor nanocrystal.
In a typical way, the incident photon with an energy greater than the band gap energy of the nanocrystals is absorbed. Subsequently, a bound electron and hole pair with Coulombic interaction, called exciton, is created. In order to fit their wavefunction in the finite size crystal, quantum confinement arises. In bulk semiconductors, since the size of the exciton is much smaller than the crystal size, and the charge carriers are free to move, i.e., not confined. The E-k diagram for bulk semiconductor crystal and semiconductor nanocrystals is given in Fig. 2.1.1. The band gap of a QD is given for the first excited electron state as,
(
)
2 2 2 2 2 2 2 0 1.8 2 2 4 QD BULK gap gap e h e E E terms smaller m r m r r π π πεε = + + − + 2.1.1where m and e m are the effective masses of the electron and the hole, h
respectively,ε0 is the permittivity of free space,
ε
is the relative permittivity, e11
in Eqn. 2.1.1 correspond to the energy of the first excited state, whereas the fourth term is due to the Coulombic interaction of the electron-hole pairs, and shadowed by the first terms in Eqn. 2.1.1, for the low-dimensional systems.
Using the quantum confinement, it is possible to engineer the emission and absorption characteristics of the QDs. Smaller sized dots have blue shifted emission and absorption profile as compared to the larger sized QDs, due to their effectively larger band gap, as clearly observed from Eqn. 2.1.1. The chemical composition and the stochiometric ratio between the elements also determine the emission wavelength of the resulting nanocrystal synthesized. Designing the nanomaterial of interest is possible, thanks to the ongoing research efforts on the synthesis of the colloidal QDs.
Till date, many different kinds of quantum dots have been studied for their synthesis and applications. The particles of interest are mainly the II-VI, III-V and IV-VI group elements. In accordance with the range of their emission wavelengths, CdSe, CdTe, and CdS are among the mature examples of the II-VI group [58,59,60,61], together with III-V type InP based dots, emitting in the visible range [62,63], III-V ZnSe and ZnS structures govern the UV range, [64,65], whereas IV-VI group PbSe and PbS emit in the n-IR and IR emission range [66,67].
Besides core nanocrystals, there are also core/shell type QDs, which typically consist of a wider band gap material surrounding the core nanocrystal (e.g., type 1 core/shell QDs). The wider band gap shell serves as a potential barrier for the confinement of the wavefunction into the core. Few examples are CdSe/CdS, CdSe/ZnS, and InP/ZnS where the shell material is overcoated on the core to provide stability and enhanced emission [68,69,70
One of the key factors in the QD synthesis is the ligands and the surfactants associated with the QDs. The ligands surrounding the nanocrystals provide
12
stability, make the QDs soluble in the appropriate environment and prevent them from agglomeration [71]. In the case of chemical interactions to make a composite structure with a QD; the ligand chemistry is an important area for bridging the QD to the desired part of the integrated species, e.g., a protein, and DNA. [72] Using the appropriate precursors for the synthesis, the ligand, and the solvent, the synthesis is carried out by controlled heating under inert atmosphere within the fumehood (see Fig. 2.1.2).
Figure 2.1.2 Synthesis set-up in fumehood together (with an inset of the synthesis reaction flask (top right) at the Demir Lab.
13
Figure 2.1.3 Glove box (nitrogen filled), used for storage and preparation of the chemicals used in the synthesis at the Demir Lab.
As mentioned previously, the optical properties of QDs are engineered by changing the size of the particles. The absorption features of QDs are given below (Fig. 2.1.4) for a series of different sized dots. Their optical absorption increases through the UV portion of the spectra. The peak in the absorption spectra is called the first excitonic peak, and depending on the characteristics of the QD, there may be other pronounced peaks as well, corresponding to higher photon energies.
14
Figure 2.1.4 Absorption spectra of different sized CdTe QDs at room temperature.
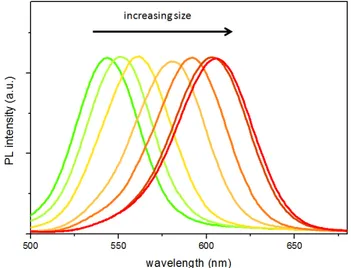
The emission spectra, however, is narrow and Gaussian like (see Fig. 2.1.5), separated from the absorption peak by Stokes shift. The full width at half maximum (FWHM) value of the QD emission is typically determined by the monodispersity of the QDs in the inhomogenous broadening regime, used as a figure of merit for their optical performance.
Figure 2.1.5 Normalized photoluminescence spectra of different sized CdTe QDs at room temperature.
15
2.2 Synthesis of II-VI QDs
The nanocrystals undergo various stages during the growth. These are the nucleation, growth, and isolation of the particles of proper size. In order to have monodisperse particles, which have a small size variation, the nucleation and the growth stages should be carried out at different temperatures, in the case of the hot injection method, or should be heated for long times at the same temperature [73
2.2.1 Synthesis of core QDs
]. The methods introduced here are used during the synthesis of the QDs employed in this thesis work.The materials of interest for the synthesis of the II-VI QDs are the aqueous CdTe, organic CdSe, and core/shell structured CdSe/CdS QDs.
2.2.1.1 Aqueous CdTe QD synthesis
In the synthesis of aqueous CdTe QDs, cadmium per chlorate hexahydrate (Cd(ClO4)2×6H2O), thioglycolic acid (TGA), aluminum telluride (Al2Te3),
sulfuric acid (H2SO4), and sodium chloride (NaCl) are obtained from vendors
and directly used without further purification.Our synthesis procedure follows the method previously described in the literature [74,75
×
]. In our synthesis, 4.59 g of Cd(ClO4)2 6H2O is dissolved in 0.5 L of Milli-Q water in three-neck
reaction flask. 1.33 g of TGA is added to the mixture, which turns into milky appearance. The pH of this mixture is then increased to 11.8 – 12.0 by dropwise addition of NaOH upon vigorous stirring. After this step, the reaction mixture becomes clear or slightly turbid. To prepare tellurium precursor, 0.8 g of Al2Te3
is transferred into a small three-neck flask in the glove box and then deaerated by passing Argon (Ar) for 50-60 min in the setup. 10 mL of deaerated 0.5 M H2SO4 is slowly poured into Al2Te3 lumps to produce H2Te gas, which is carried
16
out by a slow Ar flow and bubbled through the mixture containing cadmium precursor for 40-50 min. The resulting red-black mixture is refluxed at 100 oC to obtain the desired nanocrystal size. The reaction mixture is then cooled to room temperature and filtered. The CdTe QDs are finally separated by size selective precipitation. The size selective precipitation is a post synthesis treatment and allows for separation of similar sized QDs in the same batch, thus providing better monodispersity after the synthesis. We use the CdTe QDs emitting in visible. The n-IR emitting CdTe is also possible by using mercaptopropionic acid (MPA) instead of TGA [76].
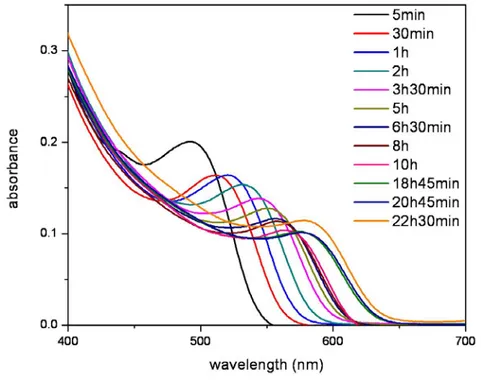
Figure 2.2.1.1.1 Absorption spectra of aqueous CdTe QDs at room temperature with the alequots taken during the growth of these QDs.
17
Figure 2.2.1.1.2 Normalized photoluminescence (PL) spectra of the as-synthesized aqueous CdTe QDs at room temperature.
18
As shown in Fig. 2.2.1.1.1 and 2.2.1.1.2, the CdTe QDs grow in size with increasing the time associated with the synthesis. The possible emission peak wavelength achievable with the recipe followed runs around from 525 to 610 nm maximum using the thioglycolic acid as the surfactant. The trend of the quantum yield is increasing when the particles grow bigger in size up to a certain point, showing the increase in the stability of the particles (see Fig. 2.2.1.1.3). However, the quantum yield starts decreasing after long time exposure to heating due to the internal growth dynamics within the reaction flask. The resulting QDs have years long shelf life when stored in cold and dark conditions.
2.2.1.2 Organic CdSe QD synthesis
In a typical synthesis of CdSe nanocrystals, Cadmium Oxide, CdO (Acros Org.), Oleic Acid, OA (JT Baker) 1-Octadecene, ODE (Acros Org.) Selenium powder (Acros Org.), 1-Hexadecylamine, HDA (Acros Org.) and Trioctylphosphine, TOP (Sigma Aldrich) are used as pure as supplied from the companies without further purification. The cadmium stock solution is prepared by mixing 513.6 mg CdO, 6.3 mL OA and 40 mL ODE. The mixture is evacuated with raising the temperature at 100 oC and then heated to 300 oC until a transparent solution is achieved. The injection solution is prepared by adding 0.4 mL of Se solution (1 M in TOP, prepared in glove box at 200 oC) to 1.6 mL of TOP and 2 mL of ODE. The synthesis is carried out under fumehood, with a Shlenk line connected to vacuum and pure Ar line. During the synthesis 4 mL of Cd stock solution is mixed with 2 g TOPO, 2 g HDA and 8 mL of ODE in a 3-neck glass flask. The mixture is evacuated under Schlenk line with raising the temperature to 100 oC under stirring. The mixture is then heated up to 300 oC under Ar flow and the temperature for injecting 4 mL of TOP-Se-ODE mixture is set to be
19
280 oC. The nanocrystals are grown under 250 oC within few minutes. The resulting QDs have a quantum yield of about 35%.
The synthesized CdSe nanocrystals synthesized have been used in our experimental work [77]. The emission and absorption spectra of the CdSe is given in Fig. 2.2.1.2.1 and the high resolution TEM image is given in Fig. 2.2.1.2.2.
Figure 2.2.1.2.1 Photoluminescence and absorption of organic CdSe QDs at room temperature (Reproduced with permission after [77].)
20
Figure 2.2.1.2.2 TEM image of organic CdSe QDs. The scale bar is 5 nm.
2.2.2 Synthesis of core/shell QDs
The synthesis of core/shell QDs is desired because of the well passivation of the core QDs, together with their resulting highly emissive profile. The core/shell QDs are regarded as type I or type II depending on the core and shell band alignment. In the type I architecture the electron and holes are confined in the core, whereas in the type II QDs, the electron is located in the core while the hole is in the shell, thus decreasing the overlap integral between their wavefunctions. The material of interest here is type I CdSe/CdS core/shell architecture. One of the important points in choosing the right material for overcoat is that there should not be a considerable lattice mismatch between the core and the shell. Otherwise, the resulting core/shell material will be suffering from the strain build-up. Starting with the core material, there are various recipes for overcoating. Unless the calculations are carried out precisely, the resulting core/shell QDs do not provide high quality optical properties. Here we follow a method of successive ion layer adsorption reaction (SILAR). In this approach, starting with the core material, first, the concentration of the core
21
material as well as the size of the core is calculated precisely using the absorbance value obtained from the spectrophotometer. The logic behind this method is to calculate the amount of shell material for each and every monolayer (ML) coated on the existing core. The amount of shell precursors for a single QD is calculated, and then multiplied with the total core QD amount, in order to predict a correct calculated value of shell precursor. As the number of monolayers increase, the next monolayer is coated with the appropriate amount of precursors taking into account the previous monolayer thickness increase.
2.2.2.1 CdSe/CdS core/shell QDs
The synthesis is based on the recipe followed by Bawendi Group [78
Before the shell material is injected, we follow the preparation of Cadmium oleate. As a precursor for the synthesis, CdO dissolved in oleic acid (OA) and octadecene (ODE) is prepared under ambient atmosphere at 300 oC and kept in the glove box environment as cadmium oleate ready for the shell coating. For the overcoating, Cd-oleate and sulfur (S) dissolved in TOP is prepared in a glove box, taken in glass syringes and left aside. On the other side, CdSe, which is already prepared, is mixed with oleylamine and ODE in the system, and left ]. For the synthesis of the core material, we use cadmium oxide (CdO), tetradecylphosphonic acid (TDPA) as the ligand, and octadecene (ODE) as the solvent. The mixture with pre-determined concentrations is heated up under inert atmosphere to 273 oC, followed by the injection of Selenium (Se)-Tributhylphosphate (TBP) mixture. The desired core size is achieved upon continuing the synthesis after the injection of the Se precursor. Once the core material is ready, it is cleaned well from the excess ligands, using acetone-methanol extraction by centrifuging and dissolved in fresh hexane. Approximately 10 µL of the synthesized volume is used to determine the core size and the concentration.
22
under vacuum for the evaporation of the hexane. At 180 oC, significantly below the core growth temperature, the Cd and S solutions are injected dropwise using a syringe pump and the formation of shell ML is completed. This kind of a complete and careful study results in highly efficient (near unity quantum efficiency), monodisperse nanocrystal QDs (see Fig. 2.2.2.1.1. for our high resolution TEM image), with a <30 nm emission FWHM value of a desired size. Fig. 2.2.2.1.2 shows the emission and absorption spectra of the core CdSe and CdSe/CdS core shell quantum dots synthesized. The quantum efficiency changes with the monolayers. Increasing the number of monolayers, the passivation increases. However, at the same time, induced strain also increases. At the very end, annealing increases the overall efficiency.
23
Figure 2.2.2.1.2 Emission and absorption spectra of the core CdSe and core/shell CdSe/CdS QDs at room temperature with an increasing number of shell monolayers (ML). The quantum efficiency values are given on each individual graph.
24
2.3 Synthesis of III-V QD synthesis
2.3.1 InP/ZnS QD synthesis
All reactions are performed under inert Ar atmosphere on a Schlenk line or in a glove box. For the synthesis of the green emitting donor InP/ZnS QDs, we followed the recipe by Reiss and coworkers [79]. In a typical one pot synthesis, 0.1 mmol Indium Myristate (prepared by dissolving Indium Acetate in Myristic Acid, In:MA:1:4.3), 0.1 mmol Zinc Stearate, 0.1 mmol Dodecanethiol (DDT) and 0.1 mmol Tris(trimethylsilyl)Phosphine (TMS-P) are dissolved in 8 mL Octadecene, mixed in a 3-necked 25 mL flask and evacuated at room temperature. The mixture is quickly heated to 300 ºC under Ar or N2 flow, and
the growth of the QDs occurs in minutes after the targeted temperature is achieved. Longer heating times result in shifting of emission peak. However, not only the heating time, but also the ratio of the chemicals used determines the optical properties of the resulting QDs. Increasing the concentration of the Myristic Acid in Indium Myristate, the emission red-shifts. Decreasing the DDT concentration blue-shifts the emission with decreasing the quantum yield. The QDs with FWHM values of 40-50 nm with a QE maximum of ~35% are achieved using this method described here. The absorption and emission profiles of the one pot synthesis of InP/ZnS QDs are given in Fig. 2.3.1.1 and Fig. 2.3.1.2.
25
Figure 2.3.1.1 Absorption profile of one pot synthesis of InP/ZnS core/shell QDs at room temperature along with a picture of the dots under UV-illumination.
Figure 2.3.1.2 Emission profile of one pot synthesis of InP/ZnS core /shell QDs at room temperature.
In order to achieve orange/red emitting QDs, a modified version of a previous recipe [80] is used. For the core InP QDs, 0.1 mmol Indium Chloride, 0.1 mmol
26
Stearic Acid, 0.08 mmol Zinc Undecylenate, and 0.2 mol Hexadecylamine are dissolved in 3 mL ODE and heated to 240 ºC under mixing in inert atmosphere. At that temperature the phosphor precursor (0.5 mL Tris(trimethylsilyl) Phosphite dissolved in octadecene, c = 0.2 mmol/mL) is injected and, after the core growth is established at 220 ºC for 20 min, the mixture is cooled to room temperature. For the shell growth, 0.3 mmol Zinc Undecylenate is mixed with the prepared core QDs and evacuated well before heating. The solution is then heated up to 220 ºC and 1 mL of Cyclohexyl Isothiocyanate/octadecene solution (c = 0.15 mmol/mL) is injected as the sulfur source followed by increasing the temperature to 240 ºC and growth till the desired emission wavelength is achieved. The injection temperature of the core and shell determines the emission wavelength of the QDs synthesized. The best results achieved by injecting the core precursors at 240 ºC and the shell precursors at 220 ºC. Increasing the injection temperatures for the core and shell precursors red-shifts the emission. Fig. 2.3.1.4 and 2.3.1.4 shows the emission and absorption profiles of the different sized InP/ZnS QDs synthesized using two step approach.
Similar to the one pot synthesis approach, the quantum yields of the red-emitting QDs achieved by using a two step approach also results in relatively large FWHM values with smaller quantum yields compared to their II-VI counterparts. One possible explanation for such a kind of relatively low quality nanocrystals in the case of III-Vs is their surface trap states preventing the formation of high qua lity material [81].
27
Figure 2.3.1.3 Absorption spectra of two step synthesis of InP/ZnS core/shell QDs at room temperature, along with a picture of the dots under UV illumination.
Figure 2.3.1.4 Emission spectra of two step synthesis of InP/ZnS core/shell QDs at room temperature.
28
Chapter 3
Nonradiative Energy Transfer
3.1 Excitation and de-excitation paths
Förster type nonradiative energy transfer can be modeled as a dipole-dipole interaction. Figure 3.1.1 illustrates the schematic representation of the donor and acceptor quantum dot species, together with their energy diagram showing the excitation and de-excitation paths as well as the energy transfer process. Here, the incident photon with energy (ωlaser) larger than the band gap of the donor is absorbed by the donor and the acceptor (blue dashed line). The absorption of the incident photon is a relatively fast process and takes place within 10-15s. The photoexcited electron at higher energetic states relaxes back to the lowest excited energy state. This relaxation occurs within 10-12-10-10 s [82]. The donor in the absence of the acceptor completes the process by recombination of the electron-hole pairs (red dashed lines). If this is a radiative recombination, the emission takes place in 10-10-10-7 s. When there is an acceptor QD in close proximity of a donor QD, there is a Coulombic interaction between the donor and the acceptor (represented by the black dashed line) due to the transient dipole moment and there is a probability of the energy transfer taking place. Satisfying the requirements of FRET, which will be explained in the following lines, there emerges a new possible energy transfer channel for the donor, in addition to the recombination channel. In the case of FRET, the excitation energy is transferred nonradiatively from the donor to the acceptor rather than yielding recombination in the donor. Due to the energy transfer, the excitation
29
energy is fed to the acceptor side and contributes to the subsequent photoluminescence of the acceptor. The size of the red arrow in the scheme depicts the increase in the absorption emission and the size of the green arrow shows the decrease in the donor emission as a result of the Förster type energy transfer mechanism.
Figure 3.1.1 Diagram showing the possible excitation and de-excitation paths within quantum dot pairs.
3.2 Förster type Nonradiative Energy Transfer
Mechanism
Förster resonance energy transfer (FRET) mechanism is a nonradiative-type energy transfer pathway that occurs between two close resonant molecules. It was proposed by Perrin [83
FRET is the transfer of the excitation energy from the donor molecule to the acceptor molecule that is in very close proximity. In FRET mechanism, the ] and Förster was the one after whom the mechanism was named, as Förster explained and resolved the discrepancies in the model taking into account the spectral bandwidth of the donor and acceptor (see Appendix for the derivation of the r-6 dependence of FRET). FRET has been used especially in biology as a spectroscopic nanoruler to determine the distance between the molecules.
30
excited donor molecule transfers its excitation energy before the energy is radiated (in means of a photon emission). Therefore, it should not be confused with the radiative energy transfer, where the intermediate photons emitted by the donor, is absorbed by the acceptor. For the FRET to occur, the donor emission spectra should overlap with the absorption spectra of the acceptor molecule, the acceptor (not necessarily emitting) should have a high extinction coefficient, the donor should have a high quantum yield, and the donor and acceptor species should be in close proximity (typically <10 nm). Förster theory is based on dipole-dipole electromagnetic interaction under the long wavelength approximation. In cases where the molecules are <1 nm distance apart from each, if their wavefunctions start to overlap, the electron migration (not the excitation energy transfer) occurs, which was generalized by the Dexter theory. This does not happen for our core/shell nanocrystal structures where the wavefunction is fully confined.
In order to verify that the energy transfer is Förster like, not only steady state fluorescence measurement, but also time resolved spectroscopy is essential. As the donor is feeding the acceptor molecule with its excitation energy, the mechanism is clearly observed with the change in the lifetime of the donor molecule. The lifetime of the donor species decreases, whereas the acceptor lifetime increases due to the energy feeding. The commonly used method for determining the lifetime of the emitting species is based on the time correlated single photon count (TCSPC) method. In this method, the emitting sample of interest is excited by a short pulse of the excitation source (laser diode, or light emitting diode) and the photons are counted individually one after the other, at the end building up an histogram as the data is collected for sufficiently enough time period. The method is well understood and mature to be built up on a desk-top equipment system (see Fig. 3.2.1).
31
Figure 3.2.1 Fluo Time 200 Time Resolved Spectroscopy set-up at the Demir Lab.
The rate of energy transfer in FRET has an r−6dependence given as
6 0 1 t D R k r τ = 3.2.1
where kt is the rate of the energy transfer, and τD is the donor lifetime in the absence of the acceptor. Here the R0 is given by
1
2 4 6
0 0.211( D ( ))
R = κ n Q J− λ 3.2.2
and known as the Förster radius, radius at which the transfer rate and the decay rate of the molecule is equally probable, and the FRET efficiency is 50%.κ2is the orientation factor; nis the refractive index of the media; Q is the quantum D
32 4 0 ( ) D( ) A( ) J λ I λ ε λ λ λd ∞ =
∫
3.2.3Here, ID( )λ is the normalized emission spectrum of the donor, and ε λA( )is the spectral extinction coefficient of the acceptor.
Figure 3.2.2 Dependence of the FRET efficiency on r/R0..
As it is shown in Fig. 3.2.2, FRET is effective in the region where r ≤ R0. As the energy transfer takes place, several observations are carried out for the investigation. These could be mentioned as the decrease in the donor steady state emission spectra and the lifetime shortening, the increase in the acceptor emission spectra and the prolonged lifetime. The FRET observations are mostly carried over the donor lifetime measurements; in this thesis work, the energy transfer for different systems has been verified by different method of observations.
33
Chapter 4
Experimental Methods
The methods used in the experiments in the scope of this thesis include photoluminescence spectroscopy and photoluminescence excitation spectroscopy, absorption spectroscopy, quantum efficiency measurement, time resolved photoluminescence spectroscopy, transmission electron microscopy, X-ray photoelectron spectroscopy, inductively coupled plasma mass spectroscopy, thermal gravimetric analysis, quartz crystal microbalance, contact angle measurement, and mechanical testing.
4.1 Photoluminescence spectroscopy and
photoluminescence excitation spectroscopy
Photoluminescence and photoluminescence excitation measurements are commonly used to characterize the emission and excitation spectra of the samples. Photoluminescence measurements are carried out by setting the excitation wavelength and scanning the spectrum in the UV and visible, using monochromator equipped systems. In the photoluminescence excitation measurement, for a fixed emission wavelength, the excitation wavelength is scanned for a determined spectrum. The method determines the excitation wavelength appropriate to optically excite the samples.
In-film and in-solution photoluminescence and photoluminescence excitation measurements in this thesis are carried out using Varian Cary Eclipse Fluorescence Spectrometer and Horiba Yvon Fluorolog 3 system.
34
4.2 Absorption spectroscopy
Absorption measurements are used to investigate the interaction of the incident light with the sample. The monochromatic light incident on the sample is collected at the detector’s end to obtain the absorbance value at a specific photon energy comparing it with the blank sample on the complementary light path. Depending on the absorption characteristics of the sample, one can figure out the optical characteristics of the sample. In-solution absorption measurements allow us to determine the particle concentration of a known extinction coefficient or the extinction coefficient of the material with a known concentration, using Lambert-Beer Law. In-solution as well as in-film measurements are made by the Cary UV-VIS spectrophotometer in this thesis.
4.3 Quantum efficiency measurement
The photoluminescence quantum efficiency (also called the quantum yield) is the ratio of the emitted photons per absorbed photons. The calculation of the photoluminescence quantum yields for the QDs is subtle, thus a careful calculation is needed for the analysis. The quantum yield of an unknown sample is 2 2 ref ref ref ref A I n Q Q I A n = 4.3 1
Here Qdenotes the quantum efficiency; I, the spectrally integrated photon count; A, the absorbance value at the excitation wavelength used; and n is the
refractive index of the media. "ref "stands for the reference sample.
In order to determine the quantum yield of unknown species, the reference sample with a known quantum yield is used for comparison. In our calculations of the quantum efficiency, we generally use an organic dye, Rhodamine 6G
![Figure 2.2.1.2.1 Photoluminescence and absorption of organic CdSe QDs at room temperature (Reproduced with permission after [77] .)](https://thumb-eu.123doks.com/thumbv2/9libnet/5740266.115526/39.893.220.741.435.835/figure-photoluminescence-absorption-organic-cdse-temperature-reproduced-permission.webp)

