Research Article
Evaluating Stable Chronic Obstructive Pulmonary
Disease by Ultrasound
Togay Evrin ,
1Semih Korkut,
2Leyla Ozturk Sonmez ,
3,4Lukasz Szarpak ,
5Burak Katipoglu ,
1Jacek Smereka ,
6Ramazan Guven ,
7and Evrim Eylem Akpinar
8 1Department of Emergency Medicine, Ufuk University Medical Faculty, Dr. Ridvan Ege Education and Research Hospital,Ankara, Turkey
2Department of Emergency Medicine, University of Health Sciences, Kartal Dr. L¨utfi Kırdar Training and Research Hospital,
Istanbul, Turkey
3Department of Physiology, Selcuk University Faculty of Medicine, Konya, Turkey
4Department of Emergency Medicine, Necmettin Erbakan University, Meram Faculty of Medicine, Konya, Turkey 5Lazarski University, Medical Faculty, Warsaw, Poland
6Department of Emergency Medical Services, Wroclaw Medical University, Wroclaw, Poland
7Department of Emergency Medicine, University of Health Sciences, Kanuni Sultan S¨uleyman Training and Research Hospital,
Istanbul, Turkey
8Department of Chest Diseases, Ufuk University Medical Faculty, Dr Ridvan Ege Education and Research Hospital,
Ankara, Turkey
Correspondence should be addressed to Leyla Ozturk Sonmez; ozturkleyla@gmail.com
Received 11 May 2019; Revised 12 July 2019; Accepted 16 August 2019; Published 15 September 2019 Academic Editor: Selim Suner
Copyright © 2019 Togay Evrin et al. This is an open access article distributed under the Creative Commons Attribution License, which permits unrestricted use, distribution, and reproduction in any medium, provided the original work is properly cited.
Background and Aim. The purpose of the study was to evaluate the relationship between COPD severity and the diaphragmatic
function measured by point-of-care US in patients with stable COPD. Method. A total of 61 patients with COPD and 40 healthy subjects who had been admitted to Ufuk University Hospital between December 2018 and May 2019 were enrolled. Point-of-care US was performed, and lung silhouette and anterior, right, and left hemidiaphragm method in M-mode were used to evaluate the diaphragm. Results. The point-of-care US measurements, lung silhouette method right (Lung Sil R), lung silhouette method left (Lung Sil L), right hemidiaphragm US method in B-mode (Ant B-Mode R), and right hemidiaphragm US method in M-mode (Ant M-Mode R), were significantly different among groups (P < 0.001 for each). FEV1 was strongly correlated with Lung Sil R, Lung Sil L, Ant B-Mode R, and Ant M-Mode R (r � 0.963, P < 0.001; r � 0.956, P < 0.001; r � 0.953, P < 0.001; and r � 0.917, and
P< 0.001, respectively). Negative correlations were detected between the number of exacerbations per year and Lung Sil R and the
number of exacerbations per year and Ant M-Mode R (r � − 0.599, P < 0.001 and r � − 0.587, and P < 0.001, respectively).
Conclusion. In this study, FEV1 and annual number of exacerbations turned out to be strongly correlated US findings. The use of
US in COPD patients could help to support clinical decision, but further clinical studies are necessary to confirm those findings.
1. Introduction
Chronic obstructive pulmonary disease (COPD) is a het-erogeneous and progressive disease characterized by re-stricted airflow. It is associated with high morbidity and mortality and increasing social and economic burdens worldwide [1, 2]. Previous studies have shown that the forced expiratory volume in 1 s (FEV1) is not an adequate
measure to determine the severity of COPD [3]. For this reason, the 2011 update of the Global Initiative for Chronic Obstructive Lung Disease (GOLD) criteria proposed an assessment based on symptoms and inflammation to de-termine the disease severity, manage the treatment, and estimate the prognosis of COPD [3]. In contrast, the 2017 update suggested that spirometry be used exclusively to diagnose COPD and that FEV1 be removed from the
Volume 2019, Article ID 5361620, 8 pages https://doi.org/10.1155/2019/5361620
2 cm during resting breathing, its movement during forced breathing reaches 7–11 cm [7].
As no suitable tests are available to determine the function of the diaphragm, diaphragmatic dysfunction is not generally recognized; however, the need for an evaluation is significant for both inpatients and outpatients, especially during emergencies [8]. There are many methods to evaluate diaphragmatic function, of which transdiaphragmatic pressure measurement is the gold standard for diagnosis [9, 10].
The techniques traditionally used to diagnose di-aphragmatic weakness or paralysis are invasive, expose patients to radiation, or require them to leave the room (electromyography and fluoroscopy). In addition, they may be time-consuming, indirect, and uncomfortable (trans-diaphragmatic pressure measurement and plethysmogra-phy) or complex and expensive (dynamic ecoplanar magnetic resonance imaging) [6].
M- and B-mode ultrasonography (US) was first used by Haber et al. in 1975 to evaluate diaphragm movement [11]. Subsequently, despite the many definitions for di-aphragmatic movement and tidal volume, the value of bedside US for evaluating diaphragmatic paralysis in in-tensive care was confirmed by Dorffner et al. in 1998, with a 100% sensitivity [12]. Quantitative US, which is applied to assess severe diaphragmatic dysfunction on the basis of transdiaphragmatic pressure measurements, was described by Lerolle et al. in 2009 [13].
The use of US for structural and functional evaluations of the diaphragm is increasing. It has been reported that di-aphragmatic thickness fraction measurements are suitable for determining lung hyperinflation in patients with COPD [2]. For this reason, diaphragm examination by point-of-care US may be helpful for evaluating the disease status and outcomes in COPD patients [2, 14].
The purpose of the present study was to evaluate the relationship between COPD severity and the diaphragmatic function measured by point-of-care US in patients with stable COPD.
2. Materials and Methods
2.1. Study Design and Setting. This observational
case-con-trol study was performed at a large tertiary referral academic institution after receiving the institutional review board approval. All patients provided their verbal consent and signed a written consent form. The diagnosis of COPD was based on medical history, clinical examinations, and
accordance with the American Thoracic Society standards. A total of 61 patients with COPD and 40 healthy subjects who had been admitted to Ufuk University Hospital between December 2018 and May 2019 were enrolled. Patients with malignancies, neuromuscular conditions, cerebrovascular diseases, unilateral or bilateral pleural effusion, pneumo-thorax, atelectasis, pneumonia, interstitial lung diseases, recent surgical operations, COPD exacerbations within the previous 3 months, and refusal to participate in the study were excluded. Comorbidities, including cardiac in-sufficiency, hypertension, renal inin-sufficiency, and diabetes mellitus, were queried and recorded.
2.2. Measurements. US was performed with a Terason
Usmart 3200T ultrasound system (77 Terrace Hall Avenue Burlington, MA 01803 United States) and a 3.5 MHz curved probe.
2.2.1. Lung Silhouette Method (Lung Sil Right and Lung Sil Left). The upward and downward movements of the lung
silhouette in the scapular line were measured. All partici-pants were evaluated in a sitting position. The transducer was placed at the lowest part of the lung silhouette in the scapular line. The probe orientation should be longitudinal scan. The patient was instructed to exhale as deeply as possible to the residual volume and then to inhale deeply to the total lung capacity. This manoeuver was filmed, and the distance between the highest and lowest points of the lung silhouette was measured 3 times and the mean value was calculated. This manoeuver was performed on the right and left sides [16–20] (Figures 1(a)–1(c)).
2.2.2. Right Hemidiaphragm US Method in B-Mode (Ant B-Mode Right). The upward and downward movements of
the right diaphragmatic dome were measured from the anterior position. All participants were evaluated by US in a completely supine position. The transducer was placed in the area between the anterior axillary line and the midclavicular line, with the liver as a US window directed toward the diaphragmatic dome. The probe orientation should be longitudinal scan. The participant was instructed to exhale as deeply as possible to the residual volume and then to inhale deeply to the total lung capacity. This manoeuver was filmed, and the distance between the highest and lowest points of the right hemidiaphragmatic dome was measured. This method was performed only on the right hemidiaphragmatic side
because of the known difficulties that accompany left side measurements with the spleen and stomach as the US window (Figures 2(a)–2(c)) [16–20].
2.2.3. Right and Left Hemidiaphragms US Method in M-Mode (Ant B-Mode Right and Ant B-Mode Left). The
probe was placed between the midclavicular and anterior axillary lines into the subcostal area and was directed me-dially, cranially, and dorsally, so that the US beam was perpendicular to the posterior third of the right and left hemidiaphragms. The probe orientation should be longitu-dinal scan. Diaphragmatic movements were recorded in M-mode. This manoeuver was started at the end of normal expiration, and the volunteers and COPD patients were asked to inhale as deeply as possible. The subcostal or low intercostal probe position was chosen between the anterior and mid axillary lines to obtain the best image of the left hemi-diaphragmatic dome. Motion was recorded during the same respiratory manoeuvers as for the right hemidiaphragm. The inspiratory amplitudes (excursions) of the diaphragm were measured by M-mode US. The first calliper was placed at the foot of the inspiration slope on the diaphragm echoic line and the second one at the apex of this slope for the deep breathing measurements (Figure 2(d)) [20].
All ultrasonographic measurements (lung silhouette method, right hemidiaphragm US method in B-mode, and right and left hemidiaphragms US method in M-mode) were made by the same emergency medicine specialist certified in lung and diaphragmatic US (POCUS), who was blinded to the clinical characteristics and pulmonary function status of each patient. Several respiratory cycles were recorded, and the measurements from at least three different cycles were averaged for each US method.
2.3. Statistical Analysis. The data were statistically analysed
with the SPSS 25.0 software (IBM Corp., Armonk, NY, USA). The categorical measurements were reported as
numbers and percentages, and the Shapiro–Wilk test was performed to determine the normality of the continuous variable distributions, the results of which are presented as medians (quartiles). The Kruskal–Wallis test served to compare nonnormally distributed variables. Differences in the continuous variables among the four groups were considered significant at P < 0.05/6. The chi-squared test was applied to compare the categorical variables, and the Monte Carlo simulation test was used for the significance level of scores <5. Spearman’s correlation analysis allowed to de-termine the correlations among the US measurements: lung silhouette right (Lung Sil R), lung silhouette left (Lung Sil L), anterior B-mode right (Ant B-Mode R), anterior M-mode right (Ant M-Mode R), and anterior M-mode left (Ant M-Mode L). The level of P < 0.05 was considered significant.
3. Results
A total of 85 patients with COPD met the inclusion criteria of this study. Of these, 21 were excluded because they had suffered from COPD exacerbations within the past 3 months, and 3 were excluded because they could not undergo bedside US owing to patient or technical limita-tions. Therefore, 61 patients with COPD who did not meet the exclusion criteria were included in the study; 80.3% (n � 49) were males and 19.7% (n � 12) were females. The median age of the participants was 70.0 (interquartile range (IQR), 64.0–78.5) years. The demographic characteristics of control group and GOLD A, GOLD B, GOLD C, and GOLD D groups are shown in Table 1, with sex, age, and annual number of seizures different among the groups (P < 0.001 for each). The number of annual exacerbations was the highest in GOLD D group and the median (IQR) annual number of exacerbations in this group equalled 2.0 (1.0). Five point-of-care US measurements, Lung Sil R, Lung Sil L, Ant B-Mode R, Ant M-Mode R, and Ant M-Mode L, were significantly different among the patient groups (P < 0.001 for each) (Table 2). The lowest and highest median values of
(a) (b) (c)
Figure 1: (a) Sonographic measurement of the upward and downward movements of the lung silhouette, here on the right side (lung silhouette method). The patient is sitting; the transducer is placed at the lowest point of the lung silhouette in the scapular line. While the patient breathes as deeply as possible, a video sequence is performed. Afterward, the distance between maximal inspiration and maximal expiration can be measured. (b) Sonographic measurement of the upward and downward movements of the lung silhouette, here on the right side. E marks the lowest point of the lung silhouette at maximal end expiration. (c) Sonographic measurement of the upward and downward movements of the lung silhouette—here on the right side. E marks the lowest point of the lung silhouette at maximal end expiration, and I marks the lowest point at maximal inspiration. In this example, the distance between E and I is 35.3 mm.
these US measurements were detected among patients in GOLD D group and those in GOLD A group, respectively (lowest vs. highest: 27.6 vs. 48.8 mm, 27.7 vs. 48.8 mm, 34.0 vs. 53.2 mm, 34 vs. 45 mm, and 34 vs. 46 mm, respectively) (Figure 3).
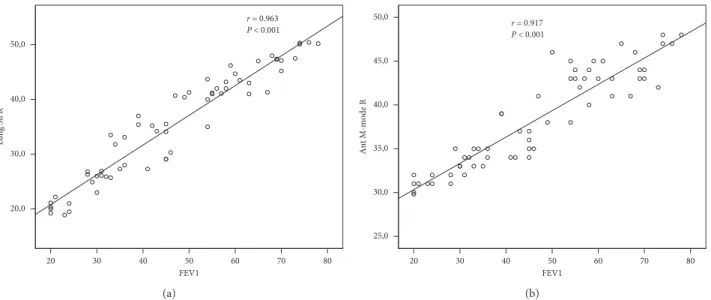
The correlations between the US findings and FEV1 and their significance levels are shown in Table 3. FEV1 was strongly correlated with Lung Sil R, Lung Sil L, Ant B-Mode R, Ant M-Mode R, and Ant M-Mode L L (r � 0.963,
P< 0.001; r � 0.956, P < 0.001; r � 0.953, P < 0.001; and
movements of the right diaphragmatic dome were measured from the anterior position. The probe orientation should be longitudinal scan (right hemidiaphragm US method in B-mode and M-mode). (b and c) B-mode ultrasound evaluation of the craniocaudal displacement of the left branch of the portal vein in a patient with COPD. The position of the vessel was marked by the calliper during forced expiration and inspiration manoeuvres. The line shows displacement of the left branch of the portal vein during maximal inspiratory and expiratory breathing in the sagittal plane. The craniocaudal displacement of this branch was registered in millimetres. E marks at maximal end expiration, and I marks the lowest point at maximal inspiration. The distance between E and I is 41 mm (Ant B-Mode R). (d). M-mode scan of the right hemidiaphragmatic dome at maximal inspiration The first calliper was placed at the foot of the inspiration slope on the diaphragm echoic line and the second one at the apex of this slope for the deep breathing measurements (Ant M-Mode R: 42.7 mm).
Table 2: Pulmonary function test values and significance levels with ultrasonographic findings according to the COPD stage and control group. Control group (n � 40) GOLD A (n � 6) GOLD B (n � 6) GOLD C (n � 15) GOLD D (n � 34) P value
Lung Sil R (mm), median (IQR) 66.0 (4.5) 48.8 (3.1) 44.1 (9.5) 41.0 (9.6) 27.6 (15.1) <0.001
Lung Sil L (mm), median (IQR) 66.1 (4.0) 48.8 (4.4) 44.3 (8.9) 40.7 (9.1) 27.7 (12.1) <0.001
Ant B-Mode R (mm), median (IQR) 71 (5.0) 53.2 (3.8) 45.5 (8.2) 42.2 (8.5) 34.0 (13.0) <0.001
Ant M-mode R (mm), median
(IQR) 69.0 (3.8) 45 (4.0) 44 (5.0) 43 (9.0) 34 (7.0) <0.001
Ant M-mode L (mm), median
(IQR) 70 (6.0) 46 (3.0) 45 (5.0) 42 (7.0) 34 (6.0) <0.001
FVC (%), median (IQR) 98.5 (20) 92.5 (7) 72.0 (18.0) 67.0 (17.0) 55.0 (29.0) <0.001
FEV1 (%), median (IQR) 94.0 (19) 72.0 (8.0) 59.5 (14.0) 54.0 (18.0) 34.5 (19.0) <0.001
FEV1/FVC (%), median (IQR) 91.0 (9) 66.5 (2.0) 63. (6.0) 63.0 (13.0) 47.5 (18.0) <0.001
COPD: chronic obstructive pulmonary disease; GOLD: Global Initiative for Chronic Obstructive Lung Disease; IQR: interquartile range; FVC: forced vital capacity; FEV1: forced expiratory volume in 1 s.
Table 1: Demographic characteristics and significance levels in control group and COPD patients according to their stages. Control group (n � 40) GOLD A (n � 6) GOLD B (n � 6) GOLD C (n � 15) GOLD D (n � 34) P value Male, n (%) 34 (85.0) 1 (16.7) 3 (50.0) 13 (86.7) 32 (94.1) <0.001
Age, median (IQR) 67.5 (10.0) 58.0 (7.0) 78.5 (15.0) 65.0 (16.0) 71.0 (13.0) <0.001
Number of exacerbations in the previous
year, median (IQR) — 0.50 (1.0) 1.0 (1.0) 1.0 (0.0) 2.0 (1.0) <0.001
Smoking, n (%) 23 (57.5) 6 (100.0) 6 (100.0) 15 (100.0) 31 (91.2) 0.836
BMI, median (IQR) 27.1 (3.8) 28.2 (5.1) 25.9 (6.5) 26.5 (7.5) 24.5 (4.0) 0.095
CHD, n (%) 1 (2.5) 0 (0.0) 3 (50.0) 2 (13.3) 11 (32.4) 0.115
CHF, n (%) 1 (2.5) 3 (50.0) 1 (16.7) 2 (13.3) 4 (11.8) 0.115
DM, n (%) 5 (12.5) 0 (0.0) 1 (16.7) 6 (40.0) 9 (26.5) 0.279
HT, n (%) 10 (25.0) 6 (100.0) 1 (16.7) 10 (66.7) 20 (58.8) 0.033
Data are expressed as mean ± standard deviation for normally distributed data and percentage for categorical variables. COPD: chronic obstructive pulmonary disease; GOLD: Global Initiative for Chronic Obstructive Lung Disease; IQR: interquartile range; BMI: body mass index; CHD: coronary heart disease; CHF: congestive heart failure; DM: diabetes mellitus; HT: hypertension.
r � 0.917, P < 0.001; r � 0.947, P < 0.001, respectively)
(Figures 4(a) and 4(b)).
Significant negative correlations were detected between the number of exacerbations per year Lung Sil R and Ant M-Mode R (r � − 0.599, P < 0.001; r � − 0.587, P < 0.001, re-spectively) (Figures 5(a) and 5(b)).
The control group consisted of 40 healthy volunteers; 85.0% (n � 34) were males and 15% (n � 6) were females, with a median age of 67.5 (IQR, 63.0–73.0) years. The median US (IQR) values were 66.0 mm (4.5) for Lung Sil R, 66.1 mm (4.0) for Lung Sil L, 69.0 mm (3.8) for Ant B-Mode R, and 7.1 cm (0.5) for Ant M-Mode R. The statistical sig-nificance of the US finding differences between the control and COPD groups is shown in Table 2.
For the assessment of the US operator’s skills across the study period, the correlation between FEV1-US findings (e.g., Lung Sil R) of the first 10 patients and the FEV1-US findings (e.g., Lung Sil R) of the last 10 patients was evaluated (r � 0.936, P < 0.001). It was ob-served that the correlation between FEV1-Lung Sil R of
the first and the last 10 patients (r � 0.912, P < 0.001) was strong.
4. Discussion
This is the first study conducted among patients with COPD who were graded in accordance with the updated GOLD classification. Some research concerning lung US followed the former GOLD classification. In many studies, diaphragm replacement was measured with the use of FEV1, and the lung silhouette and anterior US B-mode measurements were correlated with the M-mode mea-surements [19, 21]. Therefore, new studies need to be performed on the new GOLD classification with respect to US. In our study, patients were classified with the new GOLD classification, and both the right and left US measurements were compared; the diaphragmatic mea-surements using the lung silhouette method were strongly correlated with the FEV1, anterior method B-mode, and M-mode measurements.
10
Gold A Gold B Gold C Gold D
20 30 40 50 60 Lung Sil R Lung Sil L Ant B-mode R Ant M-mode L Ant M-mode R
Figure 3: Box and whisker plot. Lung Sil R (mm), Lung Sil L (mm), Ant M-mode R (mm), Ant M-Mode L (mm), and Ant B-Mode R (mm) values in patients with COPD in accordance with GOLD classification in 95% confidence interval.
Table 3: Correlation between FEV1 and ultrasonographic findings.
Variables Control (n � 40) COPD (n � 61)
Correlation coefficient Pvalue Correlation coefficient Pvalue
Lung Sil R 0.522 0.001 0.963 <0.001
Lung Sil L 0.535 <0.001 0.956 <0.001
Ant B-Mode R 0.599 <0.001 0.953 <0.001
Ant M-Mode R 0.682 <0.001 0.917 <0.001
Ant M-Mode L 0.747 <0.001 0.947 <0.001
The lung silhouette method is a technologic-device-supported model of the lung percussion in which di-aphragmatic dysfunction is evaluated by the up and down movements of the right and left hemidiaphragms over the scapular line. The method is a version of the former di-aphragm model.
Previous studies showed that the results of this method were strongly correlated with those of the anterior axillary method and that the method was easily performed in all patients, including obese ones, feasibly applied together with US, and suitable for evaluating both hemidiaphragms [19, 22]. In our study, no significant differences were de-tected between the techniques in terms of measuring di-aphragmatic dysfunction on both sides using the anterior method, and the correlations between the two techniques were strong. Although no significant differences were
detected between the right and left evaluations when using either method, evaluation based on the right anterior method measurements may be more useful, especially in patients who cannot assume the interscapular image posi-tion during point-of-care US. Creating a window and capturing the appropriate image may be more difficult on the left side because of gastric gas [23], so the right side is preferred for imaging convenience.
One of the most important findings of the present study was the strong correlation detected between the lung sil-houette images taken from the interscapular line and images taken with the anterior method and FEV1. A similar relation was found in a previous study; however, the cor-relation coefficient was not 100% [1]. The authors of that study attributed their results to different diaphragmatic effects among patients with different types of emphysema.
20,0 30 40 50 60 70 80 20 FEV1 (a) 20 30 40 50 FEV1 60 70 80 25,0 (b)
Figure 4: Correlation between (a) Lung Sil R (mm) and FEV1 (%) in COPD patients and (b) Ant M-Mode R (mm) and FEV1 (%) in COPD Patients. r = –0.599 P < 0.001 20,0 30,0 40,0 50,0 Lun g S il R 0 1 2
Exacerbations per year3 4 5 6
(a) r = –0.587 P < 0.001 25,0 30,0 35,0 40,0 45,0 50,0 An t M-mo de R 0 1 2
Exacerbations per year
3 4 5 6
(b)
Figure 5: Correlation between (a) Lung Sil R (mm) and number of exacerbations per year and (b) Ant M-Mode R (mm) and number of exacerbations per year.
Some studies report that diaphragmatic dysfunction may be different in basal-predominant and apical-predominant emphysema [24]. As the lung silhouette method and M-mode measurements have been correlated with FEV1 [25, 26], the operator can use the anterior axillary method in patients who are unable to sit and the lung silhouette method in those who cannot reach. Depending on the condition of the patient or the comfort of the doctor, both methods may be preferred, particularly for emergency services, when the patient is difficult to position.
Another important finding of the present study was that as the number of exacerbations per year increased in a patient, the measurements made with the lung silhouette and anterior axillary methods showed negative correlations. The US measurements of the patients were not taken during an exacerbation. However, the role of US diaphragmatic measurements in predicting the number of exacerbations per year should be clarified via more comprehensive studies conducted on the basis of our study results. This may help emergency medicine physicians in deciding on discharge vs. hospitalization.
Patients with stable COPD were included in the present study. For this reason, the use of data from emergency services may be confusing; however, patients who are ad-mitted with respiratory distress to emergency services are relieved by various treatments. The results of this study may help in making the decision on hospitalization vs. discharge after the recovery of the patient’s condition. In addition, this is a pioneer study in terms of its implementation in emergency services. Further research is needed to determine the predictive power of a diaphragmatic functional evalu-ation by US. If the severity of the exacerbevalu-ations can be determined with US in the most comfortable position, US may play a role in the decision on early intubation, intensive care follow-up, or hospitalization. A multicentre study in a larger group of patients with exacerbations is needed to support the findings of our study.
The study had some limitations. First, the number of patients with COPD was limited, and the study was con-ducted at a single centre. Thus, the population might not be representative of all patients with COPD. Second, the di-aphragmatic measurements were performed by only one emergency specialist. This may have caused an un-derestimation of the results based on interobserver varia-tions. The inclusion of patients with stable COPD only was another limitation, because the results are not applicable to COPD patients during an exacerbation period, and this fact limits the therapeutic decisions to be made based on US in exacerbated patients. Since an adequate measurement of diaphragmatic thickness fraction is difficult in daily practice, we did not use its parameters in this study.
5. Conclusion
In this study, FEV1 and annual number of exacerbations turned out strongly correlated US findings. The use of US in COPD patients could help to support clinical decision, but further clinical studies are necessary to confirm those findings.
Data Availability
The US findings data used to support the findings of this study have been deposited in the Togay Evrin’s repository.
Ethical Approval
All procedures performed in studies involving human participants were in accordance with the ethical standards of the institutional and/or national research committee and with the 1964 Helsinki Declaration and its later amendments or comparable ethical standards.
Consent
Consent according to Helsinski declaration was taken from Ufuk University Faculty of Medicine ethics committee be-fore the study (no: 20190430/2).
Conflicts of Interest
The authors declare no potential conflicts of interest with respect to the research, authorship, and/or publication of this article.
Authors’ Contributions
Togay Evrin involved in project development, data collec-tion, data analysis, and manuscript writing. Semih Korkut was responsible for data analysis and manuscript writing. Leyla Ozturk Sonmez involved in project development and manuscript writing. Lukasz Szarpak was responsible for data analysis and data collection. Burak Katipoglu involved in project development and data collection. Jacek Smereka and Ramazan Guven performed data analysis and manuscript writing. Evrim Eylem Akpinar involved in project devel-opment and data collection.
References
[1] A. Bastian, N. Scheibe, N. Sosnowski, A. Pinkhasik, and S. Vonderbank, “Sonographic evaluation of diaphragmatic dysfunction in COPD patients,” International Journal of
Chronic Obstructive Pulmonary Disease, vol. 10, pp. 1925–
1930, 2015.
[2] E. Ery¨uksel, C. Cims¸it, M. Bekir, Ç. Cimsit, and S. Karakurt, “Diaphragmatic thickness fraction in subjects at high-risk for COPD exacerbations,” Respiratory Care, vol. 62, no. 12, pp. 1565–1570, 2017.
[3] Global Initiative for Chronic Obstructive Lung Disease (GOLD), Global Strategy for the Diagnosis, Management and
Prevention of COPD, Global Initiative for Chronic Obstructive
Lung Disease (GOLD), Fontana, WI, USA, 2011, http://www. goldcopd.org/.
[4] The Global Initiative for Chronic Obstructive Lung Disease (GOLD), “Global strategy for the diagnosis, management, and prevention of chronic obstructive pulmonary disease,” January 2017.
[5] C. A. C. Ottenheijm, L. M. A. Heunks, G. C. Sieck et al., “Diaphragm dysfunction in chronic obstructive pulmonary disease,” American Journal of Respiratory and Critical Care
paralysis,” Lung, vol. 167, no. 1, pp. 323–341, 1989. [9] F. D. McCool and G. E. Tzelepis, “Dysfunction of the
di-aphragm,” New England Journal of Medicine, vol. 366, no. 10, pp. 932–942, 2012.
[10] M. Green, J. Road, G. C. Sieck, and T. Similowski, “ATS/ERS statement on respiratory muscle testing, 2. tests of respiratory muscle strength,” American Journal of Respiratory and
Critical Care Medicine, vol. 166, pp. 518–624, 2002.
[11] K. Haber, W. M. Asher, and A. K. Freimanis, “Echographic evaluation of diaphragmatic motion in intra-abdominal diseases,” Radiology, vol. 114, no. 1, pp. 141–144, 1975. [12] R. Dorffner, K. Eibenberger, S. Youssefzadeh et al.,
“Wer-tigkeit der sonographie auf der intensivstation zur diagnostik von zwerchfellparesen,” R¨oFo—Fortschritte auf dem Gebiet
der R¨ontgenstrahlen und der bildgebenden Verfahren, vol. 169,
no. 9, pp. 274–277, 1998.
[13] N. Lerolle, E. Gu´erot, S. Dimassi et al., “Ultrasonographic diagnostic criterion for severe diaphragmatic dysfunction after cardiac surgery,” Chest, vol. 135, no. 2, pp. 401–407, 2009. [14] K. Okura, A. Kawagoshi, M. Iwakura et al., “Contractile ca-pability of the diaphragm assessed by ultrasonography pre-dicts nocturnal oxygen saturation in COPD,” Respirology, vol. 22, no. 2, pp. 301–306, 2017.
[15] Y. Gerlach, M. T. Williams, and A. M. Coates, “Weighing up the evidence-a systematic review of measures used for the sensation of breathlessness in obesity,” International Journal
of Obesity, vol. 37, no. 3, pp. 341–349, 2013.
[16] J. Ueki, P. F. De Bruin, and N. B. Pride, “In vivo assessment of diaphragm contraction by ultrasound in normal subjects,”
Thorax, vol. 50, no. 11, pp. 1157–1161, 1995.
[17] D. Cohn, J. O. Benditt, S. Eveloff, and F. D. McCool, “Di-aphragm thickening during inspiration,” Journal of Applied
Physiology, vol. 83, no. 1, pp. 291–296, 1997.
[18] N. S. G. Toledo, S. K. Kodaira, P. C. B. Massarollo, O. I. Pereira, and S. Mies, “Right hemidiaphragmatic mobility: assessment with US measurement of craniocaudal displace-ment of left branches of portal vein,” Radiology, vol. 228, no. 2, pp. 389–394, 2003.
[19] A. Boussuges, Y. Gole, and P. Blanc, “Diaphragmatic motion studied by M-mode ultrasonography,” Chest, vol. 135, no. 2, pp. 391–400, 2009.
[20] J. G. Houston, A. D. Morris, C. A. Howie, J. L. Reid, and N. McMillan, “Technical report: quantitative assessment of diaphragmatic movement—a reproducible method using ultrasound,” Clinical Radiology, vol. 46, no. 6, pp. 405–407, 1992.
[21] A. Testa, G. Soldati, R. Giannuzzi, S. Berardi, G. Portale, and N. Gentiloni Silveri, “Ultrasound M-mode assessment of diaphragmatic kinetics by anterior transverse scanning in healthy subjects,” Ultrasound in Medicine & Biology, vol. 37, no. 1, pp. 44–52, 2011.
[25] R. Pellegrino, G. Viegi, V. Brusasco et al., “Interpretative strategies for lung function tests,” European Respiratory
Journal, vol. 26, no. 5, pp. 948–968, 2005.
[26] A. Zanforlin, A. Smargiassi, R. Inchingolo, A. di Marco Berardino, S. Valente, and E. Ramazzina, “Ultrasound analysis of diaphragm kinetics and the diagnosis of airway obstruction: the role of the M-mode index of obstruction1,” Ultrasound in
Stem Cells
International
Hindawi www.hindawi.com Volume 2018 Hindawi www.hindawi.com Volume 2018 INFLAMMATIONEndocrinology
International Journal ofHindawi www.hindawi.com Volume 2018 Hindawi www.hindawi.com Volume 2018
Disease Markers
Hindawi www.hindawi.com Volume 2018 BioMed Research InternationalOncology
Journal of Hindawi www.hindawi.com Volume 2013 Hindawi www.hindawi.com Volume 2018Oxidative Medicine and Cellular Longevity
Hindawi
www.hindawi.com Volume 2018
PPAR Research
Hindawi Publishing Corporation
http://www.hindawi.com Volume 2013 Hindawi www.hindawi.com
The Scientific
World Journal
Volume 2018 Immunology Research Hindawi www.hindawi.com Volume 2018 Journal ofObesity
Journal of Hindawi www.hindawi.com Volume 2018 Hindawi www.hindawi.com Volume 2018 Computational and Mathematical Methods in Medicine Hindawi www.hindawi.com Volume 2018Behavioural
Neurology
Ophthalmology
Journal of Hindawi www.hindawi.com Volume 2018Diabetes Research
Journal ofHindawi
www.hindawi.com Volume 2018
Hindawi
www.hindawi.com Volume 2018 Research and Treatment
AIDS
Hindawi
www.hindawi.com Volume 2018
Gastroenterology Research and Practice
Hindawi www.hindawi.com Volume 2018